Category Archives: Federal Reserve policies and impacts

The Interest Rate Conundrum

It’s time to invoke the parable of the fox and the hedgehog. You know – the hedgehog knows one thing, sees the world through the lens of a single commanding idea, while the fox knows many things, entertains diverse, even conflicting points of view.

This is apropos of my reaction to David Stockman’s The Fed’s Painted Itself Into The Most Dangerous Corner In History—–Why There Will Soon Be A Riot In The Casino.

Stockman, former Director of Office of Management and Budget under President Ronald Reagan who later launched into a volatile career in high finance (See https://en.wikipedia.org/wiki/David_Stockman) currently lends his name to and writes for a spicy website called Contra Corner.

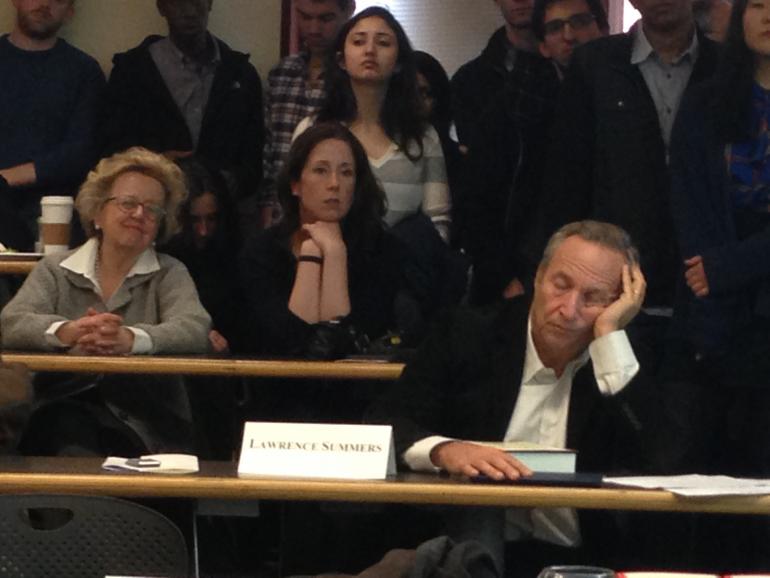
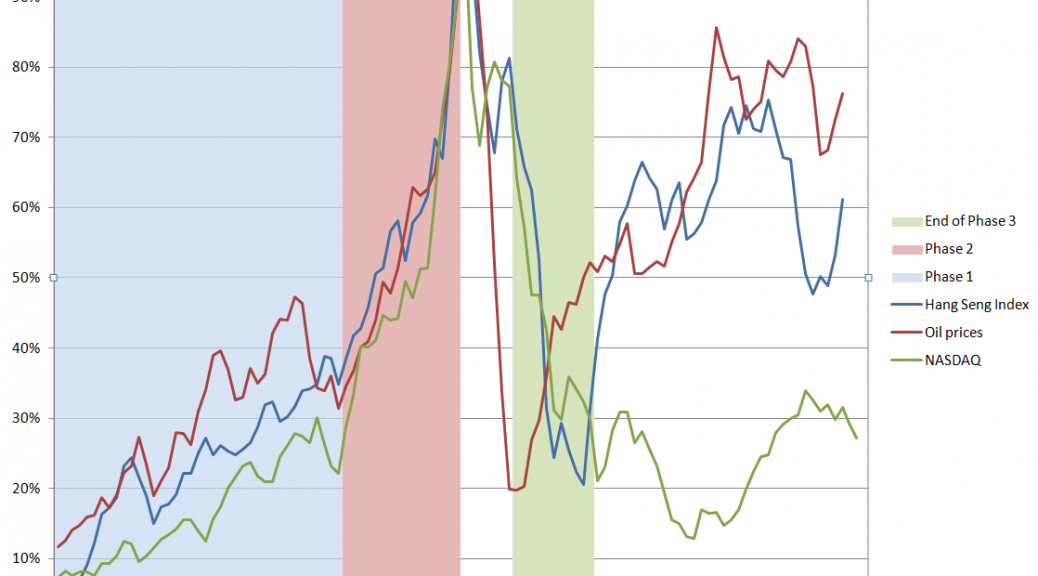
Stockman’s “Why There Will Soon Be a Riot in The Casino” pivots on an Op Ed by Lawrence Summers (Preparing for the next recession) as well as the following somewhat incredible chart, apparently developed from IMF data by Contra Corner researchers.

WEOchart

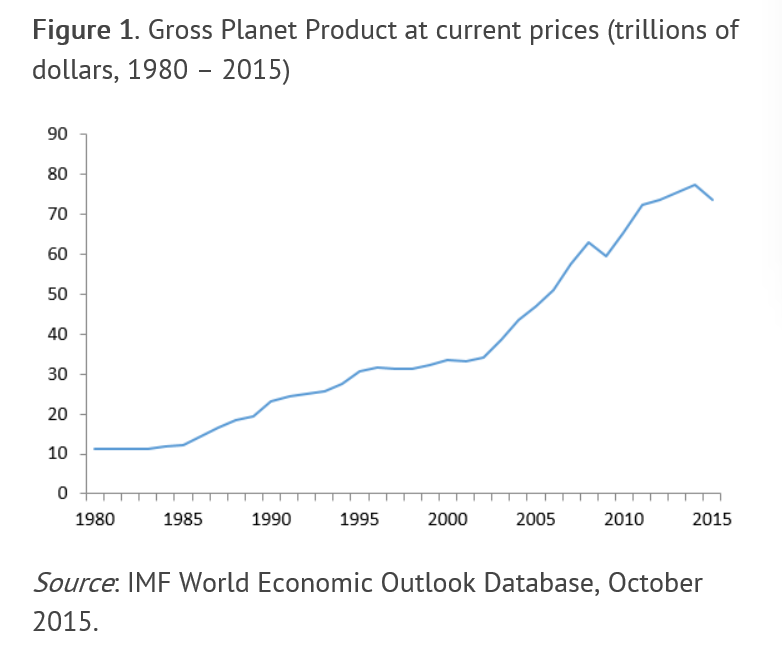
The storyline is that planetary production fell in current dollar terms in 2015. This isn’t because physical output or hours in service dropped, but because of the precipitous drop in commodity prices and the general pattern of deflation.

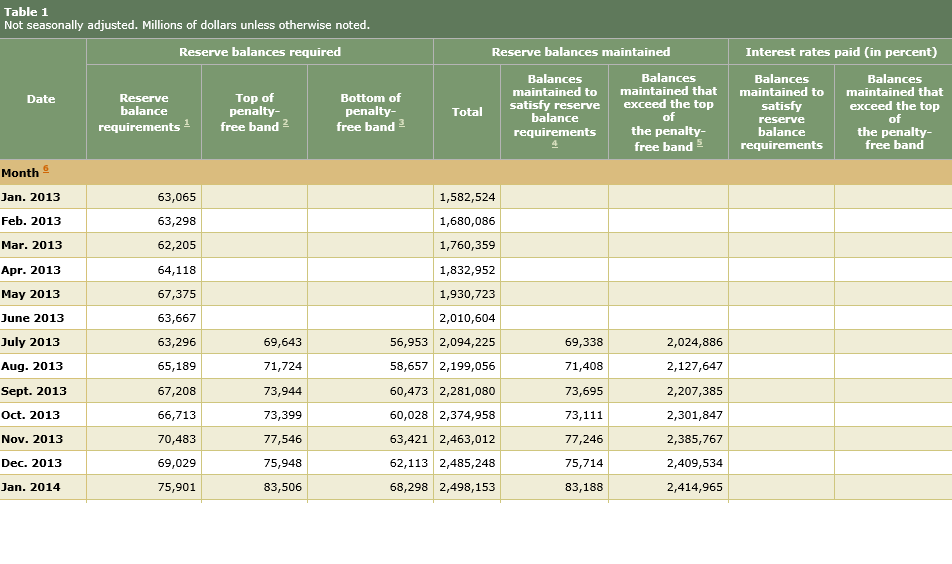
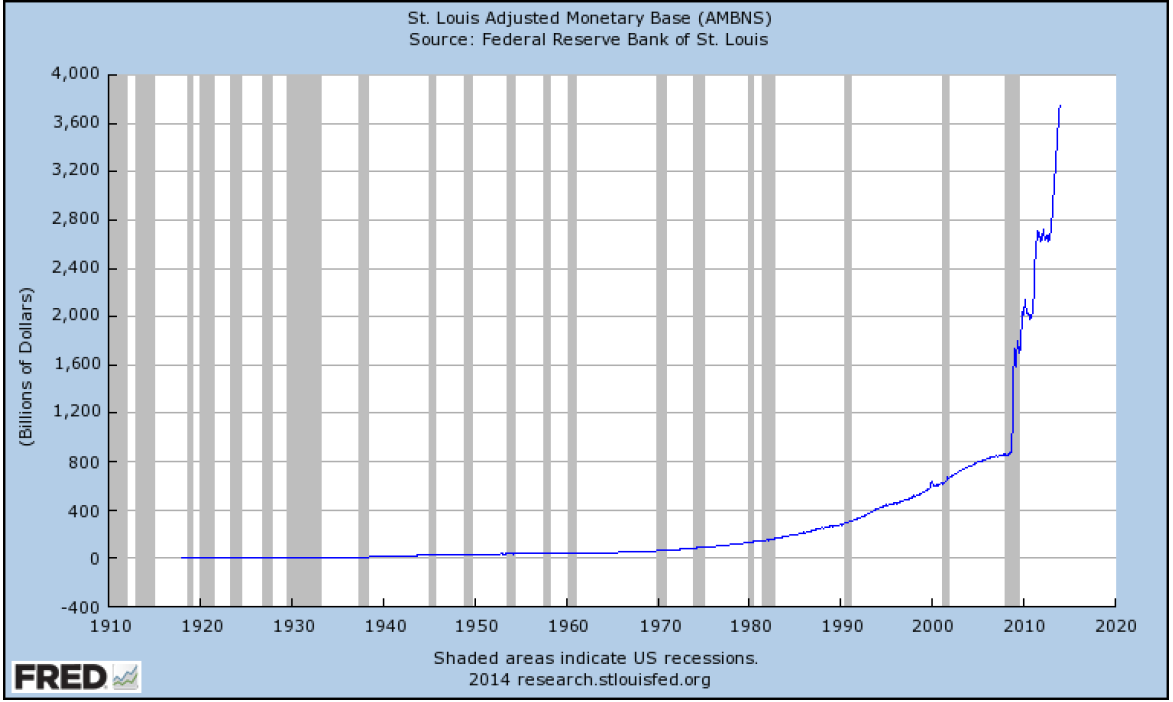
All this is apropos of the Fed’s coming decision to raise the federal funds rate from the zero bound (really from about 0.25 percent).

The logic is unassailable. As Summers (former US Treasury Secretary, former President of Harvard, and Professor of Economics at Harvard) writes –

U.S. and international experience suggests that once a recovery is mature, the odds that it will end within two years are about half and that it will end in less than three years are over two-thirds. Because normal growth is now below 2 percent rather than near 3 percent, as has been the case historically, the risk may even be greater now. While the risk of recession may seem remote given recent growth, it bears emphasizing that since World War II, no postwar recession has been predicted a year in advance by the Fed, the White House or the consensus forecast.

But

Historical experience suggests that when recession comes it is necessary to cut interest rates by more than 300 basis points. I agree with the market that the Fed likely will not be able to raise rates by 100 basis points a year without threatening to undermine the recovery. But even if this were possible, the chances are very high that recession will come before there is room to cut rates by enough to offset it. The knowledge that this is the case must surely reduce confidence and inhibit demand.

So let me rephrase this, to underline the points.

  1. Every business recovery has a finite length
  2. The current business recovery has gone on longer than most and probably will end within two or three years
  3. The US Federal Reserve, therefore, has a limited time in which to restore the federal funds rate to something like its historically “normal” levels
  4. But this means a rapid acceleration of interest rates over the next two to three years, something which almost inevitably will speed the onset of a business downturn and which could have alarming global implications
  5. Thus, the Fed probably will not be able to restore the federal funds rate – actually the only rate they directly control – to historically normal values
  6. Therefore, Fed tools to combat the next recession will be severely constrained.
  7. Given these facts and suppositions, secondary speculative/financial and other responses can arise which themselves can become major developments to deal with.

Header pic of fox and hedgehog from willpowered.co.

Coming Attractions

Well, I have been doing a deep dive into financial modeling, but I want to get back to blogging more often. It gets in your blood, and really helps explore complex ideas.

So- one coming attraction here is going to be deeper discussion of the fractal market hypothesis.

Ladislav Kristoufek writes in a fascinating analysis (Fractal Markets Hypothesis and the Global Financial Crisis:Scaling, Investment Horizons and Liquidity) that,

“..it is known that capital markets comprise of various investors with very different investment horizons { from algorithmically-based market makers with the investment horizon of fractions of a second, through noise traders with the horizon of several minutes, technical traders with the horizons of days and weeks, and fundamental analysts with the monthly horizons to pension funds with the horizons of several years. For each of these groups, the information has different value and is treated variously. Moreover, each group has its own trading rules and strategies, while for one group the information can mean severe losses, for the other, it can be taken a profitable opportunity.”

The mathematician and discoverer of fractals Mandelbrot and investor Peters started the ball rolling, but the idea maybe seemed like a fad of the 1980’s and 1990s.

But, more and more,  new work in this area (as well as my personal research) points to the fact that the fractal market hypothesis is vitally important.

Forget chaos theory, but do notice the power laws.

The latest  fractal market research is rich in mathematics – especially wavelets, which figure in forecasting, but which I have not spent much time discussing here.

There is some beautiful stuff produced in connection with wavelet analysis.

For example, here is a construction from a wavelet analysis of the NASDAQ from another paper by Kristoufek

Wavlet1

The idea is that around 2008, for example, investing horizons collapsed, with long term traders exiting and trading becoming more and more short term. This is associated with problems of liquidity – a concept in the fractal market hypothesis, but almost completely absent from many versions of the so-called “efficient market hypothesis.”

Now, maybe like some physicists, I am open to the discovery of deep keys to phenomena which open doors of interpretation across broad areas of life.

Another coming attraction will be further discussion of forward information on turning points in markets and the business cycle generally.

The current economic expansion is growing long in tooth, pushing towards the upper historically observed lengths of business expansions in the United States.

The basic facts are there for anyone to notice, and almost sound like a litany of complaints about how the last crisis in 2008-2009 was mishandled. But China is decelerating, and the emerging economies do not seem positioned to make up the global growth gap, as in 2008-2009. Interest rates still bounce along the zero bound. With signs of deteriorating markets and employment conditions, the Fed may never find the right time to raise short term rates – or if they plunge ahead will garner virulent outcry. Financial institutions are even larger and more concentrated now than before 2008, so “too big to fail” can be a future theme again.

What is the best panel of financial and macroeconomic data to watch the developments in the business cycle now?

So those are a couple of topics to be discussed in posts here in the future.

And, of course, politics, including geopolitics will probably intervene at various points.

Initially, I started this blog to explore issues I encountered in real-time business forecasting.

But I have wide-ranging interests – being more of a fox than a hedgehog in terms of Nate Silver’s intellectual classification.

I’m a hybrid in terms of my skill set. I’m seriously interested in mathematics and things mathematical. I maybe have a knack for picking through long mathematical arguments to grab the key points. I had a moment of apparent prodigy late in my undergrad college career, when I took graduate math courses and got straight A’s and even A+ scores on final exams and the like.

Mathematics is time consuming, and I’ve broadened my interests into economics and global developments, working around 2002-2005 partly in China.

As a trivia note,  my parents were immigrants to the US from Great Britain , where their families were in some respects connected to the British Empire that more or less vanished after World War II and, in my father’s case, to the Bank of England. But I grew up in what is known as “the West” (Colorado, not California, interestingly), where I became a sort of British cowboy and subsequently, hopefully, have continued to mature in terms of attitudes and understanding.

2014 in Review – I

I’ve been going over past posts, projecting forward my coming topics. I thought I would share some of the best and some of the topics I want to develop.

Recommendations From Early in 2014

I would recommend Forecasting in Data-Limited Situations – A New Day. There, I illustrate the power of bagging to “bring up” the influence of weakly significant predictors with a regression example. This is fairly profound. Weakly significant predictors need not be weak predictors in an absolute sense, providing you can bag the sample to hone in on their values.

There also are several posts on asset bubbles.

Asset Bubbles contains an intriguing chart which proposes a way to “standardize” asset bubbles, highlighting their different phases.

BubbleAnatomy

The data are from the Hong Kong Hang Seng Index, oil prices to refiners (combined), and the NASDAQ 100 Index. I arrange the series so their peak prices – the peak of the bubble – coincide, despite the fact that the peaks occurred at different times (October 2007, August 2008, March 2000, respectively). Including approximately 5 years of prior values of each time series, and scaling the vertical dimensions so the peaks equal 100 percent, suggesting three distinct phases. These might be called the ramp-up, faster-than-exponential growth, and faster-than-exponential decline. Clearly, I am influenced by Didier Sornette in choice of these names.

I’ve also posted several times on climate change, but I think, hands down, the most amazing single item is this clip from “Chasing Ice” showing calving of a Greenland glacier with shards of ice three times taller than the skyscrapers in Lower Manhattan.

See also Possibilities for Abrupt Climate Change.

I’ve been told that Forecasting and Data Analysis – Principal Component Regression is a helpful introduction. Principal component regression is one of the several ways one can approach the problem of “many predictors.”

In terms of slide presentations, the Business Insider presentation on the “Digital Future” is outstanding, commented on in The Future of Digital – I.

Threads I Want to Build On

There are threads from early in the year I want to follow up in Crime Prediction. Just how are these systems continuing to perform?

Another topic I want to build on is in Using Math to Cure Cancer. I’d like to find a sensitive discussion of how MD’s respond to predictive analytics sometime. It seems to me that US physicians are sometimes way behind the curve on what could be possible, if we could merge medical databases and bring some machine learning to bear on diagnosis and treatment.

I am intrigued by the issues in Causal Discovery. You can get the idea from this chart. Here, B → A but A does not cause B – Why?

casualpic

I tried to write an informed post on power laws. The holy grail here is, as Xavier Gabaix says, robust, detail-independent economic laws.

Federal Reserve Policies

Federal Reserve policies are of vital importance to business forecasting. In the past two or three years, I’ve come to understand the Federal Reserve Balance sheet better, available from Treasury Department reports. What stands out is this chart, which anyone surfing finance articles on the net has seen time and again.

FedMBandQEgraph

This shows the total of the “monetary base” dating from the beginning of 2006. The red shaded areas of the graph indicate the time windows in which the various “Quantitative Easing” (QE) policies have been in effect – now three QE’s, QE1, QE2, and QE3.

Obviously, something is going on.

I had fun with this chart in a post called Rhino and Tapers in the Room – Janet Yellen’s Menagerie.

OK, folks, for this intermission, you might want to take a look at Malcolm Gladwell on the 10,000 Hour Rule


So what happens if you immerse yourself in all aspects of the forecasting field?

Coming – how posts in Business Forecast Blog pretty much establish that rational expectations is a concept way past its sell date.

Guy contemplating with wine at top from dreamstime.


Calling the Next Recession – The Need for New Policy Responses

Yesterday I saw a headline on Reuters,

U.S. retail sales pause, seen rebounding in months ahead

with a story that made the best out of a recent stall in US consumer spending, especially for cars.

I also noticed –

Japan’s Economy Contracts Sharply

Real gross domestic product, the total value of all goods and services produced in the economy, shrank 6.8% in the three months through June on an annualized basis from the prior quarter

In Europe, the economic tea leaves suggest a developing recession in Italy, negative growth in Germany, and stasis in France, as highlighted in this Wall Street Journal graphic.

EUprospects

Mish Shedlock, furthermore, is all over the bizarre new data coming out of China on bank loans in the standard and shadow banking systems.

New Yuan Loans and Shadow Banking Collapse in China; Record Bank Deposit Slump

All this after the 1st Quarter surprise drop in US real GDP of -2.7 percent, quarter-over-quarter.

A Note on How I Forecast the Global Economy

So my experience is with enterprise level IT companies with markets in the major global economic regions – Europe, Japan, China, the US and the ROW (rest of the world).

The idea is to keep tabs on regional developments to predict sales and, in some respects, to mix and match resources to the most promising markets.

After you do this for a while, it’s obvious there are interdependencies between these markets, in particular trade interdependencies.

Europe provides a large market for Chinese products – a market which has flagged in recent years with prolonged economic troubles in peripheral EU zone areas. The United States also provides China important markets for its goods.

Japan, as one of the largest economies in the world, is in the mix here too.

Bottom line – if all the major global economic regions (except South America?) are flagging, a synchronized global recession is increasingly likely.

What the Problem Is

This is sort of a “plain-vanilla” forecast, and might be fine-tuned with quantitative models – although none of these is especially accurate on a global scale.

But the deeper issue and problem has to do with the US Federal Reserve and many other central banks. And the failure to follow standard fiscal policy measures during the last economic downturn.

A new recession in the United States in 2014 or 2015 would find the US Federal Reserve Bank with no policy tools. The federal funds rate, the overnight rate directly controlled by the Fed, currently is virtually zero. The bond-buying program known as “quantitative easing (QE)” is scheduled to end in October, which means it is still running. The Fed balance sheet already includes more than $4 trillion in liabilities, more than 75 percent of which were incurred fighting the last recession.

That leaves fiscal policy as the only real response to a new recession.

However, the prospects for Congress to step up to the bat in the next two years do not look good.

Barry Ritholtz highlights the problem with Congress in a recent Bloomberg column – Naming the Biggest Losers in America.

The drag from federal government usually is a simple and obvious fix. During a recession and recovery, spending should rise and the Fed should make credit less expensive.

Except in this cycle. Before you start telling me about beliefs and ideology and the deficit, all one needs to do is compare federal spending during the 2001 recession cycle, with a Republican controlling the White House and a split Congress, to the present cycle. Apparently, the importance of reducing deficits and having a smaller government only applies when the GOP doesn’t control the White House.

Look also at state and local government, another huge drag on the economy. Block grants to the states could have helped to pay for police, emergency workers, teachers, road and bridge maintenance as they have in past recessions. But they weren’t, for partisan political reasons. The nation is worse off for it.

Business equipment investment and other forms of capital expenditures have been jump started with an accelerated depreciation tax allowances in past recessions. For some reason, this was allowed to lapse in 2013. This wasn’t very smart; if anything, they should have been extended and made more aggressive.

The biggest drag of all has been the persistent weakness in residential real estate. The recent increases in home prices are the result of record-low mortgage rates and limited inventory, not an economic recovery. As we noted in “The Best Housing Program You’ve Never Heard Of,” there were some attempts to ameliorate this, but they amounted to too little too late.

The bottom line is that as a nation, and mainly because of Congress, we haven’t risen to the challenges we face. There has been little intelligence, no creativity, negligible cooperation, and an epic failure of civic responsibility.

Amen.

Reflections

All this highlights for me that we need to face facts on US Federal Reserve policy, which currently is stuck at the zero lower bound for the federal funds rate and is still buying long term bonds.

The next recession is likely to hit before the Fed “normalizes” interest rates and its QE programs.

Also, the character of the US Congress is unlikely to convert en masse to Keynesian economics in the next two years.

This means, in turn, that unorthodox measures to stimulate the US and global economy will be necessary.

What are they?

Links May 2014

If there is a theme for this current Links page, it’s that trends spotted a while ago are maturing, becoming clearer.

So with the perennial topic of Big Data and predictive analytics, there is an excellent discussion in Algorithms Beat Intuition – the Evidence is Everywhere. There is no question – the machines are going to take over; it’s only a matter of time.

And, as far as freaky, far-out science, how about Scientists Create First Living Organism With ‘Artificial’ DNA.

Then there are China trends. Workers in China are better paid, have higher skills, and they are starting to use the strike. Striking Chinese Workers Are Headache for Nike, IBM, Secret Weapon for Beijing . This is a long way from the poor peasant women from rural areas living in dormitories, doing anything for five or ten dollars a day.

The Chinese dominance in the economic sphere continues, too, as noted by the Economist. Crowning the dragon – China will become the world’s largest economy by the end of the year

China

But there is the issue of the Chinese property bubble. China’s Property Bubble Has Already Popped, Report Says

Chinaproperty

Then, there are issues and trends of high importance surrounding the US Federal Reserve Bank. And I can think of nothing more important and noteworthy, than Alan Blinder’s recent comments.

Former Fed Leader Alan Blinder Sees Market-rattling Infighting at Central Bank

“The Fed may get more raucous about what to do next as tapering draws to a close,” Alan Blinder, a banking industry consultant and economics professor at Princeton University said in a speech to the Investment Management Consultants Association in Boston.

The cacophony is likely to “rattle the markets” beginning in late summer as traders debate how precipitously the Fed will turn from reducing its purchases of U.S. government debt and mortgage securities to actively selling it.

The Open Market Committee will announce its strategy in October or December, he said, but traders will begin focusing earlier on what will happen with rates as some members of the rate-setting panel begin openly contradicting Fed Chair Janet Yellen, he said.

Then, there are some other assorted links with good infographics, charts, or salient discussion.

Alibaba IPO Filing Indicates Yahoo Undervalued Heck of an interesting issue.

Alibaba

Twitter Is Here To Stay

Three Charts on Secular Stagnation Krugman toying with secular stagnation hypothesis.

Rethinking Property in the Digital Era Personal data should be viewed as property

Larry Summers Goes to Sleep After Introducing Piketty at Harvard Great pic. But I have to have sympathy for Summers, having attended my share of sleep-inducing presentations on important economics issues.

lawrencesummers

Turkey’s Institutions Problem from the Stockholm School of Economics, nice infographics, visual aids. Should go along with your note cards on an important emerging economy.

Post-Crash economics clashes with ‘econ tribe’ – economics students in England are proposing reform of the university economics course of study, but, as this link points out, this is an uphill battle and has been suggested before.

The Life of a Bond – everybody needs to know what is in this infographic.

Very Cool Video of Ocean Currents From NASA

perpetualocean_cover_1024x676

US Growth Stalls

The US Bureau of Economic Analysis (BEA) announced today that,

Real gross domestic product — the output of goods and services produced by labor and property located in the United States — increased at an annual rate of 0.1 percent in the first quarter (that is, from the fourth quarter of 2013 to the first quarter of 2014), according to the “advance” estimate released by the Bureau of Economic Analysis.  In the fourth quarter, real GDP increased 2.6 percent.

This flatline growth number is in stark contrast to the median forecast of 83 economists surveyed by Bloomberg, which called for a 1.2 percent increase for the first quarter.

Bloomberg writes in a confusingly titled report – Dow Hits Record as Fed Trims Stimulus as Economy Improves

The pullback in growth came as snow blanketed much of the eastern half of the country, keeping shoppers from stores, preventing builders from breaking ground and raising costs for companies including United Parcel Service Inc. Another report today showing a surge in regional manufacturing this month adds to data on retail sales, production and employment that signal a rebound is under way as temperatures warm.

Here’s is the BEA table of real GDP, along with the advanced estimates for the first quarter 2014 (click to enlarge).

usgdp

The large negative slump in investment in equipment (-5.5) indicates to me something more is going on than bad weather.

Indeed, Econbrowser notes that,

Both business fixed investment and new home construction fell in the quarter, which would be ominous developments if they’re repeated through the rest of this year. And a big drop in exports reminds us that America is not immune to weakness elsewhere in the world.

Even the 2% growth in consumption spending is not all that encouraging. As Bricklin Dwyer of BNP Paribas noted, 1.1% of that consumption growth– more than half– was attributed to higher household expenditures on health care.

What May Be Happening

I think there is some amount of “happy talk” about the US economy linked to the urgency about reducing Fed bond purchases. So just think of what might happen if the federal funds rate is still at the zero bound when another recession hits. What tools would the Fed have left? Somehow the Fed has to position itself rather quickly for the inevitable swing of the business cycle.

I have wondered, therefore, whether some of the pronouncements recently from the Fed did not have a unrealistic slant.

So, as the Fed unwinds quantitative easing (QE), dropping bond (mortgage-backed securities) purchases to zero, surely there will be further impacts on the housing markets.

Also, China is not there this time to take up the slack.

And it is always good to remember that new employment numbers are basically a lagging indicator of the business cycle.

Let’s hope for a better second and third quarter, and that this flatline growth for the first quarter is a blip.

Interest Rates – 2

I’ve been looking at forecasting interest rates, the accuracy of interest rate forecasts, and teasing out predictive information from the yield curve.

This literature can be intensely theoretical and statistically demanding. But it might be quickly summarized by saying that, for horizons of more than a few months, most forecasts (such as from the Wall Street Journal’s Panel of Economists) do not beat a random walk forecast.

At the same time, there are hints that improvements on a random walk forecast might be possible under special circumstances, or for periods of time.

For example, suppose we attempt to forecast the 30 year fixed mortgage rate monthly averages, picking a six month forecast horizon.

The following chart compares a random walk forecast with an autoregressive (AR) model.

30yrfixed2

Let’s dwell for a moment on some of the underlying details of the data and forecast models.

The thick red line is the 30 year fixed mortgage rate for the prediction period which extends from 2007 to the most recent monthly average in 2014 in January 2014. These mortgage rates are downloaded from the St. Louis Fed data site FRED.

This is, incidentally, an out-of-sample period, as the autoregressive model is estimated over data beginning in April 1971 and ending September 2007. The autoregressive model is simple, employing a single explanatory variable, which is the 30 year fixed rate at a lag of six months. It has the following form,

rt = k + βrt-6

where the constant term k and the coefficient β of the lagged rate rt-6 are estimated by ordinary least squares (OLS).

The random walk model forecast, as always, is the most current value projected ahead however many periods there are in the forecast horizon. This works out to using the value of the 30 year fixed mortgage in any month as the best forecast of the rate that will obtain six months in the future.

Finally, the errors for the random walk and autoregressive models are calculated as the forecast minus the actual value.

When an Autoregressive Model Beats a Random Walk Forecast

The random walk errors are smaller in absolute value than the autoregressive model errors over most of this out-of-sample period, but there are times when this is not true, as shown in the graph below.

30yrfixedARbetter

This chart itself suggests that further work could be done on optimizing the autoregressive model, perhaps by adding further corrections from the residuals, which themselves are autocorrelated.

However, just taking this at face value, it’s clear the AR model beats the random walk forecast when the direction of interest rates changes from a downward movement.

Does this mean that going forward, an AR model, probably considerably more sophisticated than developed for this exercise, could beat a random walk forecast over six month forecast horizons?

That’s an interesting and bankable question. It of course depends on the rate at which the Fed “withdraws the punch bowl” but it’s also clear the Fed is no longer in complete control in this situation. The markets themselves will develop a dynamic based on expectations and so forth.

In closing, for reference, I include a longer picture of the 30 year fixed mortgage rates, which as can be seen, resemble the whole spectrum of rates in having a peak in the early 1980’s and showing what amounts to trends before and after that.

30yrfixedFRED

Rhino and Tapers in the Room – Janet Yellen’s Menagerie

Michael Hirsh highlights Janet Yellen as an “old school progressive economist” in a recent piece in the National Journal. Her personal agenda supposedly includes serious concern with increasing employment and regulatory control of Wall Street.

But whether she can indulge these “personal passions” in the face of the extraordinary strategic situation of the current Fed is another question.

There is, for example, the taper – with apologies to my early English teachers who would admonish me there is a “i” rather than “e” at the end of that word.

tapir

After testing the waters mid-year 2013 and then pulling back, when initial reaction seemed over-the-top, the Federal Reserve announced onset of a program to “taper” bond purchases December 2013. So far, there have been two reductions by $10 billion a month, leaving bond purchases running $65 billion a month. This relatively modest pace, however, has been fingered as a prime cause of precipitous currency impacts by problem emerging countries (India, for example).

But taper (or tapir) not-withstanding, the real rhino in the room is the Fed balance sheet with its sort of crystalized excess reserve balances of US banks.

Currently US banks hold about $2.5 trillion in excess reserves. Here’s a Treasury Department table which shows how these excess reserves continue to skyrocket, and the level of reserves required by Fed authorities as security for the level of bank deposits.

FedReserveTableSo excess reserves held in the Fed have surged by $1 trillion over the last year, and required reserves are more than an order of magnitude less than these excess reserves.

The flip side of these excess reserves is expansion in the US monetary base.

StLouisAdjMonBase

The monetary base series above shows total bank reserves and the currency stock, plus adjustments. This is what Milton Friedman often called “high powered money,” since it is available immediately for bank loans.

But there have been few loans, and that is one important point.

Barry Ritholz has been following this dramatic surge in the US money supply and bank excess reserves. See, for example, his post from mid-2013 81.5% of QE Money Is Not Helping the Economy, where he writes,

We’ve repeatedly pointed out that the Federal Reserve has been intentionally discouraged banks from lending to Main Street – in a misguided attempt to curb inflation – which has increased unemployment and stalled out the economy.

Ritholz backs this claim with careful research into and citation of Fed documents and other pertinent materials.

Bottom line – there is strong evidence the new Fed policy of paying interest on bank reserves is a deliberate attempt to create a firewall between the impacts of quantitative easing and inflation. The only problem is that all this new money that has been created misses Main Street, for the most part, but fuels financial speculation here and abroad.

Some Credit Where Credit Is Due

Admittedly, though, the Federal Reserve has done a lot of heavy lifting since the financial crises in 2008.

Created in 1913, the Federal Reserve Bank is a “bank of banks,” whose primary depositors are commercial banks. The Fed is charged with maintaining stable prices and employment, objectives not always in synch with each other.

Under the previous Chairman, Ben Bernacke, the Fed led the way into new policy responses to problems such as potential global financial collapse and high, persisting levels of unemployment.

The core innovation has been purchase of assets apart from conventional US Treasury securities – formerly the policy core of Open Market Operations. With the threat of global financial collapse surrounding the bankruptcies of Bear Stearns and then Lehman Brothers in 2008, the Treasury and the Fed swung into action with programs like the TARP and the bailout of AIG, a giant insurance concern which made a lot of bad bets (mainly credit default swaps) and was “too big to fail.”

Other innovations followed, such as payment of interest by the Fed on reserve deposits of commercial banks, as well as large purchases of mortgage securities, bolstering the housing market and tamping down long term interest rates.

The Fed has done this in a political context generally unfavorable to the type of fiscal stimulus which might be expected, given the severity of the unemployment problems. The new Chair, Janet Yellen, for example, has noted that cutbacks at the state level following on the recession of 2008-2009 might well have been the occasion for more ambitious federal economic stimulus. This, however, was blocked by Congress.

As a result, the Fed has borne a disproportionate share of the burden of rebuilding the balance sheets of US banks, stabilizing housing markets, and pushing forward at least some type of economic recovery.

This is not to lionize the Fed, since many criticisms can be made.

The Rhino

In terms of forecasting, however, the focus must be on the rhino in the room growing bigger all the time. Can it be led peaceably outside to pasture, for a major weight reduction to something like a pony, again?

With apologies for mixed metaphors, the following chart highlights the issue.

FedMBandQEgraph

This shows the total of the “monetary base” dating from the beginning of 2006. The red shaded areas of the graph indicate the time windows in which the various “Quantitative Easing” (QE) policies have been in effect – now three QE’s, QE1, QE2, and QE3.

Another problem concerns the composition of the Fed holdings which balance off against these reserves. The Fed has invested and is investing heavily in mortgage-backed securities, and has other sorts of non-traditional assets in its portfolio. In fact, given the lack-luster growth and employment in the US economy since 2008, the Fed has been one of the primary forces supporting “recovery” and climbing prices in the housing market.

So there are really two problems. First, the taper. Then, the “winding down” of Fed positions in these assets.

Chairperson Yellen has her hands full – and this is not even to mention the potential hair-rending that would unfold, were another recession to start later this year or in 2015 – perhaps due to political wars over the US debt limit, upheavals in emerging markets, or further self-defeating moves by the “leadership” of the EU.