Category Archives: predicting recessions

Forecasting the Downswing in Markets

I got a chance to work with the problem of forecasting during a business downturn at Microsoft 2007-2010.

Usually, a recession is not good for a forecasting team. There is a tendency to shoot the messenger bearing the bad news. Cost cutting often falls on marketing first, which often is where forecasting is housed.

But Microsoft in 2007 was a company which, based on past experience, looked on recessions with a certain aplomb. Company revenues continued to climb during the recession of 2001 and also during the previous recession in the early 1990’s, when company revenues were smaller.

But the plunge in markets in late 2008 was scary. Microsoft’s executive team wanted answers. Since there were few forthcoming from the usual market research vendors – vendors seemed sort of “paralyzed” in bringing out updates – management looked within the organization.

I was part of a team that got this assignment.

We developed a model to forecast global software sales across more than 80 national and regional markets. Forecasts, at one point, were utilized in deliberations of the finance directors, developing budgets for FY2010. Our Model, by several performance comparisons, did as well or better than what was available in the belated efforts of the market research vendors.

This was a formative experience for me, because a lot of what I did, as the primary statistical or econometric modeler, was seat-of-the-pants. But I tried a lot of things.

That’s one reason why this blog explores method and technique – an area of forecasting that, currently, is exploding.

Importance of the Problem

Forecasting the downswing in markets can be vitally important for an organization, or an investor, but the first requirement is to keep your wits. All too often there are across-the-board cuts.

A targeted approach can be better. All market corrections, inflections, and business downturns come to an end. Growth resumes somewhere, and then picks up generally. Companies that cut to the bone are poorly prepared for the future and can pay heavily in terms of loss of market share. Also, re-assembling the talent pool currently serving the organization can be very expensive.

But how do you set reasonable targets, in essence – make intelligent decisions about cutbacks?

I think there are many more answers than are easily available in the management literature at present.

But one thing you need to do is get a handle on the overall swing of markets. How long will the downturn continue, for example?

For someone concerned with stocks, how long and how far will the correction go? Obviously, perspective on this can inform shorting the market, which, my research suggests, is an important source of profits for successful investors.

A New Approach – Deploying high frequency data

Based on recent explorations, I’m optimistic it will be possible to get several weeks lead-time on releases of key US quarterly macroeconomic metrics in the next downturn.

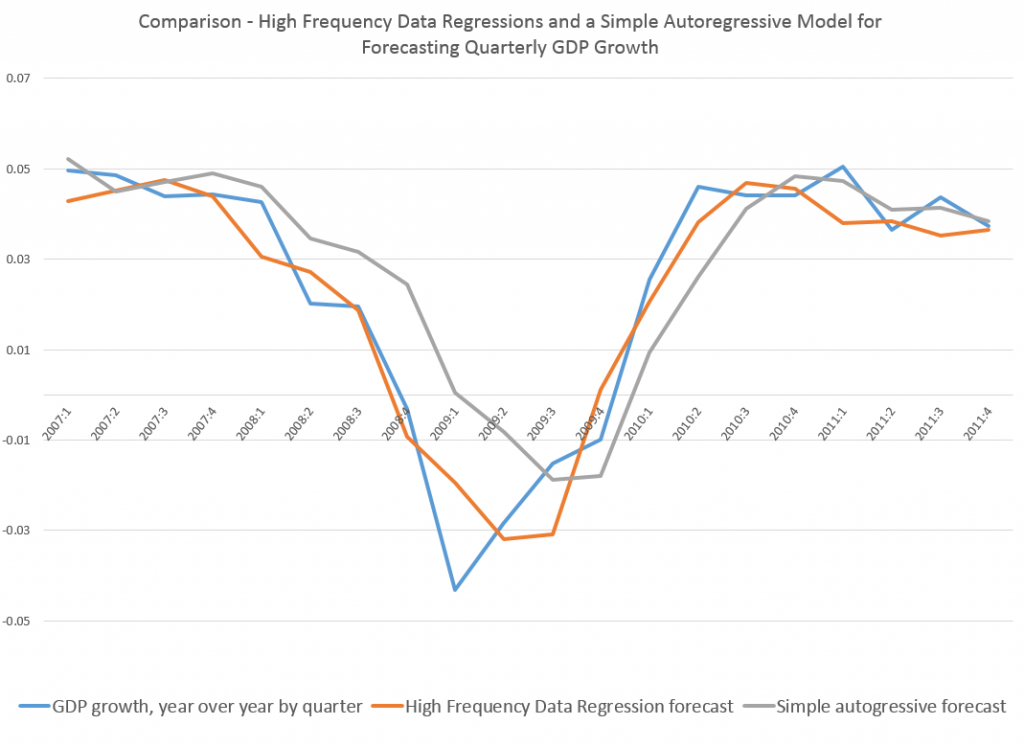
My last post, for example, has this graph.

MIDAScomp

Note how the orange line hugs the blue line during the descent 2008-2009.

This orange line is the out-of-sample forecast of quarterly nominal GDP growth based on the quarter previous GDP and suitable lagged values of the monthly Chicago Fed National Activity Index. The blue line, of course, is actual GDP growth.

The official name for this is Nowcasting and MIDAS or Mixed Data Sampling techniques are widely-discussed approaches to this problem.

But because I was only mapping monthly and not, say, daily values onto quarterly values, I was able to simply specify the last period quarterly value and fifteen lagged values of the CFNAI in a straight-forward regression.

And in reviewing literature on MIDAS and mixing data frequencies, it is clear to me that, often, it is not necessary to calibrate polynomial lag expressions to encapsulate all the higher frequency data, as in the classic MIDAS approach.

Instead, one can deploy all the “many predictors” techniques developed over the past decade or so, starting with the work of Stock and Watson and factor analysis. These methods also can bring “ragged edge” data into play, or data with different release dates, if not different fundamental frequencies.

So, for example, you could specify daily data against quarterly data, involving perhaps several financial variables with deep lags – maybe totaling more explanatory variables than observations on the quarterly or lower frequency target variable – and wrap the whole estimation up in a bundle with ridge regression or the LASSO. You are really only interested in the result, the prediction of the next value for the quarterly metric, rather than unbiased estimates of the coefficients of explanatory variables.

Or you could run a principal component analysis of the data on explanatory variables, including a rag-tag collection of daily, weekly, and monthly metrics, as well as one or more lagged values of the higher frequency variable (quarterly GDP growth in the graph above).

Dynamic principal components also are a possibility, if anyone can figure out the estimation algorithms to move into a predictive mode.

Being able to put together predictor variables of all different frequencies and reporting periods is really exciting. Maybe in some way this is really what Big Data means in predictive analytics. But, of course, progress in this area is wholly empirical, it not being clear what higher frequency series can successfully map onto the big news indices, until the analysis is performed. And I think it is important to stress the importance of out-of-sample testing of the models, perhaps using cross-validation to estimate parameters if there is simply not enough data.

One thing I believe is for sure, however, and that is we will not be in the dark for so long during the next major downturn. It will be possible to  deploy all sorts of higher frequency data to chart the trajectory of the downturn, probably allowing a call on the turning point sooner than if we waited for the “big number” to come out officially.

Top picture courtesy of the Bridgespan Group

The Holy Grail of Business Forecasting – Forecasting the Next Downturn

What if you could predict the Chicago Fed National Activity Index (CFNAI), interpolated monthly values of the growth of nominal GDP, the Aruoba-Diebold-Scotti (ADS) Business Conditions Index, and the Kansas City Financial Stress Index (KCFSI) three, five, seven, even twelve months into the future? What if your model also predicted turning points in these US indexes, and also similar macroeconomic variables for countries in Asia and the European Union? And what if you could do all this with data on monthly returns on the stock prices of companies in the financial sector?

That’s the claim of Linda Allen, Turan Bali, and Yi Tang in a fascinating 2012 paper Does Systemic Risk in the Financial Sector Predict Future Economic Downturns?

I’m going to refer to these authors as Bali et al, since it appears that Turan Bali, shown below, did some of the ground-breaking research on estimating parametric distributions of extreme losses. Bali also is the corresponding author.

T_bali

Bali et al develop a new macroindex of systemic risk that predicts future real economic downturns which they call CATFIN.

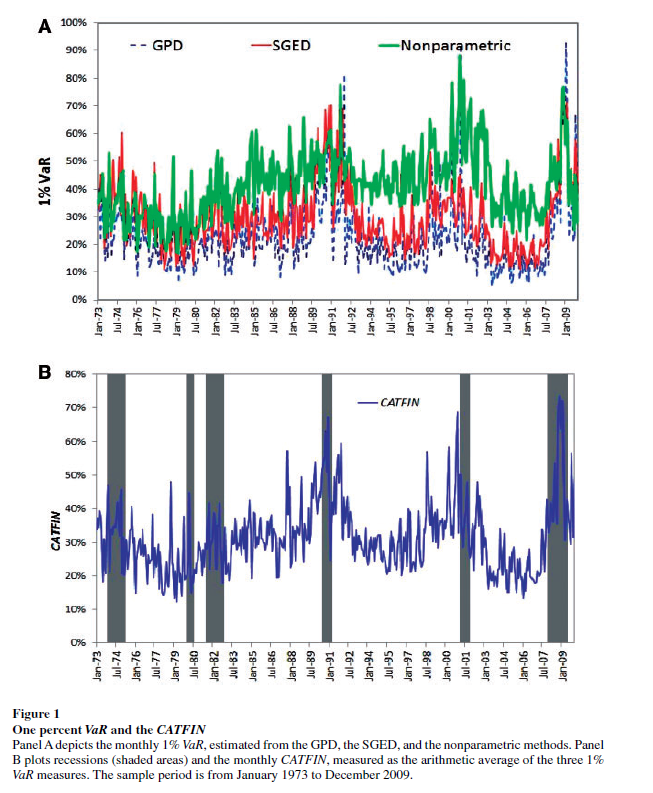
CATFIN is estimated using both value-at-risk (VaR) and expected shortfall (ES) methodologies, each of which are estimated using three approaches: one nonparametric and two different parametric specifications. All data used to construct the CATFIN measure are available at each point in time (monthly, in our analysis), and we utilize an out-of-sample forecasting methodology. We find that all versions of CATFIN are predictive of future real economic downturns as measured by gross domestic product (GDP), industrial production, the unemployment rate, and an index of eighty-five existing monthly economic indicators (the Chicago Fed National Activity Index, CFNAI), as well as other measures of real macroeconomic activity (e.g., NBER recession periods and the Aruoba-Diebold-Scott [ADS] business conditions index maintained by the Philadelphia Fed). Consistent with an extensive body of literature linking the real and financial sectors of the economy, we find that CATFIN forecasts aggregate bank lending activity.

The following graphic illustrates three components of CATFIN and the simple arithmetic average, compared with US recession periods.

CATFIN

Thoughts on the Method

OK, here’s the simple explanation. First, these researchers identify US financial companies based on definitions in Kenneth French’s site at the Tuck School of Business (Dartmouth). There are apparently 500-1000 of these companies for the period 1973-2009. Then, for each month in this period, rates of return of the stock prices of these companies are calculated. Then, three methods are used to estimate 1% value at risk (VaR) – two parametric methods and one nonparametric methods. The nonparametric method is straight-forward –

The nonparametric approach to estimating VaR is based on analysis of the left tail of the empirical return distribution conducted without imposing any restrictions on the moments of the underlying density…. Assuming that we have 900 financial firms in month t , the nonparametric measure of1%VaR is the ninth lowest observation in the cross-section of excess returns. For each month, we determine the one percentile of the cross-section of excess returns on financial firms and obtain an aggregate 1% VaR measure of the financial system for the period 1973–2009.

So far, so good. This gives us the data for the graphic shown above.

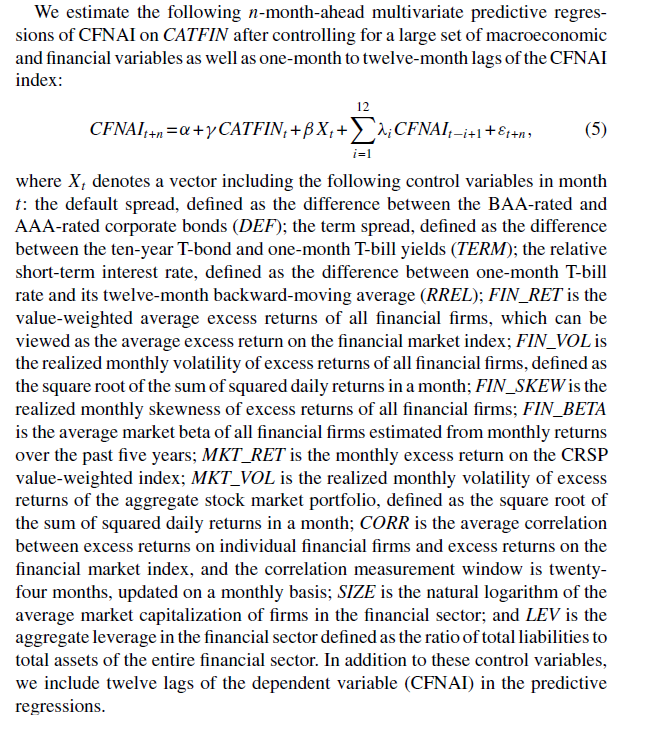
In order to make this predictive, the authors write that –

CATFINEQ

Like a lot of leading indicators, the CATFIN predictive setup “over-predicts” to some extent. Thus, there are there are five instances in which a spike in CATFIN is not followed by a recession, thereby providing a false positive signal of future real economic distress. However, the authors note that in many of these cases, predicted macroeconomic declines may have been averted by prompt policy intervention. Their discussion of this is very interesting, and plausible.

What This Means

The implications of this research are fairly profound – indicating, above all, the priority of the finance sector in leading the overall economy today. Certainly, this consistent with the balance sheet recession of 2008-2009, and probably will continue to be relevant going forward – since nothing really has changed and more concentration of ownership in finance has followed 2008-2009.

I do think that Serena Ng’s basic point in a recent review article probably is relevant – that not all recessions are the same. So it may be that this method would not work as well for, say, the period 1945-1970, before financialization of the US and global economies.

The incredibly ornate mathematics of modeling the tails of return distributions are relevant in this context, incidentally, since the nonparametric approach of looking at the empirical distributions month-by-month could be suspect because of “cherry-picking.” So some companies could be included, others excluded to make the numbers come out. This is much difficult in a complex maximum likelihood estimation process for the location parameters of these obscure distributions.

So the question on everybody’s mind is – WHAT DOES THE CATFIN MODEL INDICATE NOW ABOUT THE NEXT FEW MONTHS? Unfortunately, I am unable to answer that, although I have corresponded with some of the authors to inquire whether any research along such lines can be cited.

Bottom line – very impressive research and another example of how important science can get lost in the dance of prestige and names.

Recession and Economic Projections

I’ve been studying the April 2014 World Economic Outlook (WEO) of the International Monetary Fund (IMF) with an eye to its longer term projections of GDP.

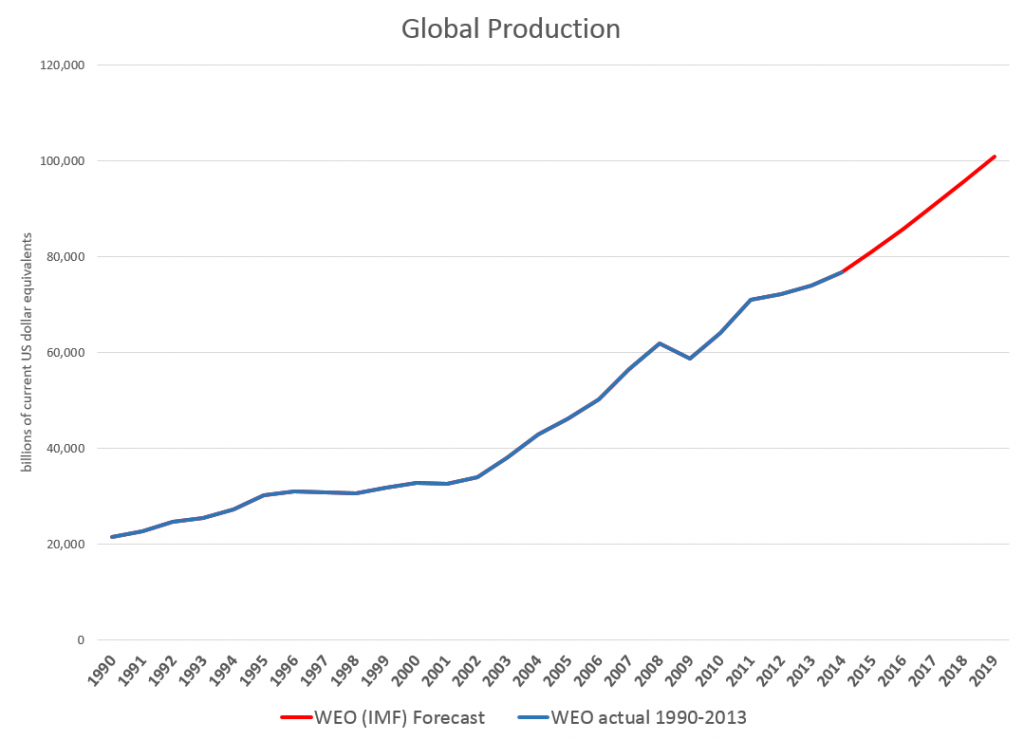
Downloading the WEO database and summing the historic and projected GDP’s suggests this chart.

GlobalGDP

The WEO forecasts go to 2019, almost to our first benchmark date of 2020. Global production is projected to increase from around $76.7 trillion in current US dollar equivalents to just above $100 trillion. An update in July marked the estimated 2014 GDP growth down from 3.7 to 3.4 percent, leaving the 2015 growth estimate at a robust 4 percent.

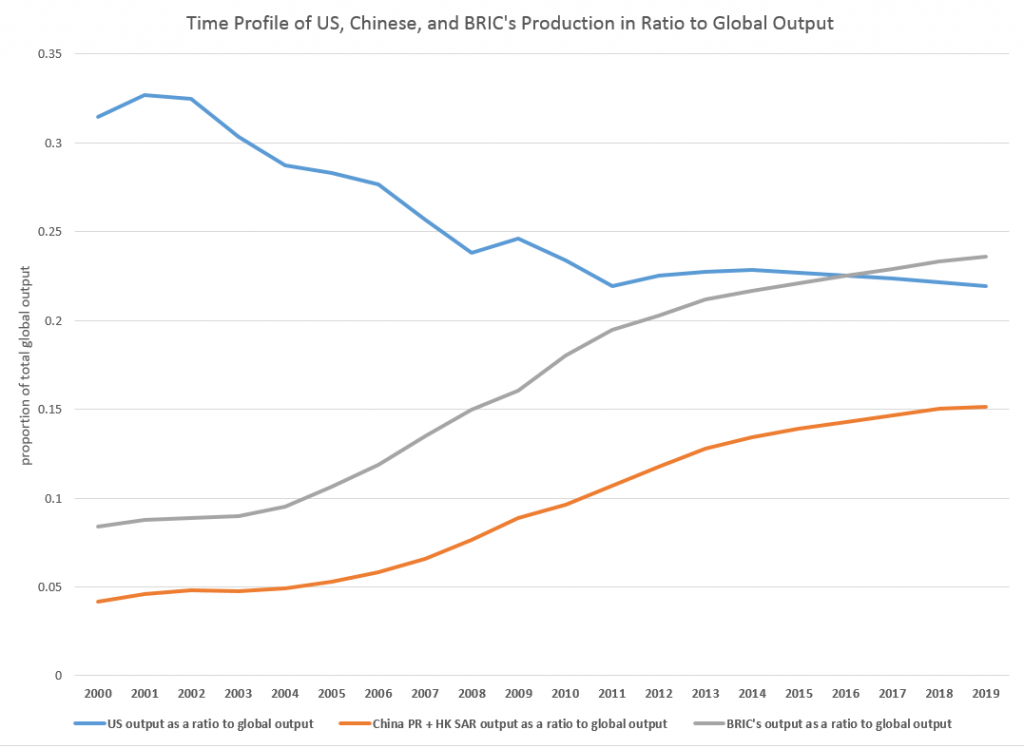
The WEO database is interesting, because it’s country detail allows development of charts, such as this.

gbobalproout

So, based on this country detail on GDP and projections thereof, the BRIC’s (Brazil, Russia, India, and China) will surpass US output, measured in current dollar equivalents, in a couple of years.

In purchasing power parity (PPP) terms, China is currently or will soon pass the US GDP, incidentally. Thus, according to the Big Mac index, a hamburger is 41 percent undervalued in China, compared to the US. So boosting Chinese production 41 percent puts its value greater than US output. However, the global totals would change if you take this approach, and it’s not clear the Chinese proportion would outrank the US yet.

The Impacts of Recession

The method of caging together GDP forecasts to the year 2030, the second benchmark we want to consider in this series of posts, might be based on some type of average GDP growth rate.

However, there is a fundamental issue with this, one I think which may play significantly into the actual numbers we will see in coming years.

Notice, for example, the major “wobble” in the global GDP curve historically around 2008-2009. The Great Recession, in fact, was globally synchronized, although it only caused a slight inflection in Chinese and BRIC growth. Europe and Japan, however, took a major hit, bringing global totals down for those years.

Looking at 2015-2020 and, certainly, 2015-2030, it would be nothing short of miraculous if there were not another globally synchronized recession. Currently, for example, as noted in an earlier post here, the Eurozone, including Germany, moved into zero to negative growth last quarter, and there has been a huge drop in Japanese production. Also, Chinese economic growth is ratcheting down from it atmospheric levels of recent years, facing a massive real estate bubble and debt overhang.

But how to include a potential future recession in economic projections?

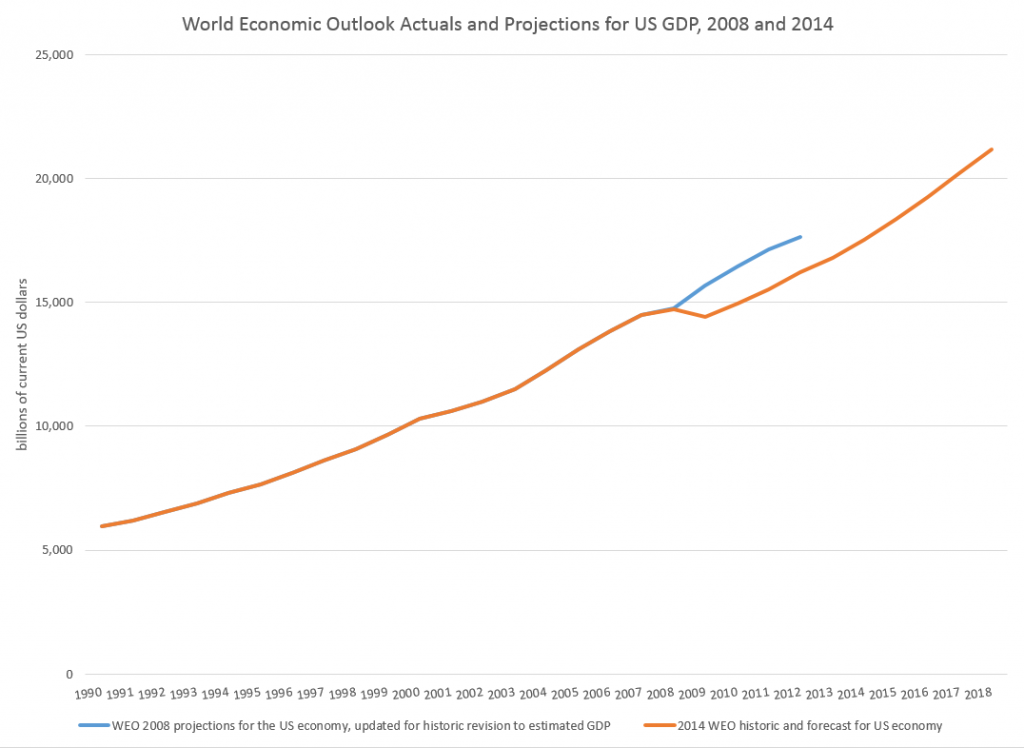
One guide might be to look at how past projections have related to these types of events. Here, for example, is a comparison of the 2008 and 2014 US GDP projections in the WEO’s.

WEOUS

So, according to the IMF, the Great Recession resulted in a continuing loss of US production through until the present.

This corresponds with the concept that, indeed, the GDP time series is, to a large extent, a random walk with drift, as Nelson and Plosser suggested decades ago (triggering a huge controversy over unit roots).

And this chart highlights a meaning for potential GDP. Thus, the capability to produce things did not somehow mysteriously vanish in 2008-2009. Rather, there was no point in throwing up new housing developments in a market that was already massively saturated, Not only that, but the financial sector was unable to perform its usual duties because it was insolvent – holding billions of dollars of apparently worthless collateralized mortgage securities and other financial innovations.

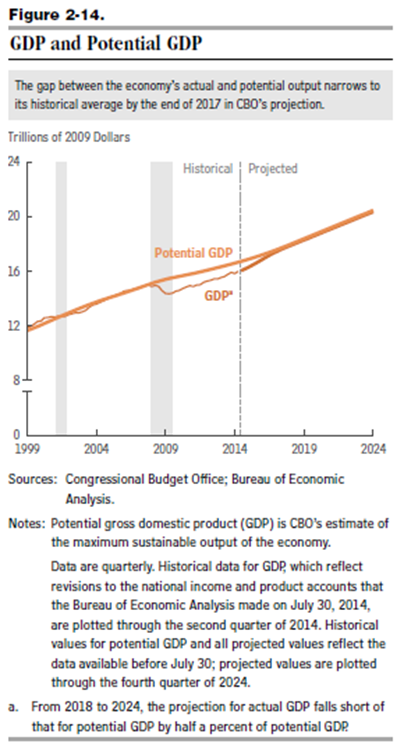
There is a view, however, that over a long period of time some type of mean reversion crops up.

This is exemplified in the 2014 Congressional Budget Office (CBO) projections, as shown in this chart from the underlying detail.

CBOpotentialGDP

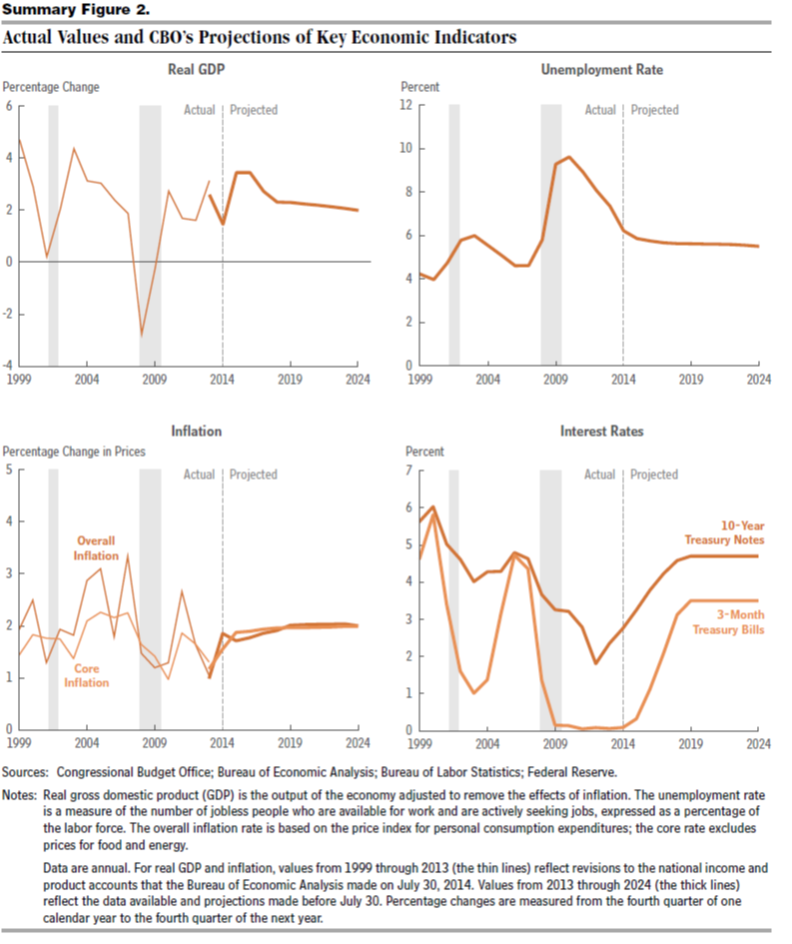
This convergence on potential GDP, which somehow is shown in the diagram with a weaker growth rate just after 2008, is based on the following forecasts of underlying drivers, incidentally.

CBOdrivers

So again, despite the choppy historical detail for US real GDP growth in the chart on the upper left, the forecast adopted by the CBO blithely assumes no recession through 2024 as well as increase in US interest rates back to historic levels by 2019.

I think this clearly suggests the Congressional Budget Office is somewhere in la-la land.

But the underlying question still remains.

How would one incorporate the impacts of an event – a recession – which is probably almost a certainty by the end of these forecast horizons, but whose timing is uncertain?

Of course, there are always scenarios, and I think, particularly for budget discussions, it would be good to display one or two of these.

I’m interested in reader suggestions on this.

Calling the Next Recession – The Need for New Policy Responses

Yesterday I saw a headline on Reuters,

U.S. retail sales pause, seen rebounding in months ahead

with a story that made the best out of a recent stall in US consumer spending, especially for cars.

I also noticed –

Japan’s Economy Contracts Sharply

Real gross domestic product, the total value of all goods and services produced in the economy, shrank 6.8% in the three months through June on an annualized basis from the prior quarter

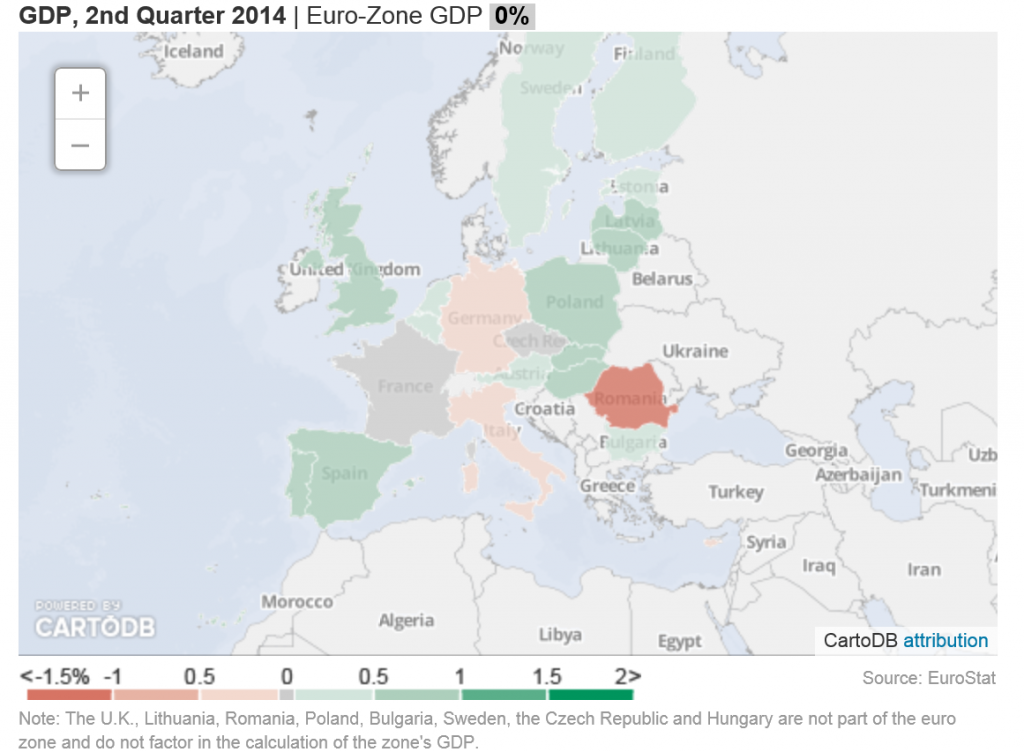
In Europe, the economic tea leaves suggest a developing recession in Italy, negative growth in Germany, and stasis in France, as highlighted in this Wall Street Journal graphic.

EUprospects

Mish Shedlock, furthermore, is all over the bizarre new data coming out of China on bank loans in the standard and shadow banking systems.

New Yuan Loans and Shadow Banking Collapse in China; Record Bank Deposit Slump

All this after the 1st Quarter surprise drop in US real GDP of -2.7 percent, quarter-over-quarter.

A Note on How I Forecast the Global Economy

So my experience is with enterprise level IT companies with markets in the major global economic regions – Europe, Japan, China, the US and the ROW (rest of the world).

The idea is to keep tabs on regional developments to predict sales and, in some respects, to mix and match resources to the most promising markets.

After you do this for a while, it’s obvious there are interdependencies between these markets, in particular trade interdependencies.

Europe provides a large market for Chinese products – a market which has flagged in recent years with prolonged economic troubles in peripheral EU zone areas. The United States also provides China important markets for its goods.

Japan, as one of the largest economies in the world, is in the mix here too.

Bottom line – if all the major global economic regions (except South America?) are flagging, a synchronized global recession is increasingly likely.

What the Problem Is

This is sort of a “plain-vanilla” forecast, and might be fine-tuned with quantitative models – although none of these is especially accurate on a global scale.

But the deeper issue and problem has to do with the US Federal Reserve and many other central banks. And the failure to follow standard fiscal policy measures during the last economic downturn.

A new recession in the United States in 2014 or 2015 would find the US Federal Reserve Bank with no policy tools. The federal funds rate, the overnight rate directly controlled by the Fed, currently is virtually zero. The bond-buying program known as “quantitative easing (QE)” is scheduled to end in October, which means it is still running. The Fed balance sheet already includes more than $4 trillion in liabilities, more than 75 percent of which were incurred fighting the last recession.

That leaves fiscal policy as the only real response to a new recession.

However, the prospects for Congress to step up to the bat in the next two years do not look good.

Barry Ritholtz highlights the problem with Congress in a recent Bloomberg column – Naming the Biggest Losers in America.

The drag from federal government usually is a simple and obvious fix. During a recession and recovery, spending should rise and the Fed should make credit less expensive.

Except in this cycle. Before you start telling me about beliefs and ideology and the deficit, all one needs to do is compare federal spending during the 2001 recession cycle, with a Republican controlling the White House and a split Congress, to the present cycle. Apparently, the importance of reducing deficits and having a smaller government only applies when the GOP doesn’t control the White House.

Look also at state and local government, another huge drag on the economy. Block grants to the states could have helped to pay for police, emergency workers, teachers, road and bridge maintenance as they have in past recessions. But they weren’t, for partisan political reasons. The nation is worse off for it.

Business equipment investment and other forms of capital expenditures have been jump started with an accelerated depreciation tax allowances in past recessions. For some reason, this was allowed to lapse in 2013. This wasn’t very smart; if anything, they should have been extended and made more aggressive.

The biggest drag of all has been the persistent weakness in residential real estate. The recent increases in home prices are the result of record-low mortgage rates and limited inventory, not an economic recovery. As we noted in “The Best Housing Program You’ve Never Heard Of,” there were some attempts to ameliorate this, but they amounted to too little too late.

The bottom line is that as a nation, and mainly because of Congress, we haven’t risen to the challenges we face. There has been little intelligence, no creativity, negligible cooperation, and an epic failure of civic responsibility.

Amen.

Reflections

All this highlights for me that we need to face facts on US Federal Reserve policy, which currently is stuck at the zero lower bound for the federal funds rate and is still buying long term bonds.

The next recession is likely to hit before the Fed “normalizes” interest rates and its QE programs.

Also, the character of the US Congress is unlikely to convert en masse to Keynesian economics in the next two years.

This means, in turn, that unorthodox measures to stimulate the US and global economy will be necessary.

What are they?

Surprising Revision of First Quarter GDP

I showed a relative this blog a couple of days ago, and, wanting “something spicy,” I pulled up The Record of Failure to Predict Recessions is Virtually Unblemished. The lead picture, as for this post, is Peter Sellers in his role as “Chauncey Gardiner” in Being There. Sellers played a simpleton mistaken for a savant, who would say things that everyone thought was brilliant, such as “There will be growth in the Spring.”

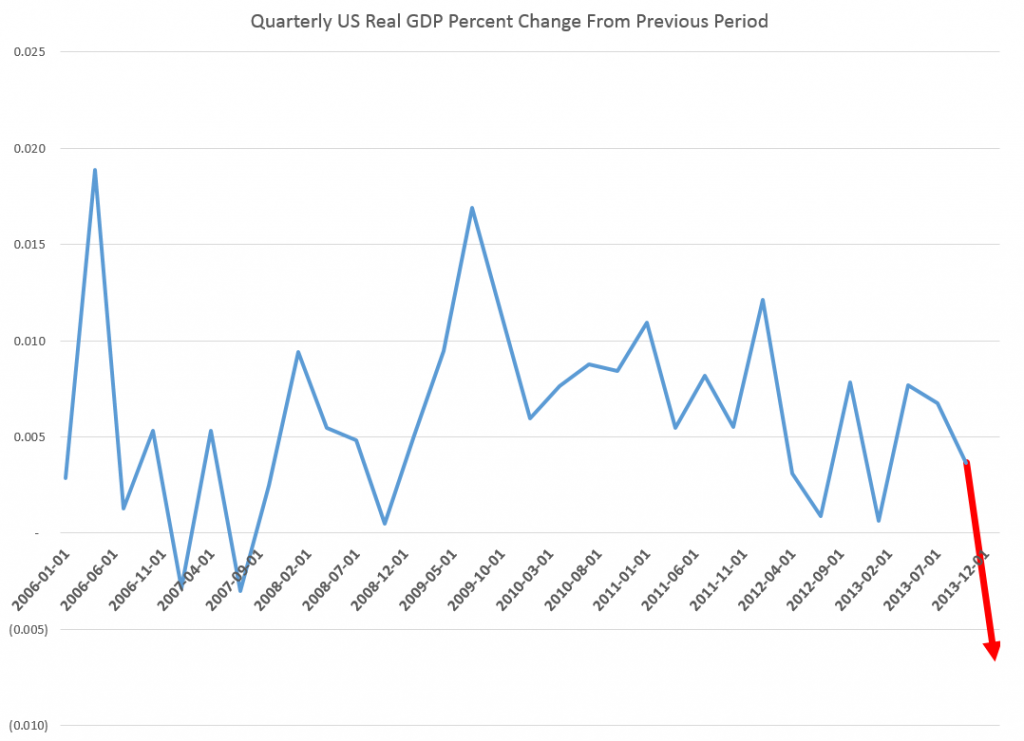
Well, last Wednesday, the US Bureau of Economic Analysis released a third revision of its estimate of the 1st quarter 2014 real GDP growthdown from an initial estimate of a positive .1 percent to -2.9 percent growth at an annual rate.

The BEA News Release says,

Real gross domestic product — the output of goods and services produced by labor and property located in the United States — decreased at an annual rate of 2.9 percent in the first quarter of 2014 according to the “third” estimate released by the Bureau of Economic Analysis….

The decrease in real GDP in the first quarter primarily reflected negative contributions from private inventory investment, exports, state and local government spending, nonresidential fixed investment, and residential fixed investment that were partly offset by a positive contribution from PCE. Imports, which are a subtraction in the calculation of GDP, increased.

Looking at this graph of quarterly real GDP growth rates for the past several years, it’s clear that a -2.9 percent quarter-over-quarter change is a significant size.

usgdpchartcustom

Again, macroeconomic forecasters were caught off guard.

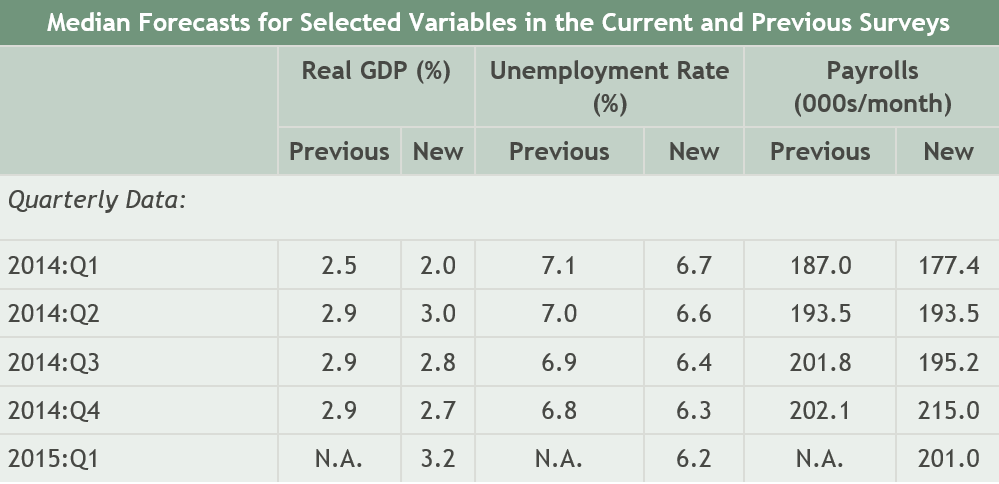
In February of this year, the Survey of Professional Forecasters released its 1st Quarter 2014 consensus forecasts with numbers like –

SPF

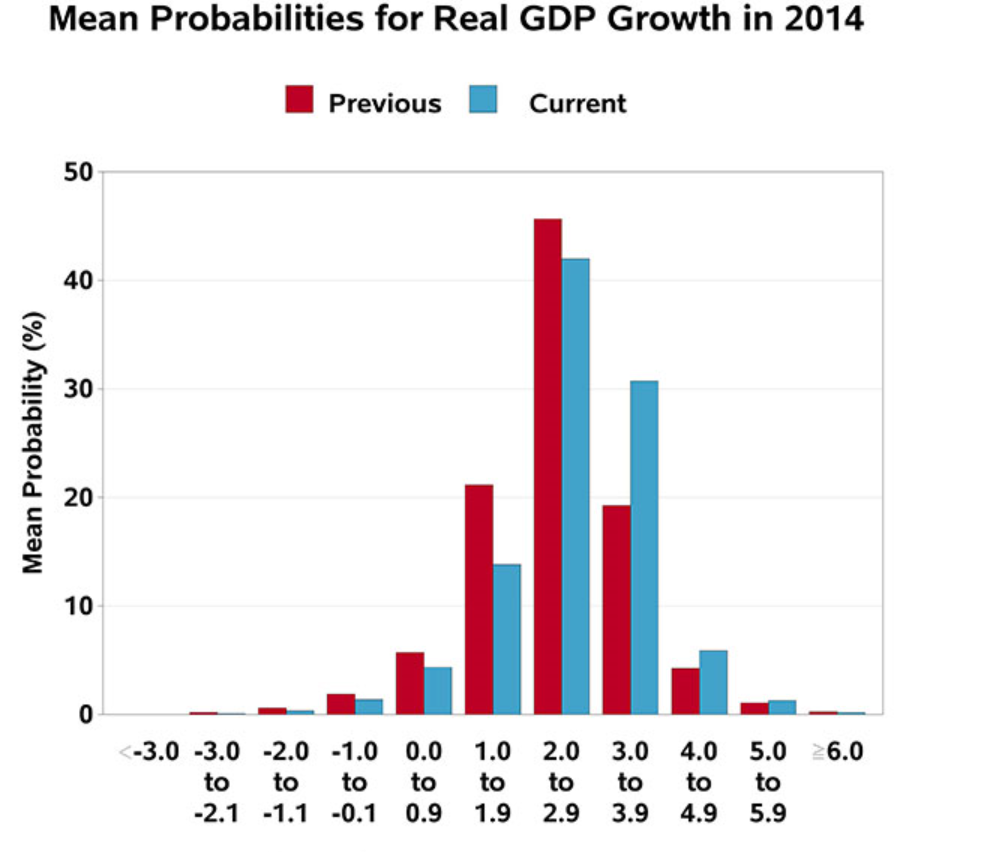
Some SPF participants do predict 2014 overall will be a year of recession, as the following chart shows, but they are a tiny minority.

spfrange

A downward revision of almost 3 percentage points on the part of the BEA and almost 5 percent change for the median SPF forecast is poor performance indeed.

One hears things sped up in Q2, but on what basis I do not really know – and I am thinking of tracking key markets in future posts, such as housing, consumer spending, and so forth.

My feeling is that the quandary of the Fed – its desperate need to wind down asset purchases and restore interest rates to historic levels –creates an environment for a kind of “happy talk.”

Here’s some history on the real GDP.

USGDPnew


“The Record of Failure to Predict Recessions is Virtually Unblemished”

That’s Prakash Loungani from work published in 2001.

Recently, Loungani , working with Hites Ahir, put together an update – “Fail Again, Fail Better, Forecasts by Economists During the Great Recession” reprised in a short piece in VOX – “There will be growth in the spring”: How well do economists predict turning points?

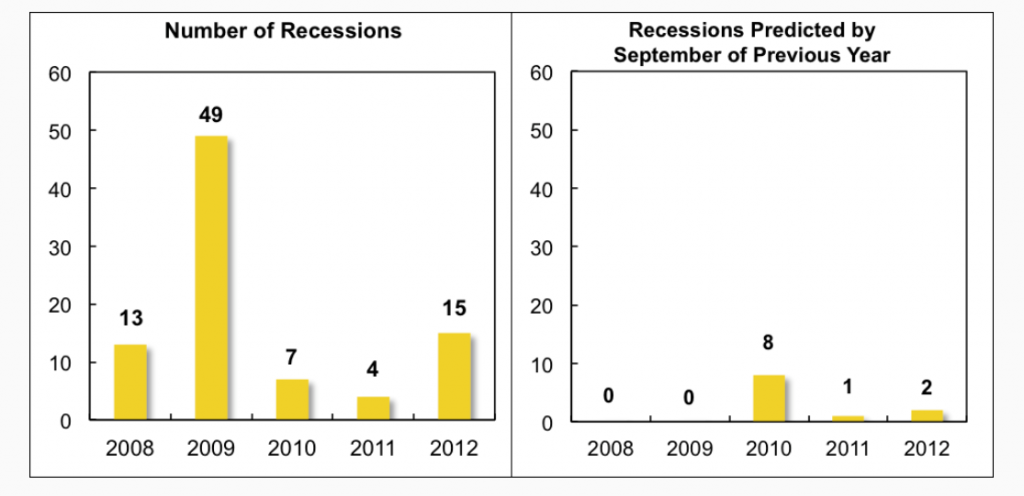
Hites and Loungani looked at the record of professional forecasters 2008-2012. Defining recessions as a year-over-year fall in real GDP, there were 88 recessions in this period. Based on country-by-country predictions documented by Consensus Forecasts, economic forecasters were right less than 10 percent of the time, when it came to forecasting recessions – even a few months before their onset.

recessions

The chart on the left shows the timing of the 88 recession years, while the chart on the right shows the number of recession predicted by economists by the September of the previous year.

..none of the 62 recessions in 2008–09 was predicted as the previous year was drawing to a close. However, once the full realisation of the magnitude and breadth of the Great Recession became known, forecasters did predict by September 2009 that eight countries would be in recession in 2010, which turned out to be the right call in three of these cases. But the recessions in 2011–12 again came largely as a surprise to forecasters.

This type of result holds up to robustness checks

•First, lowering the bar on how far in advance the recession is predicted does not appreciably improve the ability to forecast turning points.

•Second, using a more precise definition of recessions based on quarterly data does not change the results.

•Third, the failure to predict turning points is not particular to the Great Recession but holds for earlier periods as well.

Forecasting Turning Points

How can macroeconomic and business forecasters consistently get it so wrong?

Well, the data is pretty bad, although there is more and more of it available and with greater time depths and higher frequencies. Typically, government agencies doing the national income accounts – the Bureau of Economic Analysis (BEA) in the United States – release macroeconomic information at one or two months lag (or more). And these releases usually involve revision, so there may be preliminary and then revised numbers.

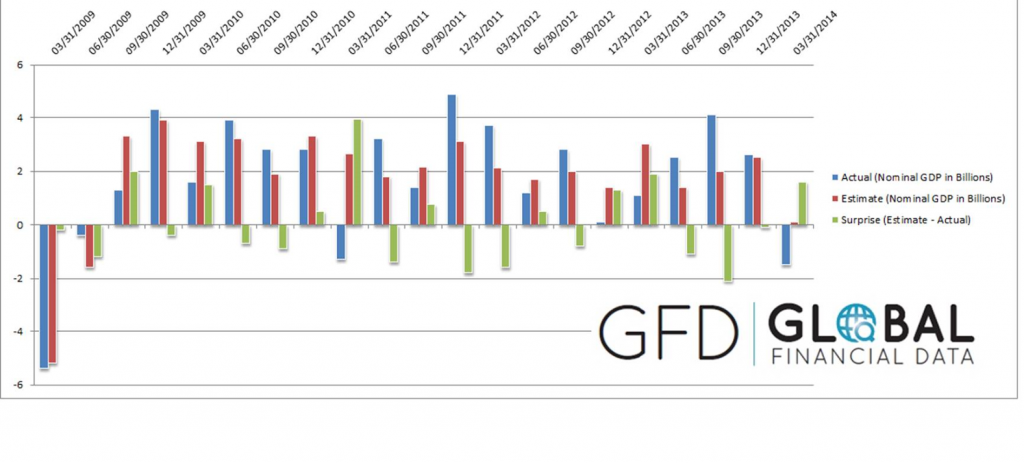
And the general accuracy of GDP forecasts is pretty low, as Ralph Dillon of Global Financial Data (GFD) documents in the following chart, writing,

Below is a chart that has 5 years of quarterly GDP consensus estimates and actual GDP [for the US]. In addition, I have also shown in real dollars the surprise in both directions. The estimate vs actual with the surprise indicating just how wrong consensus was in that quarter.

RalphDillon

Somehow, though, it is hard not to believe economists are doing something wrong with their almost total lack of success in predicting recessions. Perhaps there is a herding phenomenon, coupled with a distaste for being a bearer of bad tidings.

Or maybe economic theory itself plays a role. Indeed, earlier research published on Vox suggests that application of about 50 macroeconomic models to data preceding the recession of 2008-2009, leads to poor results in forecasting the downturn in those years, again even well into that period.

All this suggests economics is more or less at the point medicine was in the 1700’s, when bloodletting was all the rage..

quack_bleeding_sm

In any case, this is the planned topic for several forthcoming posts, hopefully this coming week – forecasting turning points.

Note: The picture at the top of this post is Peter Sellers in his last role as Chauncey Gardiner – the simple-minded gardener who by an accident and stroke of luck was taken as a savant, and who said to the President – “There will be growth in the spring.”