Category Archives: three pass regression filter (3PRF)

Primer on Method – Some Perspectives from 2014

As Hal Varian writes in his popular Big Data: New Tricks for Econometrics the wealth of data now available to researchers demands new techniques of analysis.

In particular, often there is the problem of “many predictors.” In classic regression, the number of observations is assumed to exceed the number of explanatory variables. This obviously is challenged in the Big Data context.

Variable selection procedures are one tactic in this situation.

Readers may want to consult the post Selecting Predictors. It has my list of methods, as follows:

  1. Forward Selection. Begin with no candidate variables in the model. Select the variable that boosts some goodness-of-fit or predictive metric the most. Traditionally, this has been R-Squared for an in-sample fit. At each step, select the candidate variable that increases the metric the most. Stop adding variables when none of the remaining variables are significant. Note that once a variable enters the model, it cannot be deleted.
  2. Backward Selection. This starts with the superset of potential predictors and eliminates variables which have the lowest score by some metric – traditionally, the t-statistic.
  3. Stepwise regression. This combines backward and forward selection of regressors.
  4. Regularization and Selection by means of the LASSO. Here is the classic article and here is a post in this blog on the LASSO.
  5. Information criteria applied to all possible regressions – pick the best specification by applying the Aikaike Information Criterion (AIC) or Bayesian Information Criterion (BIC) to all possible combinations of regressors. Clearly, this is only possible with a limited number of potential predictors.
  6. Cross-validation or other out-of-sample criteria applied to all possible regressions– Typically, the error metrics on the out-of-sample data cuts are averaged, and the lowest average error model is selected out of all possible combinations of predictors.
  7. Dimension reduction or data shrinkage with principal components. This is a many predictors formulation, whereby it is possible to reduce a large number of predictors to a few principal components which explain most of the variation in the data matrix.
  8. Dimension reduction or data shrinkage with partial least squares. This is similar to the PC approach, but employs a reduction to information from both the set of potential predictors and the dependent or target variable.

Some more supporting posts are found here, usually with spreadsheet-based “toy” examples:

Three Pass Regression Filter, Partial Least Squares and Principal Components, Complete Subset Regressions, Variable Selection Procedures – the Lasso, Kernel Ridge Regression – A Toy Example, Dimension Reduction With Principal Components, bootstrapping, exponential smoothing, Estimation and Variable Selection with Ridge Regression and the LASSO

Plus one of the nicest infographics on machine learning – a related subject – is developed by the Australian blog Machine Learning Mastery.

MachineLearning

Looking Ahead, Looking Back

Looking ahead, I’m almost sure I want to explore forecasting in the medical field this coming week. Menzie Chin at Econbrowser, for example, highlights forecasts that suggest states opting out of expanded Medicare are flirting with higher death rates. This sets off a flurry of comments, highlighting the importance and controversy attached to various forecasts in the field of medical practice.

There’s a lot more – from bizarre and sad mortality trends among Russian men since the collapse of the Soviet Union, now stabilizing to an extent, to systems which forecast epidemics, to, again, cost and utilization forecasts.

Today, however, I want to wind up this phase of posts on forecasting the stock and related financial asset markets.

Market Expectations in the Cross Section of Present Values

That’s the title of Bryan Kelly and Seth Pruitt’s article in the Journal of Finance, downloadable from the Social Science Research Network (SSRN).

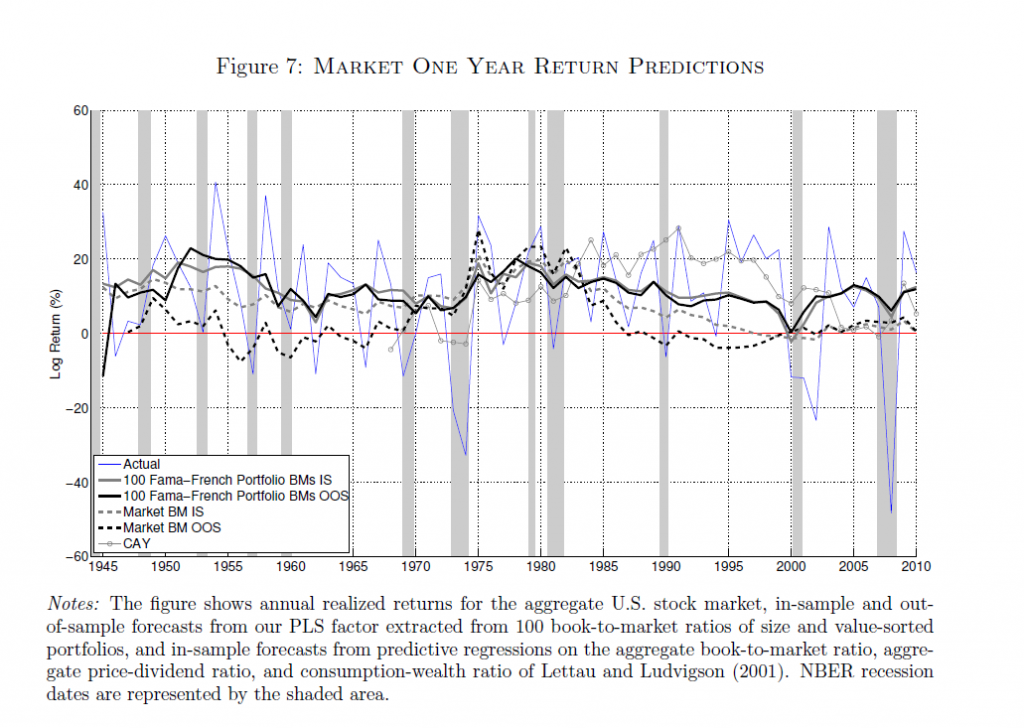
The following chart from this paper shows in-sample (IS) and out-of-sample (OOS) performance of Kelly and Pruitt’s new partial least squares (PLS) predictor, and IS and OOS forecasts from another model based on the aggregate book-to-market ratio. (Click to enlarge)

KellyPruitt1

The Kelly-Pruitt PLS predictor is much better in both in-sample and out-of-sample than the more traditional regression model based on aggregate book-t0-market ratios.

What Kelly and Pruitt do is use what I would call cross-sectional time series data to estimate aggregate market returns.

Basically, they construct a single factor which they use to predict aggregate market returns from cross-sections of portfolio-level book-to-market ratios.

So,

To harness disaggregated information we represent the cross section of asset-specific book-to-market ratios as a dynamic latent factor model. We relate these disaggregated value ratios to aggregate expected market returns and cash flow growth. Our model highlights the idea that the same dynamic state variables driving aggregate expectations also govern the dynamics of the entire panel of asset-specific valuation ratios. This representation allows us to exploit rich cross-sectional information to extract precise estimates of market expectations.

This cross-sectional data presents a “many predictors” type of estimation problem, and the authors write that,

Our solution is to use partial least squares (PLS, Wold (1975)), which is a simple regression-based procedure designed to parsimoniously forecast a single time series using a large panel of predictors. We use it to construct a univariate forecaster for market returns (or dividend growth) that is a linear combination of assets’ valuation ratios. The weight of each asset in this linear combination is based on the covariance of its value ratio with the forecast target.

I think it is important to add that the authors extensively explore PLS as a procedure which can be considered to be built from a series of cross-cutting regressions, as it were (See their white paper on three-pass regression filter).

But, it must be added, this PLS procedure can be summarized in a single matrix formula, which is

KPmatrixformula

Readers wanting definitions of these matrices should consult the Journal of Finance article and/or the white paper mentioned above.

The Kelly-Pruitt analysis works where other methods essentially fail – in OOS prediction,

Using data from 1930-2010, PLS forecasts based on the cross section of portfolio-level book-to-market ratios achieve an out-of-sample predictive R2 as high as 13.1% for annual market returns and 0.9% for monthly returns (in-sample R2 of 18.1% and 2.4%, respectively). Since we construct a single factor from the cross section, our results can be directly compared with univariate forecasts from the many alternative predictors that have been considered in the literature. In contrast to our results, previously studied predictors typically perform well in-sample but become insignifcant out-of-sample, often performing worse than forecasts based on the historical mean return …

So, the bottom line is that aggregate stock market returns are predictable from a common-sense perspective, without recourse to abstruse error measures. And I believe Amit Goyal, whose earlier article with Welch contests market predictability, now agrees (personal communication) that this application of a PLS estimator breaks new ground out-of-sample – even though its complexity asks quite a bit from the data.

Note, though, how volatile aggregate realized returns for the US stock market are, and how forecast errors of the Kelly-Pruitt analysis become huge during the 2008-2009 recession and some previous recessions – indicated by the shaded lines in the above figure.

Still something is better than nothing, and I look for improvements to this approach – which already has been applied to international stocks by Kelly and Pruitt and other slices portfolio data.

More on the Predictability of Stock and Bond Markets

Research by Lin, Wu, and Zhou in Predictability of Corporate Bond Returns: A Comprehensive Study suggests a radical change in perspective, based on new forecasting methods. The research seems to me to of a piece with a lot of developments in Big Data and the data mining movement generally. Gains in predictability are associated with more extensive databases and new techniques.

The abstract to their white paper, presented at various conferences and colloquia, is straight-forward –

Using a comprehensive data set, we find that corporate bond returns not only remain predictable by traditional predictors (dividend yields, default, term spreads and issuer quality) but also strongly predictable by a new predictor formed by an array of 26 macroeconomic, stock and bond predictors. Results strongly suggest that macroeconomic and stock market variables contain important information for expected corporate bond returns. The predictability of returns is of both statistical and economic significance, and is robust to different ratings and maturities.

Now, in a way, the basic message of the predictability of corporate bond returns is not news, since Fama and French made this claim back in 1989 – namely that default and term spreads can predict corporate bond returns both in and out of sample.

What is new is the data employed in the Lin, Wu, and Zhou (LWZ) research. According to the authors, it involves 780,985 monthly observations spanning from January 1973 to June 2012 from combined data sources, including Lehman Brothers Fixed Income (LBFI), Datastream, National Association of Insurance Commissioners (NAIC), Trade Reporting and Compliance Engine (TRACE) and Mergents Fixed Investment Securities Database (FISD).

There also is a new predictor which LWZ characterize as a type of partial least squares (PLS) formulation, but which is none other than the three pass regression filter discussed in a post here in March.

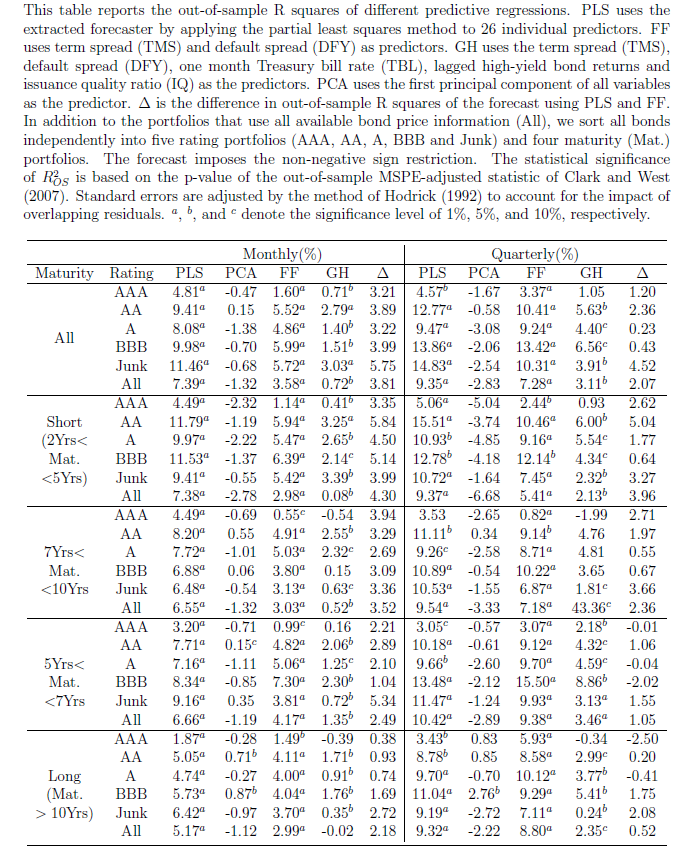
The power of this PLS formulation is evident in a table showing out-of-sample R2 of the various modeling setups. As in the research discussed in a recent post, out-of-sample (OS) R2 is a ratio which measures the improvement in mean square prediction errors (MSPE) for the predictive regression model over the historical average forecast. A negative OS R2 thus means that the MSPE of the benchmark forecast is less than the MSPE of the forecast by the designated predictor formulation.

PLSTableZhou

Again, this research finds predictability varies with economic conditions – and is higher during economic downturns.

There are cross-cutting and linked studies here, often with Goyal’s data and fourteen financial/macroeconomic variables figuring within the estimations. There also is significant linkage with researchers at regional Federal Reserve Banks.

My purpose in this and probably the next one or two posts is to just get this information out, so we can see the larger outlines of what is being done and suggested.

My guess is that the sum total of this research is going to essentially re-write financial economics and has huge implications for forecasting operations within large companies and especially financial institutions.

Three Pass Regression Filter – New Data Reduction Method

Malcolm Gladwell’s 10,000 hour rule (for cognitive mastery) is sort of an inspiration for me. I picked forecasting as my field for “cognitive mastery,” as dubious as that might be. When I am directly engaged in an assignment, at some point or other, I feel the need for immersion in the data and in estimations of all types. This blog, on the other hand, represents an effort to survey and, to some extent, get control of new “tools” – at least in a first pass. Then, when I have problems at hand, I can try some of these new techniques.

Ok, so these remarks preface what you might call the humility of my approach to new methods currently being innovated. I am not putting myself on a level with the innovators, for example. At the same time, it’s important to retain perspective and not drop a critical stance.

The Working Paper and Article in the Journal of Finance

Probably one of the most widely-cited recent working papers is Kelly and Pruitt’s three pass regression filter (3PRF). The authors, shown above, are with the University of Chicago, Booth School of Business and the Federal Reserve Board of Governors, respectively, and judging from the extensive revisions to the 2011 version, they had a bit of trouble getting this one out of the skunk works.

Recently, however, Kelly and Pruit published an important article in the prestigious Journal of Finance called Market Expectations in the Cross-Section of Present Values. This article applies a version of the three pass regression filter to show that returns and cash flow growth for the aggregate U.S. stock market are highly and robustly predictable.

I learned of a published application of the 3PRF from Francis X. Dieblod’s blog, No Hesitations, where Diebold – one of the most published authorities on forecasting – writes

Recent interesting work, moreover, extends PLS in powerful ways, as with the Kelly-Pruitt three-pass regression filter and its amazing apparent success in predicting aggregate equity returns.

What is the 3PRF?

The working paper from the Booth School of Business cited at a couple of points above describes what might be cast as a generalization of partial least squares (PLS). Certainly, the focus in the 3PRF and PLS is on using latent variables to predict some target.

I’m not sure, though, whether 3PRF is, in fact, more of a heuristic, rather than an algorithm.

What I mean is that the three pass regression filter involves a procedure, described below.

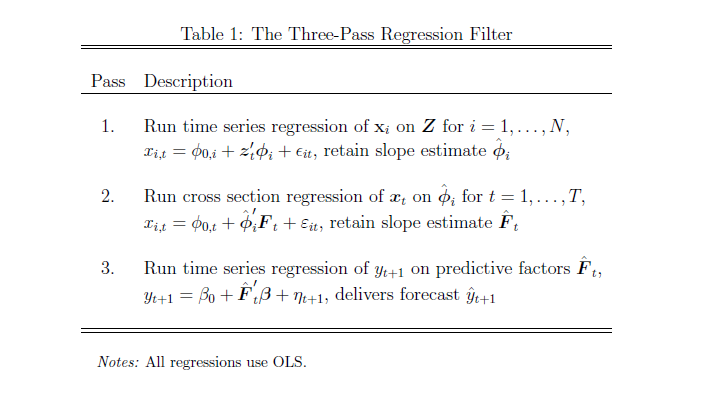
(click to enlarge).
3PRFprocedure

Here’s the basic idea –

Suppose you have a large number of potential regressors xi ε X, i=1,..,N. In fact, it may be impossible to calculate an OLS regression, since N > T the number of observations or time periods.

Furthermore, you have proxies zj ε  Z, I = 1,..,L – where L is significantly less than the number of observations T. These proxies could be the first several principal components of the data matrix, or underlying drivers which theory proposes for the situation. The authors even suggest an automatic procedure for generating proxies in the paper.

And, finally, there is the target variable yt which is a column vector with T observations.

Latent factors in a matrix F drive both the proxies in Z and the predictors in X. Based on macroeconomic research into dynamic factors, there might be only a few of these latent factors – just as typically only a few principal components account for the bulk of variation in a data matrix.

Now here is a key point – as Kelly and Pruitt present the 3PRF, it is a leading indicator approach when applied to forecasting macroeconomic variables such as GDP, inflation, or the like. Thus, the time index for yt ranges from 2,3,…T+1, while the time indices of all X and Z variables and the factors range from 1,2,..T. This means really that all the x and z variables are potentially leading indicators, since they map conditions from an earlier time onto values of a target variable at a subsequent time.

What Table 1 above tells us to do is –

  1. Run an ordinary least square (OLS) regression of the xi      in X onto the zj in X, where T ranges from 1 to T and there are      N variables in X and L << T variables in Z. So, in the example      discussed below, we concoct a spreadsheet example with 3 variables in Z,      or three proxies, and 10 predictor variables xi in X (I could      have used 50, but I wanted to see whether the method worked with lower      dimensionality). The example assumes 40 periods, so t = 1,…,40. There will      be 40 different sets of coefficients of the zj as a result of      estimating these regressions with 40 matched constant terms.
  2. OK, then we take this stack of estimates of      coefficients of the zj and their associated constants and map      them onto the cross sectional slices of X for t = 1,..,T. This means that,      at each period t, the values of the cross-section. xi,t, are      taken as the dependent variable, and the independent variables are the 40      sets of coefficients (plus constant) estimated in the previous step for      period t become the predictors.
  3. Finally, we extract the estimate of the factor loadings      which results, and use these in a regression with target variable as the      dependent variable.

This is tricky, and I have questions about the symbolism in Kelly and Pruitt’s papers, but the procedure they describe does work. There is some Matlab code here alongside the reference to this paper in Professor Kelly’s research.

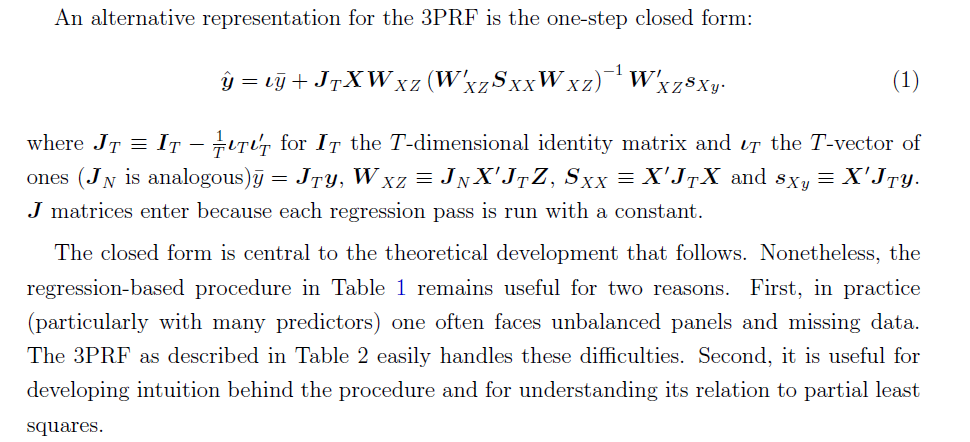
At the same time, all this can be short-circuited (if you have adequate data without a lot of missing values, apparently) by a single humungous formula –
3PRFformula

Here, the source is the 2012 paper.

Spreadsheet Implementation

Spreadsheets help me understand the structure of the underlying data and the order of calculation, even if, for the most part, I work with toy examples.

So recently, I’ve been working through the 3PRF with a small spreadsheet.

Generating the factors:I generated the factors as two columns of random variables (=rand()) in Excel. I gave the factors different magnitudes by multiplying by different constants.

Generating the proxies Z and predictors X. Kelly and Pruitt call for the predictors to be variance standardized, so I generated 40 observations on ten sets of xi by selecting ten different coefficients to multiply into the two factors, and in each case I added a normal error term with mean zero and standard deviation 1. In Excel, this is the formula =norminv(rand(),0,1).

Basically, I did the same drill for the three zj — I created 40 observations for z1, z2, and z3 by multiplying three different sets of coefficients into the two factors and added a normal error term with zero mean and variance equal to 1.

Then, finally, I created yt by multiplying randomly selected coefficients times the factors.

After generating the data, the first pass regression is easy. You just develop a regression with each predictor xi as the dependent variable and the three proxies as the independent variables, case-by-case, across the time series for each. This gives you a bunch of regression coefficients which, in turn, become the explanatory variables in the cross-sectional regressions of the second step.

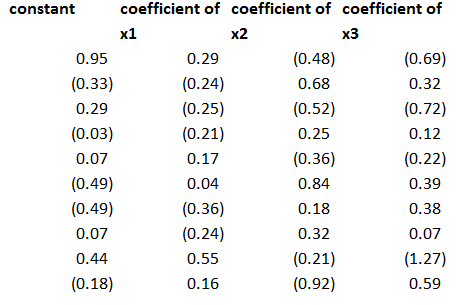
The regression coefficients I calculated for the three proxies, including a constant term, were as follows – where the 1st row indicates the regression for x1 and so forth.
coeff

This second step is a little tricky, but you just take all the values of the predictor variables for a particular period and designate these as the dependent variables, with the constant and coefficients estimated in the previous step as the independent variables. Note, the number of predictors pairs up exactly with the number of rows in the above coefficient matrix.

This then gives you the factor loadings for the third step, where you can actually predict yt (really yt+1 in the 3PRF setup). The only wrinkle is you don’t use the constant terms estimated in the second step, on the grounds that these reflect “idiosyncratic” effects, according to the 2011 revision of the paper.

Note the authors describe this as a time series approach, but do not indicate how to get around some of the classic pitfalls of regression in a time series context. Obviously, first differencing might be necessary for nonstationary time series like GDP, and other data massaging might be in order.

Bottom line – this worked well in my first implementation.

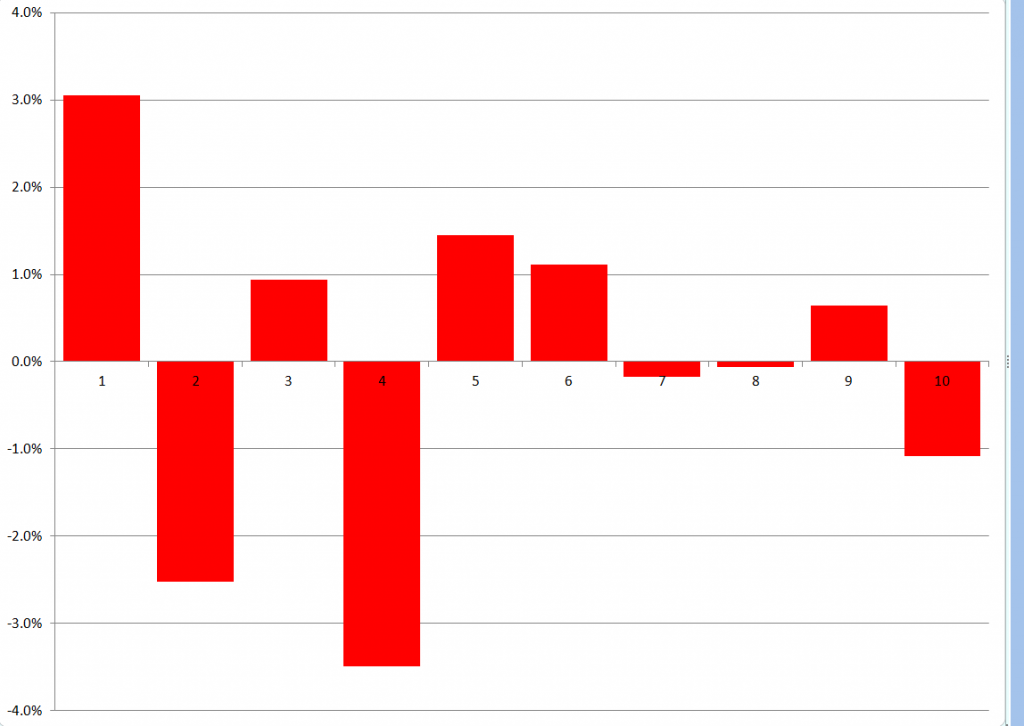
To forecast, I just used the last regression for yt+1 and then added ten more cases, calculating new values for the target variable with the new values of the factors. I used the new values of the predictors to update the second step estimate of factor loadings, and applied the last third pass regression to these values.

Here are the forecast errors for these ten out-of-sample cases.
3PRFforecasterror

Not bad for a first implementation.

 Why Is Three Pass Regression Important?

3PRF is a fairly “clean” solution to an important problem, relating to the issue of “many predictors” in macroeconomics and other business research.

Noting that if the predictors number near or more than the number of observations, the standard ordinary least squares (OLS) forecaster is known to be poorly behaved or nonexistent, the authors write,

How, then, does one effectively use vast predictive information? A solution well known in the economics literature views the data as generated from a model in which latent factors drive the systematic variation of both the forecast target, y, and the matrix of predictors, X. In this setting, the best prediction of y is infeasible since the factors are unobserved. As a result, a factor estimation step is required. The literature’s benchmark method extracts factors that are significant drivers of variation in X and then uses these to forecast y. Our procedure springs from the idea that the factors that are relevant to y may be a strict subset of all the factors driving X. Our method, called the three-pass regression filter (3PRF), selectively identifies only the subset of factors that influence the forecast target while discarding factors that are irrelevant for the target but that may be pervasive among predictors. The 3PRF has the advantage of being expressed in closed form and virtually instantaneous to compute.

So, there are several advantages, such as (1) the solution can be expressed in closed form (in fact as one complicated but easily computable matrix expression), and (2) there is no need to employ maximum likelihood estimation.

Furthermore, 3PRF may outperform other approaches, such as principal components regression or partial least squares.

The paper illustrates the forecasting performance of 3PRF with real-world examples (as well as simulations). The first relates to forecasts of macroeconomic variables using data such as from the Mark Watson database mentioned previously in this blog. The second application relates to predicting asset prices, based on a factor model that ties individual assets’ price-dividend ratios to aggregate stock market fluctuations in order to uncover investors’ discount rates and dividend growth expectations.