Category Archives: artificial intelligence (AI)

Video Friday on Steroids

Here is a list of the URL’s for all the YouTube and other videos shown on this blog from January 2014 through May of this year. I encourage you to shop this list, clicking on the links. There’s a lot of good stuff, including several  instructional videos on machine learning and other technical topics, a series on robotics, and several videos on climate and climate change.

January 2014

The Polar Vortex Explained in Two Minutes

https://www.youtube.com/watch?v=5eDTzV6a9F4

NASA – Six Decades of a Warming Earth

https://www.youtube.com/watch?v=gaJJtS_WDmI

“CHASING ICE” captures largest video calving of glacier

https://www.youtube.com/watch?v=hC3VTgIPoGU

Machine Learning and Econometrics

https://www.youtube.com/watch?v=EraG-2p9VuE

Can Crime Prediction Software Stop Criminals?

https://www.youtube.com/watch?v=s1-pbJKA3H8

Analytics 2013 – Day 1

https://www.youtube.com/watch?v=LsyOLBroVx4

The birth of a salesman

https://www.youtube.com/watch?v=pWM1dR_V7uw

Economies Improve

https://www.youtube.com/watch?v=5_DeCMIig_M

Kaggle – Energy Applications for Machine Learning

https://www.youtube.com/watch?v=mZZFXTUz-nI

2014 Outlook with Jan Hatzius

https://www.youtube.com/watch?v=Ggv0oC8L3Tk

Nassim Taleb Lectures at the NSF

https://www.youtube.com/watch?v=omsYJBMoIJU

Vernon Smith – Experimental Markets

https://www.youtube.com/watch?v=Uncl-wRfoK8


Forecast Pro – Quick Tour

https://www.youtube.com/watch?v=s8jMp5qS8v4

February 2014

Stephen Wolfram’s Introduction to the Wolfram Language

https://www.youtube.com/watch?v=_P9HqHVPeik

Tornados

https://www.youtube.com/watch?v=TEGhgsiNFJ4

Econometrics – Quantile Regression

https://www.youtube.com/watch?v=P9lMmEkXuBw

Quantile Regression Example

https://www.youtube.com/watch?v=qrriFC_WGj8

Brooklyn Grange – A New York Growing Season

http://vimeo.com/86266334

Getting in Shape for the Sport of Data Science

https://www.youtube.com/watch?v=kwt6XEh7U3g

Machine Learning – Decision Trees

https://www.youtube.com/watch?v=-dCtJjlEEgM

Machine Learning – Random Forests

https://www.youtube.com/watch?v=3kYujfDgmNk

Machine Learning – Random Forecasts Applications

https://www.youtube.com/watch?v=zFGPjRPwyFw

Malcolm Gladwell on the 10,000 Hour Rule

https://www.youtube.com/watch?v=XS5EsTc_-2Q

Sornette Talk

https://www.youtube.com/watch?v=Eomb_vbgvpk

Head of India Central Bank Interview

https://www.youtube.com/watch?v=BrVzema7pWE

March 2014

David Stockman

https://www.youtube.com/watch?v=DI718wFmReo

Partial Least Squares Regression

https://www.youtube.com/watch?v=WKEGhyFx0Dg

April 2014

Thomas Piketty on Economic Inequality

https://www.youtube.com/watch?v=qp3AaI5bWPQ

Bonobo builds a fire and tastes marshmellows

https://www.youtube.com/watch?v=GQcN7lHSD5Y

Future Technology

https://www.youtube.com/watch?v=JbQeABIoO6A

May 2014

Ray Kurzweil: The Coming Singularity

https://www.youtube.com/watch?v=1uIzS1uCOcE

Paul Root Wolpe: Kurzweil Critique

https://www.youtube.com/watch?v=qRgMTjTMovc

The Future of Robotics and Artificial Intelligence

https://www.youtube.com/watch?v=AY4ajbu_G3k

Car Factory – KIA Sportage Assembly Line

https://www.youtube.com/watch?v=sjAZGUcjrP8

10 Most Popular Applications for Robots

https://www.youtube.com/watch?v=fH4VwTgfyrQ

Predator Drones

https://www.youtube.com/watch?v=nMh8Cjnzen8

The Future of Robotic Warfare

https://www.youtube.com/watch?v=_atffUtxXtk

Bionic Kangaroo

https://www.youtube.com/watch?v=HUxQM0O7LpQ

Ping Pong Playing Robot

https://www.youtube.com/watch?v=tIIJME8-au8

Baxter, the Industrial Robot

https://www.youtube.com/watch?v=ukehzvP9lqg

Bootstrapping

https://www.youtube.com/watch?v=1OC9ul-1PVg

More Blackbox Analysis – ARIMA Modeling in R

Automatic forecasting programs are seductive. They streamline analysis, especially with ARIMA (autoregressive integrated moving average) models. You have to know some basics – such as what the notation ARIMA(2,1,1) or ARIMA(p,d,q) means. But you can more or less sidestep the elaborate algebra – the higher reaches of equations written in backward shift operators – in favor of looking at results. Does the automatic ARIMA model selection predict out-of-sample, for example?

I have been exploring the Hyndman R Forecast package – and other contributors, such as George Athanasopoulos, Slava Razbash, Drew Schmidt, Zhenyu Zhou, Yousaf Khan, Christoph Bergmeir, and Earo Wang, should be mentioned.

A 76 page document lists the routines in Forecast, which you can download as a PDF file.

This post is about the routine auto.arima(.) in the Forecast package. This makes volatility modeling – a place where Box Jenkins or ARIMA modeling is relatively unchallenged – easier. The auto.arima(.) routine also encourages experimentation, and highlights the sharp limitations of volatility modeling in a way that, to my way of thinking, is not at all apparent from the extensive and highly mathematical literature on this topic.

Daily Gold Prices

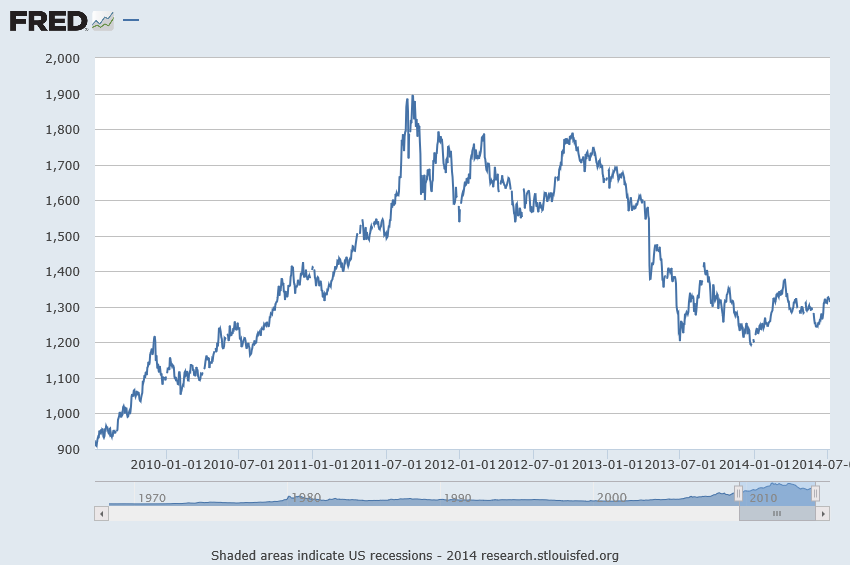
I grabbed some data from FRED – the Gold Fixing Price set at 10:30 A.M (London time) in London Bullion Market, based in U.S. Dollars.

GOLDAMGBD228NLBM

Now the price series shown in the graph above is a random walk, according to auto.arima(.).

In other words, the routine indicates that the optimal model is ARIMA(0,1,0), which is to say that after differencing the price series once, the program suggests the series reduces to a series of independent random values. The automatic exponential smoothing routine in Forecast is ets(.). Running this confirms that simple exponential smoothing, with a smoothing parameter close to 1, is the optimal model – again, consistent with a random walk.

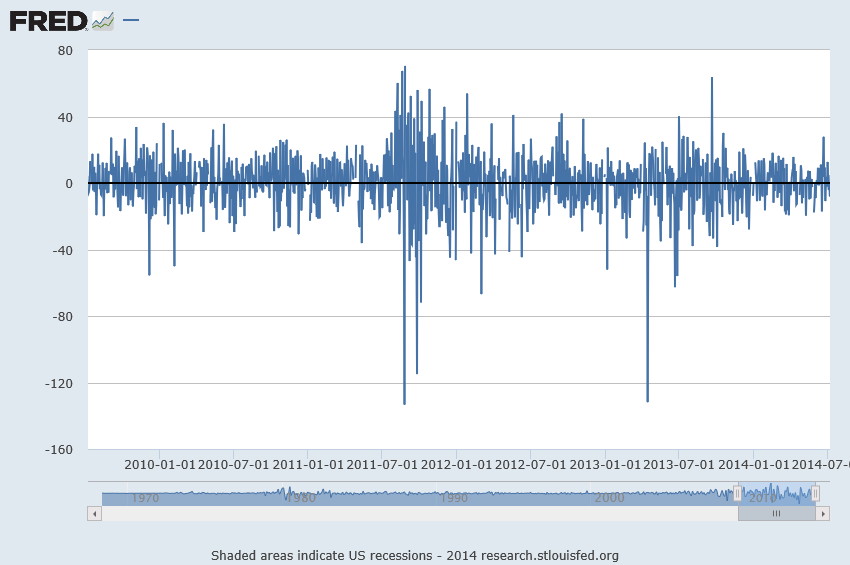
Here’s a graph of these first differences.

1stdiffgold

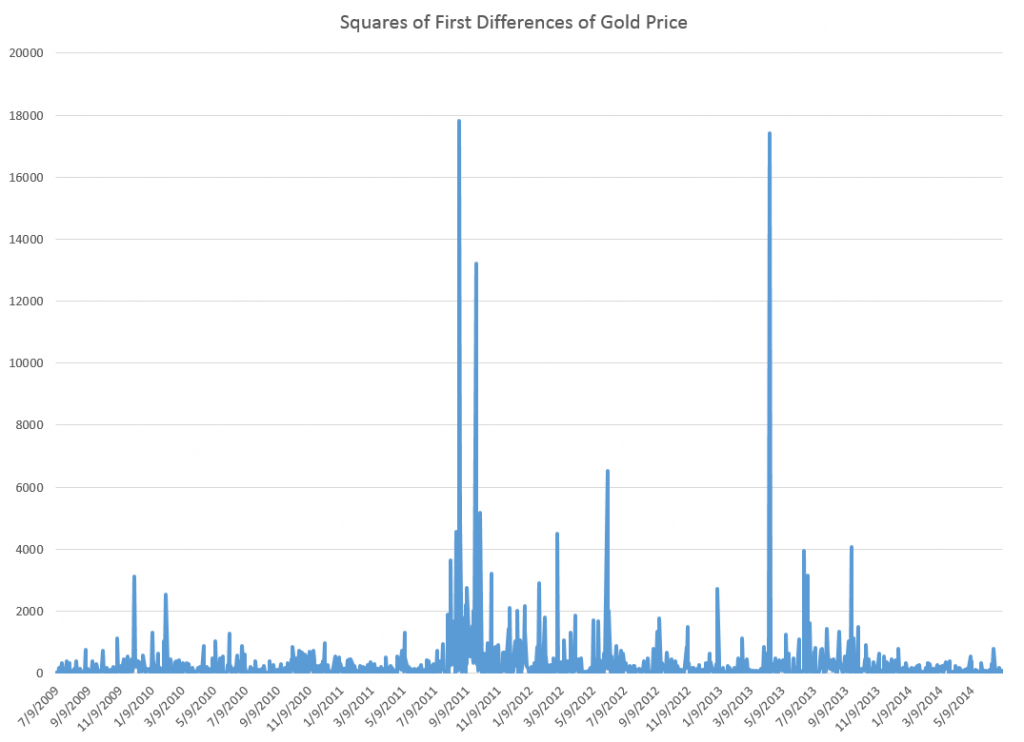
But wait, there is a clustering of volatility of these first differences, which can be accentuated if we square these values, producing the following graph.

volatilityGP

Now in a more or less textbook example, auto.arima(.) develops the following ARIMA model for this series

model

Thus, this estimate of the volatility of the first differences of gold price is modeled as a first order autoregressive process with two moving average terms.

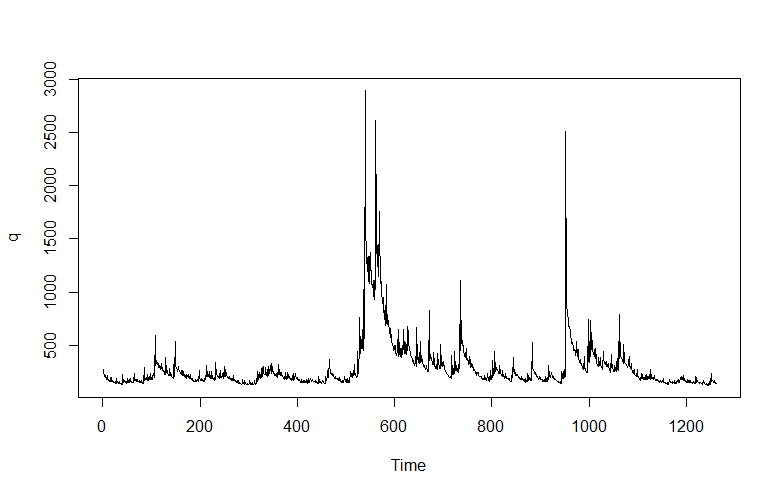
Here is the plot of the fitted values.

Rplot1

Nice.

But of course, we are interested in forecasting, and the results here are somewhat more disappointing.

Basically, this type of model makes a horizontal line prediction at a certain level, which is higher when the past values have been higher.

This is what people in quantitative finance call “persistence” but of course sometimes new things happen, and then these types of models do not do well.

From my research on the volatility literature, it seems that short period forecasts are better than longer period forecasts. Ideally, you update your volatility model daily or at even higher frequencies, and it’s likely your one or two period ahead (minutes, hours, a day) will be more accurate.

Incidentally, exponential smoothing in this context appears to be a total fail, again suggesting this series is a simple random walk.

Recapitulation

There is more here than meets the eye.

First, the auto.arima(.) routines in the Hyndman R Forecast package do a competent job of modeling the clustering of higher first differences of the gold price series here. But, at the same time, they highlight a methodological point. The gold price series really has nonlinear aspects that are not adequately commanded by a purely linear model. So, as in many approximations, the assumption of linearity gets us some part of the way, but deeper analysis indicates the existence of nonlinearities. Kind of interesting.

Of course, I have not told you about the notation ARIMA(p,d,q). Well, p stands for the order of the autoregressive terms in the equation, q stands for the moving average terms, and d indicates the times the series is differenced to reduce it to a stationary time series. Take a look at Forecasting: principles and practice – the free forecasting text of Hyndman and Athanasopoulos – in the chapter on ARIMA modeling for more details.

Incidentally, I think it is great that Hyndman and some of his collaborators are providing an open source, indeed free, forecasting package with automatic forecasting capabilities, along with a high quality and, again, free textbook on forecasting to back it up. Eventually, some of these techniques might get dispersed into the general social environment, potentially raising the level of some discussions and thinking about our common future.

And I guess also I have to say that, ultimately, you need to learn the underlying theory and struggle with the algebra some. It can improve one’s ability to model these series.

Links – early July 2014

While I dig deeper on the current business outlook and one or two other issues, here are some links for this pre-Fourth of July week.

Predictive Analytics

A bunch of papers about the widsom of smaller, smarter crowds I think the most interesting of these (which I can readily access) is Identifying Expertise to Extract the Wisdom of Crowds which develops a way by eliminating poorly performing individuals from the crowd to improve the group response.

Application of Predictive Analytics in Customer Relationship Management: A Literature Review and Classification From the Proceedings of the Southern Association for Information Systems Conference, Macon, GA, USA March 21st–22nd, 2014. Some minor problems with writing English in the article, but solid contribution.

US and Global Economy

Nouriel Roubini: There’s ‘schizophrenia’ between what stock and bond markets tell you Stocks tell you one thing, but bond yields suggest another. Currently, Roubini is guardedly optimistic – Eurozone breakup risks are receding, US fiscal policy is in better order, and Japan’s aggressively expansionist fiscal policy keeps deflation at bay. On the other hand, there’s the chance of a hard landing in China, trouble in emerging markets, geopolitical risks (Ukraine), and growing nationalist tendencies in Asia (India). Great list, and worthwhile following the links.

The four stages of Chinese growth Michael Pettis was ahead of the game on debt and China in recent years and is now calling for reduction in Chinese growth to around 3-4 percent annually.

Because of rapidly approaching debt constraints China cannot continue what I characterize as the set of “investment overshooting” economic polices for much longer (my instinct suggests perhaps three or four years at most). Under these policies, any growth above some level – and I would argue that GDP growth of anything above 3-4% implies almost automatically that “investment overshooting” policies are still driving growth, at least to some extent – requires an unsustainable increase in debt. Of course the longer this kind of growth continues, the greater the risk that China reaches debt capacity constraints, in which case the country faces a chaotic economic adjustment.

Politics

Is This the Worst Congress Ever? Barry Ritholtz decries the failure of Congress to lower interest rates on student loans, observing –

As of July 1, interest on new student loans rises to 4.66 percent from 3.86 percent last year, with future rates potentially increasing even more. This comes as interest rates on mortgages and other consumer credit hovered near record lows. For a comparison, the rate on the 10-year Treasury is 2.6 percent. Congress could have imposed lower limits on student-loan rates, but chose not to.

This is but one example out of thousands of an inability to perform the basic duties, which includes helping to educate the next generation of leaders and productive citizens. It goes far beyond partisanship; it is a matter of lack of will, intelligence and ability.

Hear, hear.

Climate Change

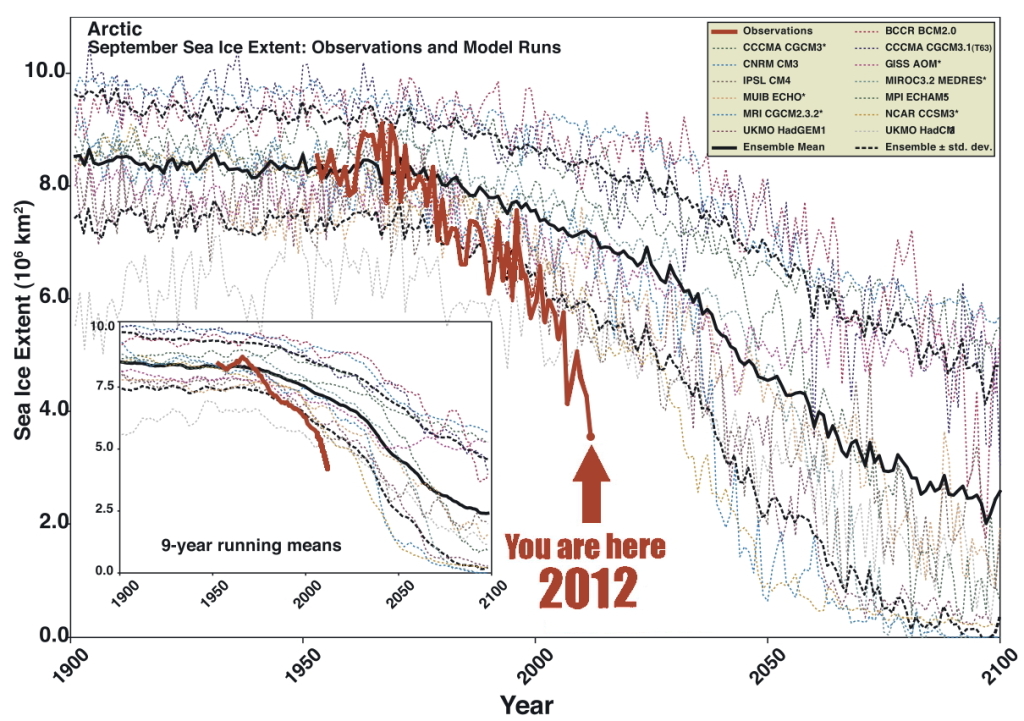
Climate news: Arctic seafloor methane release is double previous estimates, and why that matters This is a ticking time bomb. Article has a great graphic (shown below) which contrasts the projections of loss of Artic sea ice with what actually is happening – underlining that the facts on the ground are outrunning the computer models. Methane has more than an order of magnitude more global warming impact that carbon dioxide, per equivalent mass.

ArcticSeaIce

Dahr Jamail | Former NASA Chief Scientist: “We’re Effectively Taking a Sledgehammer to the Climate System”

I think the sea level rise is the most concerning. Not because it’s the biggest threat, although it is an enormous threat, but because it is the most irrefutable outcome of the ice loss. We can debate about what the loss of sea ice would mean for ocean circulation. We can debate what a warming Arctic means for global and regional climate. But there’s no question what an added meter or two of sea level rise coming from the Greenland ice sheet would mean for coastal regions. It’s very straightforward.

Machine Learning

EG

Computer simulating 13-year-old boy becomes first to pass Turing test A milestone – “Eugene Goostman” fooled more than a third of the Royal Society testers into thinking they were texting with a human being, during a series of five minute keyboard conversations.

The Milky Way Project: Leveraging Citizen Science and Machine Learning to Detect Interstellar Bubbles Combines Big Data and crowdsourcing.

The Loebner Prize and Turing Test

In a brilliant, early article on whether machines can “think,” Alan Turing, the genius behind a lot of early computer science, suggested that if a machine cannot be distinguished from a human during text-based conversation, that machine could be said to be thinking and have intelligence.

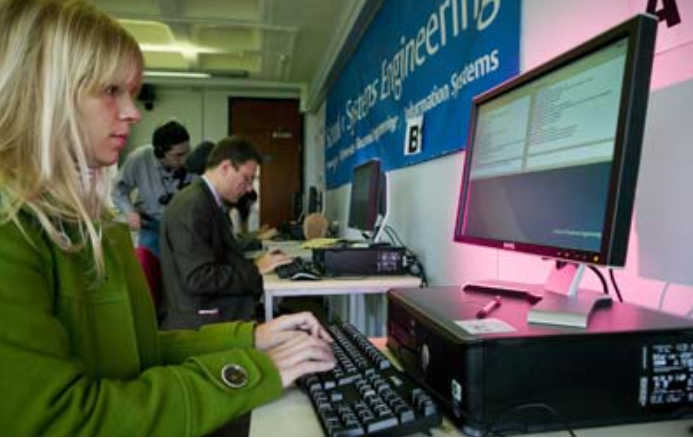
Every year, the Loebner Prize holds this type of Turing comptition. Judges, such as those below, interact with computer programs (and real people posing as computer programs). If a

judges

computer program fools enough people, the program is elible for various prizes.

The 2013 prize was won by Mitsuki Chatbox advertised as an artificial lifeform living on the web.

chatbot

She certainly is fun, and is an avatar of a whole range of chatbots which are increasingly employed in customer service and other business applications.

Mitsuku’s botmaster, Steve Worswick, ran a music website with a chatbot. Apparently, more people visited to chat than for music so he concentrated his efforts on the bot, which he still regards as a hobby. Mitsuku uses AIML (Artificial Intelligence Markup Language) used by members of pandorabot.

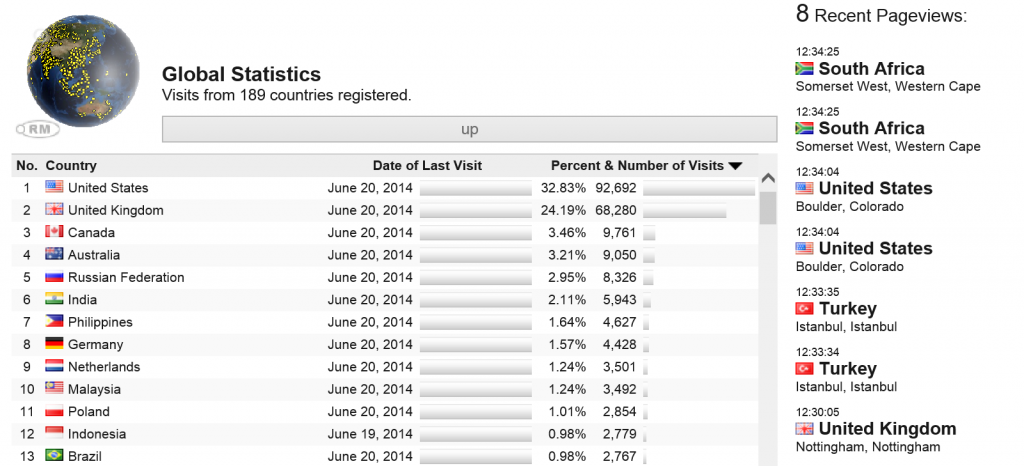
Mitsuki is very cute, which perhaps one reason why she gets worldwide attention.

pageviews

It would be fun to develop a forecastbot, capable of answering basic questions about which forecasting method might be appropriate. We’ve all seen those flowcharts and tabular arrays with data characteristics and forecast objectives on one side, and recommended methods on the other.


Global Energy Forecasting Competitions

The 2012 Global Energy Forecasting Competition was organized by an IEEE Working Group to connect academic research and industry practice, promote analytics in engineering education, and prepare for forecasting challenges in the smart grid world. Participation was enhanced by alliance with Kaggle for the load forecasting track. There also was a second track for wind power forecasting.

Hundreds of people and many teams participated.

This year’s April/June issue of the International Journal of Forecasting (IJF) features research from the winners.

Before discussing the 2012 results, note that there’s going to be another competition – the Global Energy Forecasting Competition 2014 – scheduled for launch August 15 of this year. Professor Tao Hong, a key organizer, describes the expansion of scope,

GEFCom2014 (www.gefcom.org) will feature three major upgrades: 1) probabilistic forecasts in the form of predicted quantiles; 2) four tracks on demand, price, wind and solar; 3) rolling forecasts with incremental data update on weekly basis.

Results of the 2012 Competition

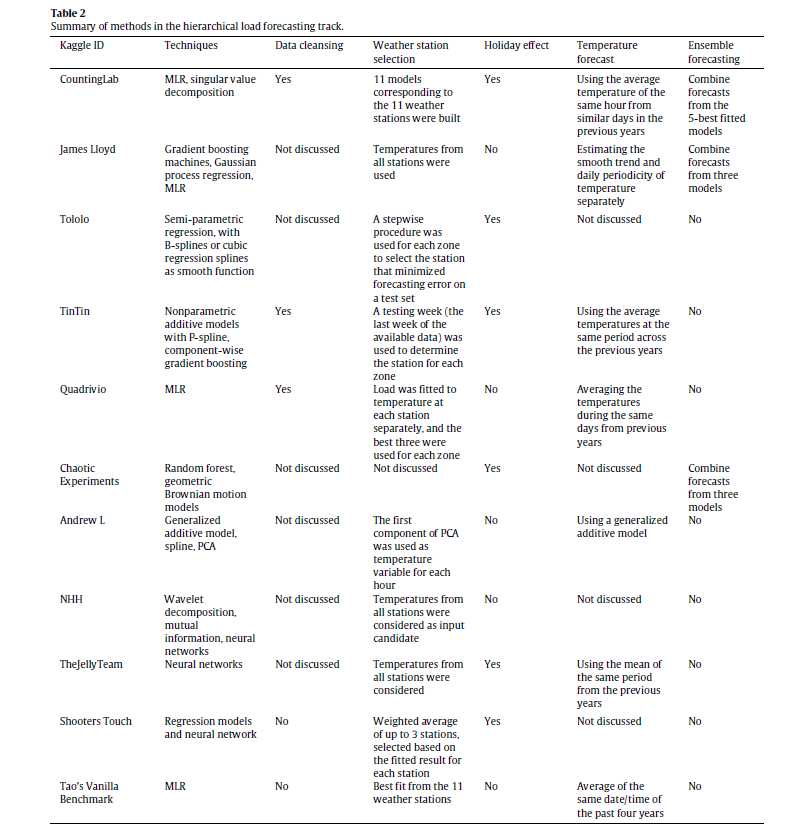
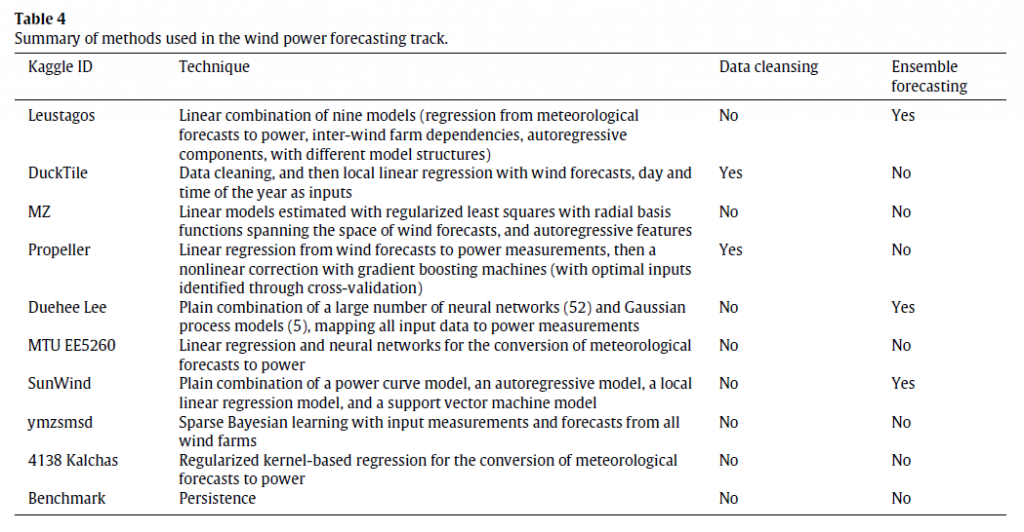
The IJF has an open source article on the competition. This features a couple of interesting tables about the methods in the load and wind power tracks (click to enlarge).

hload

The error metric is WRMSE, standing for weighted root mean square error. One week ahead system (as opposed to zone) forecasts received the greatest weight. The top teams with respect to WRMSE were Quadrivio, CountingLab, James Lloyd, and Tololo (Électricité de France).

wind

The top wind power forecasting teams were Leustagos, DuckTile, and MZ based on overall performance.

Innovations in Electric Power Load Forecasting

The IJF overview article pitches the hierarchical load forecasting problem as follows:

participants were required to backcast and forecast hourly loads (in kW) for a US utility with 20 zones at both the zonal (20 series) and system (sum of the 20 zonal level series) levels, with a total of 21 series. We provided the participants with 4.5 years of hourly load and temperature history data, with eight non-consecutive weeks of load data removed. The backcasting task is to predict the loads of these eight weeks in the history, given actual temperatures, where the participants are permitted to use the entire history to backcast the loads. The forecasting task is to predict the loads for the week immediately after the 4.5 years of history without the actual temperatures or temperature forecasts being given. This is designed to mimic a short term load forecasting job, where the forecaster first builds a model using historical data, then develops the forecasts for the next few days.

One of the top entries is by a team from Électricité de France (EDF) and is written up under the title GEFCom2012: Electric load forecasting and backcasting with semi-parametric models.

This is behind the International Journal of Forecasting paywall at present, but some of the primary techniques can be studied in a slide set by Yannig Goulde.

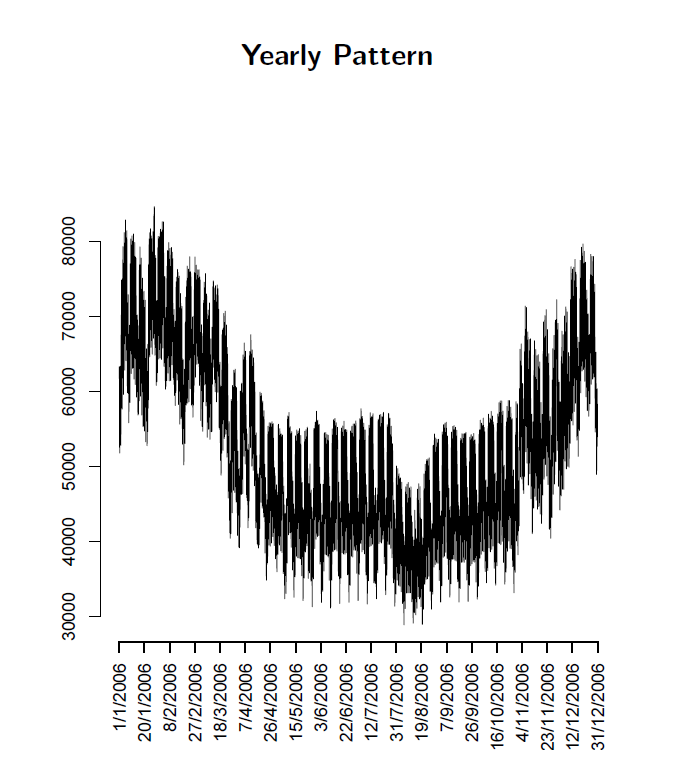
This is an interesting deck because it maps key steps in using semi-parametric models and illustrates real world system power load or demand data, as in this exhibit of annual variation showing the trend over several years.

trend

Or this exhibit showing annual variation.

annual

What intrigues me about the EDF approach in the competition and, apparently, more generally in their actual load forecasting, is the use of splines and knots. I’ve seen this basic approach applied in other time series contexts, for example, to facilitate bagging estimates.

So these competitions seem to provide solid results which can be applied in a real-world setting.

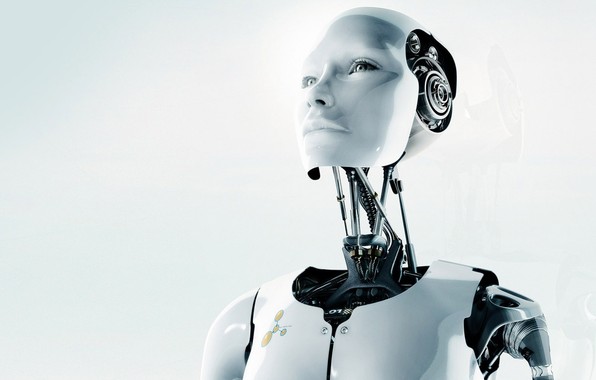
Top image from Triple-Curve

Predicting the Singularity, the Advent of Superintelligence

From thinking about robotics, automation, and artificial intelligence (AI) this week, I’m evolving a picture of the future – the next few years. I think you have to define a super-technological core, so to speak, and understand how the systems of production, communication, and control mesh and interpenetrate across the globe. And how this sets in motion multiple dynamics.

But then there is the “singularity” –  whose main publicizer is Ray Kurzweil, current Director of Engineering at Google. Here’s a particularly clear exposition of his view.

There’s a sort of rebuttal by Paul Root Wolpe.

Part of the controversy, as in many arguments, is a problem of definition. Kurzweil emphasizes a “singularity” of superintelligence of machines. For him, the singularity is at first the point at which the processes of the human brain will be well understood and thinking machines will be available that surpass human capabilities in every respect. Wolpe, on the other hand, emphasizes the “event horizon” connotation of the singularity – that point beyond which out technological powers will have become so immense that it is impossible to see beyond.

And Wolpe’s point about the human brain is probably well-taken. Think, for instance, of how decoding the human genome was supposed to unlock the secrets of genetic engineering, only to find that there were even more complex systems of proteins and so forth.

And the brain may be much more complicated than the current mechanical models suggest – a view espoused by Roger Penrose, English mathematical genius. Penrose advocates a  quantum theory of consciousness. His point, made first in his book The Emperor’s New Mind, is that machines will never overtake human consciousness, because, in fact, human consciousness is, at the limit, nonalgorithmic. Basically, Penrose has been working on the idea that the brain is a quantum computer in some respect.

I think there is no question, however, that superintelligence in the sense of fast computation, fast assimilation of vast amounts of data, as well as implementation of structures resembling emotion and judgment – all these, combined with the already highly developed physical capabilities of machines, mean that we are going to meet some mojo smart machines in the next ten to twenty years, tops.

The dysutopian consequences are enormous. Bill Joy, co-founder of Sun Microsystems, wrote famously about why the future does not need us. I think Joy’s singularity is a sort of devilish mirror image of Kurzweil’s – for Joy the singularity could be a time when nanotechnology, biotechnology, and robotics link together to make human life more or less impossible, or significantly at risk.

There’s is much more to say and think on this topic, to which I hope to return from time to time.

Meanwhile, I am reminded of Voltaire’s Candide who, at the end of pursuing the theories of Dr. Pangloss, concludes “we must cultivate our garden.”

Robotics – the Present, the Future

A picture is worth one thousand words. Here are several videos, mostly from Youtube, discussing robotics and artificial intelligence (AI) and showing present and future capabilities. The videos fall in five areas – concepts with Andrew Ng, Industrial Robots and their primary uses, Military Robotics, including a presentation on predator drones, and some state-of-the-art innovations in robotics which mimic the human approach to a degree.

Andrew Ng  – The Future of Robotics and Artificial Intelligence

Car Factory – Kia Sportage factory production line

ABB Robotics – 10 most popular applications for robots


Predator Drones


Innovators: The Future of Robotic Warfare


Bionic kangaroo


The Duel: Timo Boll vs. KUKA Robot


Jobs and the Next Wave of Computerization

A duo of researchers from Oxford University (Frey and Osborne) made a splash with their analysis of employment and computerization in the US (English spelling). Their research, released September of last year, projects that –

47 percent of total US employment is in the high risk category, meaning that associated occupations are potentially automatable over some unspecified number of years, perhaps a decade or two..

Based on US Bureau of Labor Statistics (BLS) classifications from O*NET Online, their model predicts that most workers in transportation and logistics occupations, together with the bulk of office and administrative support workers, and labour in production occupations, are at risk.

This research deserves attention, if for no other reason than masterful discussions of the impact of technology on employment and many specific examples of new areas for computerization and automation.

For example, I did not know,

Oncologists at Memorial Sloan-Kettering Cancer Center are, for example, using IBM’s Watson computer to provide chronic care and cancer treatment diagnostics. Knowledge from 600,000 medical evidence reports, 1.5 million patient records and clinical trials, and two million pages of text from medical journals, are used for benchmarking and pattern recognition purposes. This allows the computer to compare each patient’s individual symptoms, genetics, family and medication history, etc., to diagnose and develop a treatment plan with the highest probability of success..

There are also specifics of computerized condition monitoring and novelty detection -substituting for closed-circuit TV operators, workers examining equipment defects, and clinical staff in intensive care units.

A followup Atlantic Monthly article – What Jobs Will the Robots Take? – writes,

We might be on the edge of a breakthrough moment in robotics and artificial intelligence. Although the past 30 years have hollowed out the middle, high- and low-skill jobs have actually increased, as if protected from the invading armies of robots by their own moats. Higher-skill workers have been protected by a kind of social-intelligence moat. Computers are historically good at executing routines, but they’re bad at finding patterns, communicating with people, and making decisions, which is what managers are paid to do. This is why some people think managers are, for the moment, one of the largest categories immune to the rushing wave of AI.

Meanwhile, lower-skill workers have been protected by the Moravec moat. Hans Moravec was a futurist who pointed out that machine technology mimicked a savant infant: Machines could do long math equations instantly and beat anybody in chess, but they can’t answer a simple question or walk up a flight of stairs. As a result, menial work done by people without much education (like home health care workers, or fast-food attendants) have been spared, too.

What Frey and Osborne at Oxford suggest is an inflection point, where machine learning (ML) and what they call mobile robotics (MR) have advanced to the point where new areas for applications will open up – including a lot of menial, service tasks that were not sufficiently routinized for the first wave.

In addition, artificial intelligence (AI) and Big Data algorithms are prying open up areas formerly dominated by intellectual workers.

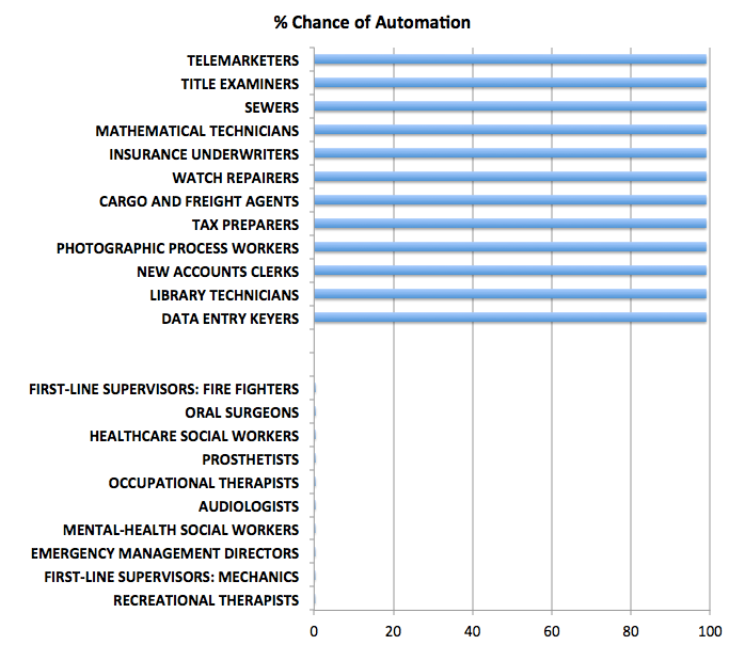
The Atlantic Monthly article cited above has an interesting graphic –

jobsautomationSo at the top of this chart are the jobs which are at 100 percent risk of being automated, while at the bottom are jobs which probably will never be automated (although I do think counseling can be done to a certain degree by AI applications).

The Final Frontier

This blog focuses on many of the relevant techniques in machine learning – basically unsupervised learning of patterns – which in the future will change everything.

Driverless cars are the wow example, of course.

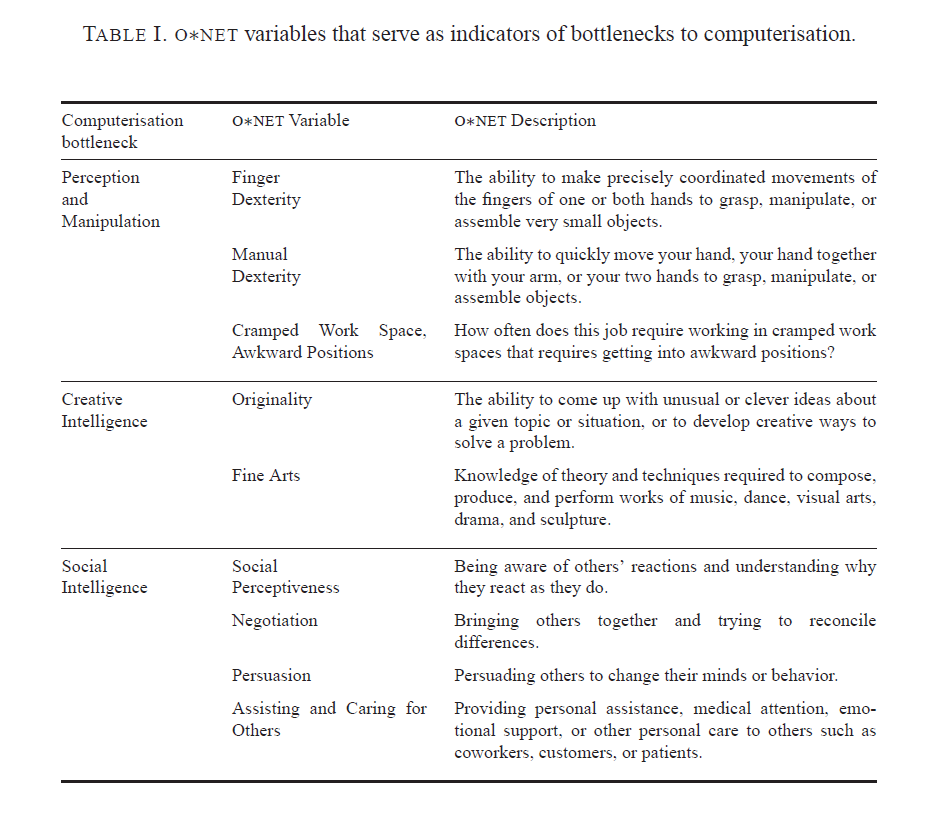
Bottlenecks to moving further up the curve of computerization are highlighted in the following table from the Oxford U report.

ONETvars

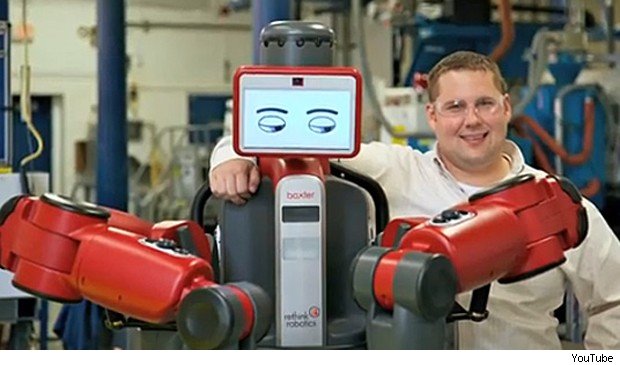
As far as dexterity and flexibility goes, Baxter shows great promise, as the following YouTube from his innovators illustrates.

There also are some wonderful examples of apparent creativity by computers or automatic systems, which I plan to detail in a future post.

Frey and Osborn, reflecting on their research in a 2014 discussion, conclude

So, if a computer can drive better than you, respond to requests as well as you and track down information better than you, what tasks will be left for labour? Our research suggests that human social intelligence and creativity are the domains were labour will still have a comparative advantage. Not least, because these are domains where computers complement our abilities rather than substitute for them. This is because creativity and social intelligence is embedded in human values, meaning that computers would not only have to become better, but also increasingly human, to substitute for labour performing such work.

Our findings thus imply that as technology races ahead, low-skill workers will need to reallocate to tasks that are non-susceptible to computerisation – i.e., tasks requiring creative and social intelligence. For workers to win the race, however, they will have to acquire creative and social skills. Development strategies thus ought to leverage the complementarity between computer capital and creativity by helping workers transition into new work, involving working with computers and creative and social ways.

Specifically, we recommend investing in transferable computer-related skills that are not particular to specific businesses or industries. Examples of such skills are computer programming and statistical modeling. These skills are used in a wide range of industries and occupations, spanning from the financial sector, to business services and ICT.

Implications For Business Forecasting

People specializing in forecasting for enterprise level business have some responsibility to “get ahead of the curve” – conceptually, at least.

Not everybody feels comfortable doing this, I realize.

However, I’m coming to the realization that these discussions of how many jobs are susceptible to “automation” or whatever you want to call it (not to mention jobs at risk for “offshoring”) – these discussions are really kind of the canary in the coal mine.

Something is definitely going on here.

But what are the metrics? Can you backdate the analysis Frey and Osborne offer, for example, to account for the coupling of productivity growth and slower employment gains since the last recession?

Getting a handle on this dynamic in the US, Europe, and even China has huge implications for marketing, and, indeed, social control.