The mathematics of random walks form the logical underpinning for the dynamics of prices in stock, currency, futures, and commodity markets.
Once you accept this, what is really interesting is to consider departures from random walk movements of prices. Such distortions can signal underlying biases brought to the table by investors and others with influence in these markets.
“Falling knives” may be an example.
A good discussion is presented in Falling Knives: Do Stocks Really Drop 3 Times Faster Than They Rise?
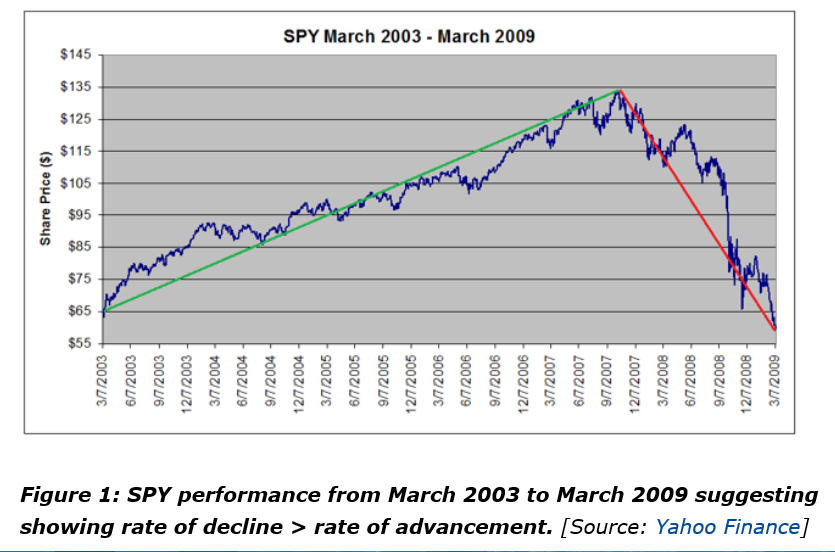
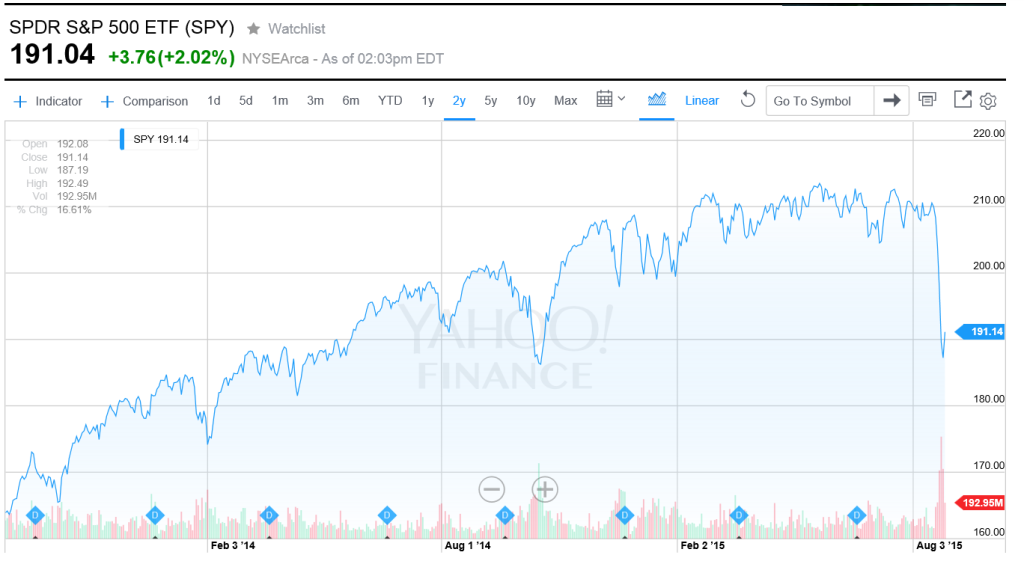
This article in Seeking Alpha is more or less organized around the following chart.
The authors argue this classic chart is really the result of a “Black Swan” event – namely the Great Recession of 2008-2009. Outside of unusual deviations, however, they try to show that “the rate of rallies and pullbacks are approximately equal.”
I’ve been exploring related issues and presently am confident that there are systematic differences in the volatility of high and low prices over a range of time periods.
This seems odd to say, since high and low prices exist within the continuum of prices, their only distinguishing feature being that they are extreme values over the relevant interval – a trading day or collection of trading days.
However, the variance or standard deviation of daily percent changes or rates of change of high and low prices are systematically different for high and low prices in many examples I have seen.
Consider, for example, rates of change of daily high and low prices for the SPY exchange traded fund (ETF) – the security charted in the preceding graph.
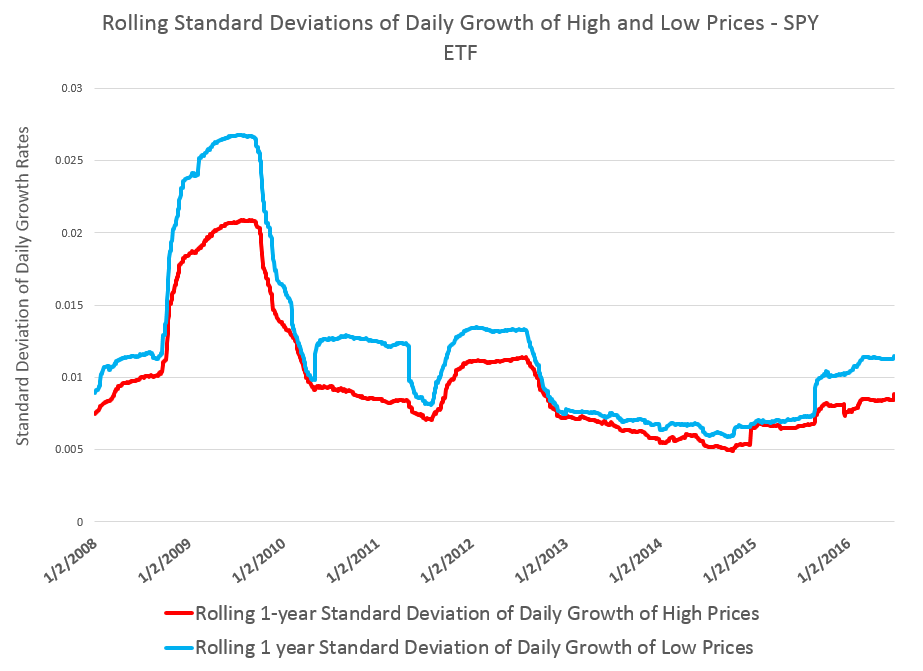
This chart shows the standard deviation of daily rates of change of high and low prices for the SPY over rolling annual time windows.
This evidence suggests higher volatility for daily growth or rates of change of low prices is more than something linked just with “Black Swan events.”
Thus, while the largest differences between standard deviations occur in late 2008 through 2009 – precisely the period of the financial crisis – in 2011 and 2012, as well as recently, we see the variance of daily rates of change of low prices significantly higher than those for high prices.
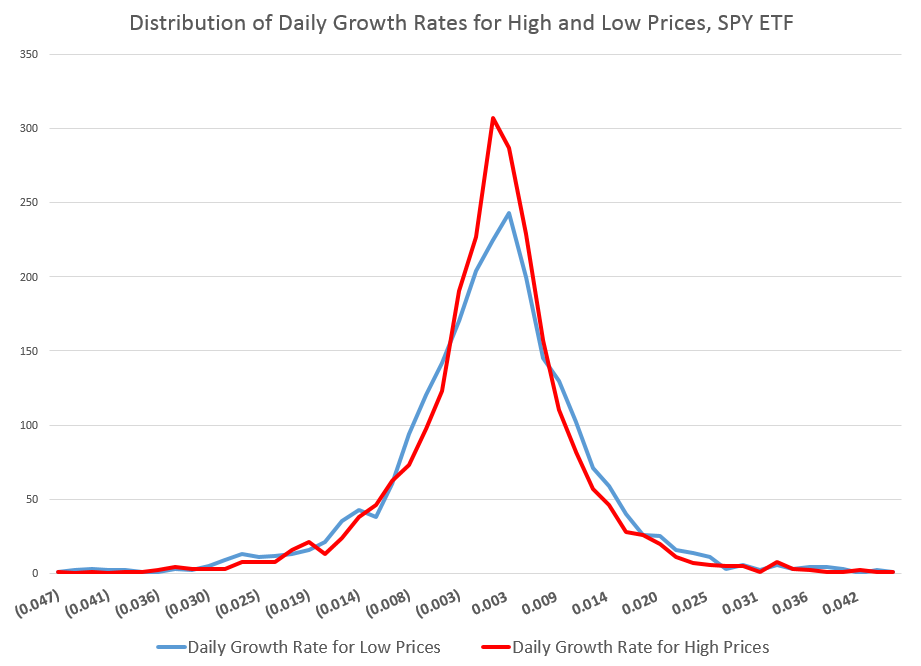
The following chart shows the distribution of these standard deviations of rates of change of daily high and low prices.
You can see the distribution of the daily growth rates for low prices – the blue line – is fatter in a certain sense, with more instances of somewhat greater standard deviations than the daily growth rates for high prices. As a consequence, too, the distribution of the daily growth rates of low prices shows less concentration near the modal value, which is sharply peaked for both curves.
These are not Gaussian or normal distributions, of course. And I find it interesting that the finance literature, despite decades of recognition of these shapes, does not appear to have a consensus on exactly what types of distributions these are. So I am not going to jump in with my two bits worth, although I’ve long thought that these resemble Laplace Distributions.
In any case, what we have here is quite peculiar, and can be replicated for most of the top 100 ETF’s by market capitalization. The standard deviation of rates of change of current low price to previous low prices generally exceeds the standard deviation of rates of change of high prices, similarly computed.
Some of this might be arithmetic, since by definition high prices are greater numerically than low prices, and we are computing rates of change.
However, it’s easy to dispel the idea that this could account for the types of effects seen with SPY and other securities. You can simulate a random walk, for example, and in thousands of replications with positive prices essentially lose any arithmetic effect of this type in noise.
I believe there is more to this, also.
For example, I find evidence that movements of low prices lead movements of high prices over some time frames.
Investor psychology is probably the most likely explanation, although today we have to take into account the “psychology” of robot trading algorithms. Presumeably, these reflect, in some measure, the predispositions of their human creators.
It’s kind of a puzzle.
Top image from SGS Swinger BlogSpot

