The Arc Sine Law and Competitions

There is a topic I think you can call the “structure of randomness.” Power laws are included, as are various “arcsine laws” governing the probability of leads and changes in scores in competitive games and, of course, in winnings from gambling.

I ran onto a recent article showing how basketball scores follow arcsine laws.

Safe Leads and Lead Changes in Competitive Team Sports is based on comprehensive data from league games over several seasons in the National Basketball Association (NBA).

“..we find that many …statistical properties are explained by modeling the evolution of the lead time X as a simple random walk. More strikingly, seemingly unrelated properties of lead statistics, specifically, the distribution of the times t: (i) for which one team is leading..(ii) for the last lead change..(and (iii) when the maximal lead occurs, are all described by the ..celebrated arcsine law..”

The chart below shows the arcsine probability distribution function (PDF). This probability curve is almost the opposite or reverse of the widely known normal probability distribution. Instead of a bell-shape with a maximum probability in the middle, the arcsine distribution has the unusual property that probabilities are greatest at the lower and upper bounds of the range. Of course, what makes both curves probability distributions is that the area they span adds up to 1.

arcsine

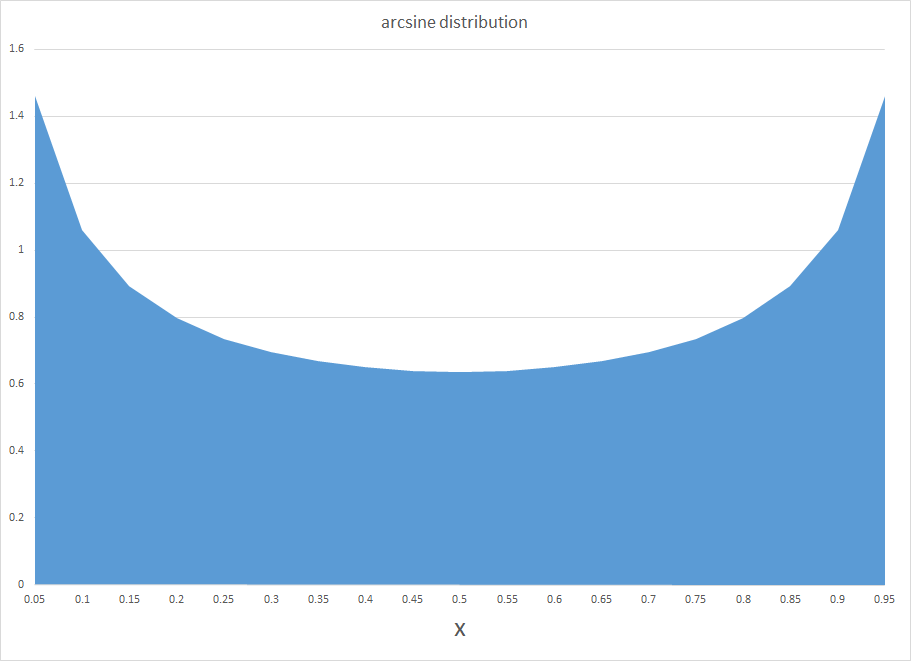
So, apparently, the distribution of time that a basketball team holds a lead in a basketball game is well-described by the arcsine distribution. This means lead changes are most likely at the beginning and end of the game, and least likely in the middle.

An earlier piece in the Financial Analysts Journal (The Arc Sine Law and the Treasure Bill Futures Market) notes,

..when two sports teams play, even though they have equal ability, the arc sine law dictates that one team will probably be in the lead most of the game. But the law also says that games with a close final score are surprisingly likely to be “last minute, come from behind” affairs, in which the ultimate winner trailed for most of the game..[Thus] over a series of games in which close final scores are common, one team could easily achieve a string of several last minute victories. The coach of such a team might be credited with being brilliantly talented, for having created a “second half” team..[although] there is a good possibility that he owes his success to chance.

There is nice mathematics underlying all this.

The name “arc sine distribution” derives from the integration of the PDF in the chart – a PDF which has the formula –

f(x) = 1/(π (x(1-x).5)

Here, the integral of f(x) yields the cumulative distribution function F(x) and involves an arcsine function,

F(x) = 2/(π arcsin(x.5))

Fundamentally, the arcsine law relates to processes where there are probabilities of winning and losing in sequential trials. The PDF follows from the application of Stirling’s formula to estimate expressions with factorials, such as the combination of p+q things taken p at a time, which quickly becomes computationally cumbersome as p+q increases in size.

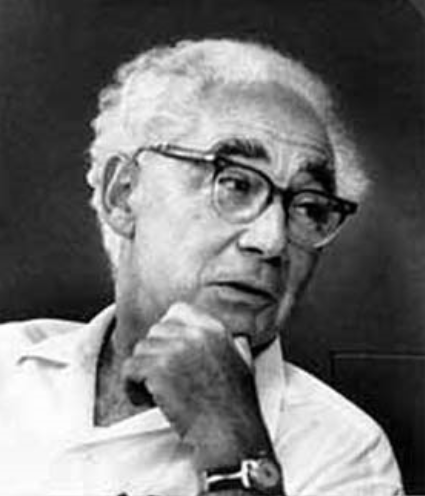
There is probably no better introduction to the relevant mathematics than Feller’s exposition in his classic An Introduction to Probability Theory and Its Applications, Volume I.

Feller had an unusual ability to write lucidly about mathematics. His Chapter III “Fluctuations in Coin Tossing and Random Walks” in IPTAIA is remarkable, as I have again convinced myself by returning to study it again.

Feller

He starts out this Chapter III with comments:

We shall encounter theoretical conclusions which not only are unexpected but actually come as a shock to intuition and common sense. They will reveal that commonly accepted motions concerning chance fluctuations are without foundation and that the implications of the law of large numbers are widely misconstrued. For example, in various applications it is assumed that observations on an individual coin-tossing game during a long time interval will yield the same statistical characteristics as the observation of the results of a huge number of independent games at one given instant. This is not so..

Most pointedly, for example, “contrary to popular opinion, it is quite likely that in a long coin-tossing game one of the players remains practically the whole time on the winning side, the other on the losing side.”

The same underlying mathematics produces the Ballot Theorem, which states the chances a candidate will be ahead from an early point in vote counting, based on the final number of votes for that candidate.

This application, of course, comes very much to the fore in TV coverage of the results of on-going primaries at the present time. CNN’s initial announcement, for example, that Bernie Sanders beat Hillary Clinton in the New Hampshire primary came when less than half the precincts had reported in their vote totals.

In returning to Feller’s Volume 1, I recommend something like Sholmo Sternberg’s Lecture 8. If you read Feller, you have to be prepared to make little derivations to see the links between formulas. Sternberg cleared up some puzzles for me, which, alas, otherwise might have absorbed hours of my time.

The arc sine law may be significant for social and economic inequality, which perhaps can be considered in another post.

Business Forecasting – Practical Problems and Solutions

Forecasts in business are unavoidable, since decisions must be made for annual budgets and shorter term operational plans, and investments must be made.

And regardless of approach, practical problems arise.

For example, should output from formal algorithms be massaged, so final numbers include judgmental revisions? What about error metrics? Is the mean absolute percent error (MAPE) best, because everybody is familiar with percents? What are plus’es and minus’es of various forecast error metrics? And, organizationally, where should forecasting teams sit – marketing, production, finance, or maybe in a free-standing unit?

The editors of Business Forecasting – Practical Problems and Solutions integrate dozens of selections to focus on these and other practical forecasting questions.

Here are some highlights.

In my experience, many corporate managers, even VP’s and executives, understand surprisingly little about fitting models to data.

So guidelines for reporting results are important.

In “Dos and Don’ts of Forecast Accuracy Measurement: A Tutorial,” Len Tashman advises “distinguish in-sample from out-of-sample accuracy,” calling it “the most basic issue.”

The acid test is how well the forecast model does “out-of-sample.” Holdout samples and cross-validation simulate how the forecast model will perform going forward. “If your average error in-sample is found to be 10%, it is very probable that forecast errors will average substantially more than 10%.” That’s because model parameters are calibrated to the sample over which they are estimated. There is a whole discussion of “over-fitting,” R2, and model complexity hinging on similar issues. Don’t fool yourself. Try to find ways to test your forecast model on out-of-sample data.

The discussion of fitting models when there is “extreme seasonality” broke new ground for me. In retail forecasting, there might be a toy or product that sells only at Christmastime. Demand is highly intermittent. As Udo Sglavo reveals, one solution is “time compression.” Collapse the time series data into two periods – the holiday season and the rest of the year. Then, the on-off characteristics of sales can be more adequately modeled. Clever.

John Mello’s “The Impact of Sales Forecast Game Playing on Supply Chains,” is probably destined to be a kind of classic, since it rolls up a lot of what we have all heard and observed about strategic behavior vis a vis forecasts.

Mello describes stratagems including

  • Enforcing – maintaining a higher forecast than actually anticipated, to keep forecasts in line with goals
  • Filtering – changing forecasts to reflect product on hand for sale
  • Hedging – overestimating sales to garner more product or production capability
  • Sandbagging – underestimating sales to set expectations lower than actually anticipated demand
  • Second-guessing – changing forecasts to reflect instinct or intuition
  • Spinning – manipulating forecasts to get favorable reactions from individuals or departments in the organization
  • Withholding – refusing to share current sales information

I’ve seen “sand-bagging” at work, when the salesforce is allowed to generate the forecasts, setting expectations for future sales lower than should, objectively, be the case. Purely by coincidence, of course, sales quotas are then easier to meet and bonuses easier to achieve.

I’ve always wondered why Gonik’s system, mentioned in an accompanying article by Michael Gilliland on the “Role of the Sales Force in Forecasting,” is not deployed more often. Gonik, in a classic article in the Harvard Business Review, ties sales bonuses jointly to the level of sales that are forecast by the field, and also to how well actual sales match the forecasts that were made. It literally provides incentives for field sales staff to come up with their best, objective estimate of sales in the coming period. (See Sales Forecasts and Incentives)

Finally, Larry Lapide’s “Where Should the Forecasting Function Reside?” asks a really good question.

The following graphic (apologies for the scan reproduction) summarizes some of his key points.

TTable

There is no fixed answer, Lapide provides a list of things to consider for each organization.

This book is a good accompaniment for Rob Hyndman and George Athanasopoulos’s online Forecasting: Principles and Practice.

Texas Manufacturing Shows Steep Declines

The Dallas Federal Reserve Bank highlights the impact of continuing declines in oil prices in their latest monthly Texas Manufacturing Outlook Survey:

Texas factory activity fell sharply in January, according to business executives responding to the Texas Manufacturing Outlook Survey. The production index—a key measure of state manufacturing conditions—dropped 23 points, from 12.7 to -10.2, suggesting output declined this month after growing throughout fourth quarter 2015.

Other indexes of current manufacturing activity also indicated contraction in January. The survey’s demand measures—the new orders index and the growth rate of orders index—led the falloff in production with negative readings last month, and these indexes pushed further negative in January. The new orders index edged down to -9.2, and the growth rate of orders index fell to -17.5, its lowest level in a year. The capacity utilization index fell 15 points from 8.1 to -7, and the shipments index also posted a double-digit decline into negative territory, coming in at -11.

Perceptions of broader business conditions weakened markedly in January. The general business activity and company outlook indexes fell to their lowest readings since April 2009, when Texas was in recession. The general business activity index fell 13 points to -34.6, and the company outlook index slipped to -19.5.

Here is a chart showing the Texas monthly manufacturing index.

TexasManuIndex

The logical follow-on question is raised by James Hamilton – Can lower oil prices cause a recession?

Hamilton cites an NBER (National Bureau of Economic Research) paper – Geographic Dispersion of Economic Shocks: Evidence from the Fracking Revolution – which estimates jobs from fracking (hydraulic fracturing of oil deposits) resulted in more than 700,000 US jobs 2008-2009, resulting in an 0.5 percent decrease in the unemployment rate during that dire time.

Obviously, the whole thing works in reverse, too.

Eight states with a high concentration of energy-related jobs – including Texas and North Dakota – have experienced major impacts in terms of employment and tax revenues. See “Plunging oil prices: a boost for the U.S. economy, a jolt for Texas”.

Another question is how long can US-based producers hold out financially, as the price of crude continues to spiral down? See Half of U.S. Fracking Industry Could Go Bankrupt as Oil Prices Continue to Fall.

I’ve seen some talk that problems in the oil patch may play a role analogous to sub-prime mortgages during the last economic contraction.

In terms of geopolitics, there is evidence the Saudi’s, who dominate OPEC, triggered the price decline by refusing to limit production from their fields.

Is the Economy Moving Toward Recession?

Generally, a recession occurs when real, or inflation-adjusted Gross Domestic Product (GDP) shows negative growth for at least two consecutive quarters. But GDP estimates are available only at a lag, so it’s possible for a recession to be underway without confirmation from the national statistics.

Bottom line – go to the US Bureau of Economics Analysis website, click on the “National” tab, and you can get the latest official GDP estimates. Today, (January 25, 2016) this box announces “3rd Quarter 2015 GDP,” and we must wait until January 29th for “advance numbers” on the fourth quarter 2015 – numbers to be revised perhaps twice in two later monthly releases.

This means higher frequency data must be deployed for real-time information about GDP growth. And while there are many places with whole bunches of charts, what we really want is systematic analysis, or nowcasting.

A couple of initiatives at nowcasting US real GDP show that, as of December 2015, a recession is not underway, although the indications are growth is below trend and may be slowing.

This information comes from research departments of the US Federal Reserve Bank – the Chicago Fed National Activity Index (CFNAI) and the Federal Reserve Bank of Atlanta GDPNow model.

CFNAI

The Chicago Fed National Activity Index (CFNAI) for December 2015, released January 22nd, shows an improvement over November. The CFNAI moved –0.22 in December, up from –0.36 in November, and, in the big picture (see below) this number does not signal recession.

FREDCFNAI

The index is a weighted average of 85 existing monthly indicators of national economic activity from four general categories – production and income; employment, unemployment, and hours; personal consumption and housing; and sales, orders, and inventories.

It’s built – with Big Data techniques, incidentally- to have an average value of zero and a standard deviation of one.

Since economic activity trends up over time, generally, the zero for the CFNAI actually indicates growth above trend, while a negative index indicates growth below trend.

Recession levels are lower than the December 2015 number – probably starting around -0.7.

GDPNow Model

The GDPNow Model is developed at the Federal Reserve bank of Atlanta.

On January 20, the GDPNow site announced,

The GDPNow model forecast for real GDP growth (seasonally adjusted annual rate) in the fourth quarter of 2015 is 0.7 percent on January 20, up from 0.6 percent on January 15. The forecasts for fourth quarter real consumer spending growth and real residential investment growth each increased slightly after this morning’s Consumer Price Index release from the U.S. Bureau of Labor Statistics and the report on new residential construction from the U.S. Census Bureau.

The chart accompanying this accouncement shows a somewhat less sanguine possibility – namely that consensus estimates and the output of the GDPNow model have been on a downward trend if you look at things back to September 2015.

GDPNow

Superforecasting – The Art and Science of Prediction

Philip Tetlock’s recent Superforecasting says, basically, some people do better at forecasting than others and, furthermore, networking higher performing forecasters, providing access to pooled data, can produce impressive results.

This is a change from Tetlock’s first study – Expert Political Judgment – which lasted about twenty years, concluding, famously, ‘the average expert was roughly as accurate as a dart-throwing chimpanzee.”

Tetlock’s recent research comes out of a tournament sponsored by the Intelligence Advanced Research Projects Activity (IARPA). This forecasting competition fits with the mission of IARPA, which is to improve assessments by the “intelligence community,” or IC. The IC is a generic label, according to Tetlock, for “the Central Intelligence Agency, the National Security Agency, the Defense Intelligence Agency, and thirteen other agencies.”

It is relevant that the IC is surmised (exact figures are classified) to have “a budget of more than $50 billion .. [and employ] one hundred thousand people.”

Thus, “Think how shocking it would be to the intelligence professionals who have spent their lives forecasting geopolical events – to be beaten by a few hundred ordinary people and some simple algorithms.”

Of course, Tetlock reports, this actually happened – “Thanks to IARPA, we now know a few hundred ordinary people and some simple math can not only compete with professionals supported by multibillion-dollar apparatus but also beat them.”

IARPA’s motivation, apparently, traces back to the “weapons of mass destruction (WMD)” uproar surrounding the Iraq war –

“After invading in 2003, the United States turned Iraq upside down looking for WMD’s but found nothing. It was one of the worst – arguable the worst – intelligence failure in modern history. The IC was humiliated. There were condemnations in the media, official investigations, and the familiar ritual of intelligence officials sitting in hearings ..”

So the IC needs improved methods, including utilizing “the wisdom of crowds” and practices of Tetlock’s “superforecaster” teams.

Unlike the famous M-competitions, the IARPA tournament collates subjective assessments of geopolitical risk, such as “will there be a fatal confrontation between vessels in the South China Sea” or “Will either the French or Swiss inquiries find elevated levels of polonium in the remains of Yasser Arafat’s body?”

Tetlock’s book is entertaining and thought-provoking, but many in business will page directly to the Appendix – Ten Commandments for Aspiring Superforecasters.

    1. Triage – focus on questions which are in the “Goldilocks” zone where effort pays off the most.
    2. Break seemingly intractable problems into tractable sub-problems. Tetlock really explicates this recommendation with his discussion of “Fermi-izing” questions such as “how many piano tuners there are in Chicago?.” The reference here, of course, is to Enrico Fermi, the nuclear physicist.
    3. Strike the right balance between inside and outside views. The outside view, as I understand it, is essentially “the big picture.” If you are trying to understand the likelihood of a terrorist attack, how many terrorist attacks have occurred in similar locations in the past ten years? Then, the inside view includes facts about this particular time and place that help adjust quantitative risk estimates.
    4. Strike the right balance between under- and overreacting to evidence. The problem with a precept like this is that turning it around makes it definitely false. Nobody would suggest “do not strike the right balance between under- and overreacting to evidence.” I guess keep the weight of evidence in mind.
    5. Look for clashing causal forces at work in each problem. This reminds me of one of my models of predicting real world developments – tracing out “threads” or causal pathways. When several “threads” or chains of events and developments converge, possibility can develop into likelihood. You have to be a “fox” (rather than a hedgehog) to do this effectively – being open to diverse perspectives on what drives people and how things happen.
    6. Strive to distinguish as many degrees of doubt as the problem permits but no more. Another precept that could be cast as a truism, but the reference is to an interesting discussion in the book about how the IC now brings quantitative probability estimates to the table, when developments – such as where Osama bin Laden lives – come under discussion.
    7. Strike the right balance between under- and overconfidence, between prudence and decisiveness. I really don’t see the particular value of this guideline, except to focus on whether you are being overconfident or indecisive. Give it some thought?
    8. Look for the errors behind your mistakes but beware of rearview-mirror hindsight biases. I had an intellectual mentor who served in the Marines and who was fond of saying, “we are always fighting the last war.” In this regard, I’m fond of the saying, “the only certain thing about the future is that there will be surprises.”
    9. Bring out the best in others and let others bring out the best in you. Tetlock’s following sentence is more to the point – “master the fine art of team management.”
  • Master the error-balancing cycle. Good to think about managing this, too.

Puckishly, Tetlocks adds an 11th Commandment – don’t treat commandments as commandments.

Great topic – forecasting subjective geopolitical developments in teams. Superforecasting touches on some fairly subtle points, illustrated with examples. I think it is well worth having on the bookshelf.

There are some corkers, too, like when Tetlock’s highlights the recommendations of 2nd Century physician to Roman emperors Galen, the medical authority for more than 1000 years.

Galen once wrote, apparently,

“All who drink of this treatment recover in a short time, except those whom it does not help, who all die…It is obvious, therefore, that it fails only in incurable cases.”

The Interest Rate Conundrum

It’s time to invoke the parable of the fox and the hedgehog. You know – the hedgehog knows one thing, sees the world through the lens of a single commanding idea, while the fox knows many things, entertains diverse, even conflicting points of view.

This is apropos of my reaction to David Stockman’s The Fed’s Painted Itself Into The Most Dangerous Corner In History—–Why There Will Soon Be A Riot In The Casino.

Stockman, former Director of Office of Management and Budget under President Ronald Reagan who later launched into a volatile career in high finance (See https://en.wikipedia.org/wiki/David_Stockman) currently lends his name to and writes for a spicy website called Contra Corner.

Stockman’s “Why There Will Soon Be a Riot in The Casino” pivots on an Op Ed by Lawrence Summers (Preparing for the next recession) as well as the following somewhat incredible chart, apparently developed from IMF data by Contra Corner researchers.

WEOchart

The storyline is that planetary production fell in current dollar terms in 2015. This isn’t because physical output or hours in service dropped, but because of the precipitous drop in commodity prices and the general pattern of deflation.

All this is apropos of the Fed’s coming decision to raise the federal funds rate from the zero bound (really from about 0.25 percent).

The logic is unassailable. As Summers (former US Treasury Secretary, former President of Harvard, and Professor of Economics at Harvard) writes –

U.S. and international experience suggests that once a recovery is mature, the odds that it will end within two years are about half and that it will end in less than three years are over two-thirds. Because normal growth is now below 2 percent rather than near 3 percent, as has been the case historically, the risk may even be greater now. While the risk of recession may seem remote given recent growth, it bears emphasizing that since World War II, no postwar recession has been predicted a year in advance by the Fed, the White House or the consensus forecast.

But

Historical experience suggests that when recession comes it is necessary to cut interest rates by more than 300 basis points. I agree with the market that the Fed likely will not be able to raise rates by 100 basis points a year without threatening to undermine the recovery. But even if this were possible, the chances are very high that recession will come before there is room to cut rates by enough to offset it. The knowledge that this is the case must surely reduce confidence and inhibit demand.

So let me rephrase this, to underline the points.

  1. Every business recovery has a finite length
  2. The current business recovery has gone on longer than most and probably will end within two or three years
  3. The US Federal Reserve, therefore, has a limited time in which to restore the federal funds rate to something like its historically “normal” levels
  4. But this means a rapid acceleration of interest rates over the next two to three years, something which almost inevitably will speed the onset of a business downturn and which could have alarming global implications
  5. Thus, the Fed probably will not be able to restore the federal funds rate – actually the only rate they directly control – to historically normal values
  6. Therefore, Fed tools to combat the next recession will be severely constrained.
  7. Given these facts and suppositions, secondary speculative/financial and other responses can arise which themselves can become major developments to deal with.

Header pic of fox and hedgehog from willpowered.co.

Federal Reserve Plans to Raise Interest Rates

It is widely expected the US Federal Reserve Bank will raise the federal funds rate from its seven-year low below 0.25 percent to maybe 0.50 percent. Then, further increases will bring this key short term rate back in line with its historic profile gradually, depending on the health of the US economy and international factors.

This will probably occur next week at the meeting of the Federal Open Market Committee (FOMC), December 15-16.

Here’s a chart from the excellent St. Louis Federal Reserve data site (FRED) showing how unusual recent years are in terms of this key interest rate.

FedFundsRate2

Shading in the chart indicates periods of recession.

Thus, the federal funds rate – which is the rate charged on overnight loans to banking members of the Federal Reserve system – was pushed to the zero bound as a response to the financial crisis and recession 2008-2009.

A December increase has been discussed by prominent members of the Federal Open Market Committee and, of course, in Janet Yellen’s testimony before the US Congress, December 3.

Yet discussion still considers the balance between ‘doves’ and ‘hawks’ on the FOMC. Next year, apparently, FOMC membership may shift toward more ‘hawks’ in voting positions – bankers who see inflation risks from the current recovery. See, for example, Richard Grossman’s Birdwatching at the Federal Reserve.

How far will interest rates rise? One way to address this is by considering the Fed funds futures contract. Currently, the CME futures data indicate a rise to 1.73% over the next 36 months.

All this seems long overdue, based on historical interest rate levels, but that does not stop some alarmist talk.

BIS Warns The Fed Rate Hike May Unleash The Biggest Dollar Margin Call In History

As a result, our only question for the upcoming Fed rate hike is how long it will take before the Fed, shortly after increasing rates by a modest 25 bps to “prove” to itself if not so much anyone else that the US economy is fine, will be forced to mainline trillions of dollars around the globe via swap lines for the second time in a row as the world experiences the biggest USD margin call in history.

By the end of next week or probably just after the first of 2016, interest rates may move a little from the zero bound, and from then on, one fulcrum of all business and economic forecasts will be the pace of further increases.

Fractal Markets, Fractional Integration, and Long Memory in Financial Time Series – I

The concepts – ‘fractal market hypothesis,’ ‘fractional integration of time series,’ and ‘long memory and persistence in time series’ – are related in terms of their proponents and history.

I’m going to put up ideas, videos, observations, and analysis relating to these concepts over the next several posts, since, more and more, I think they lead to really fundamental things, which, possibly, have not yet been fully explicated.

And there are all sorts of clear connections with practical business and financial forecasting – for example, if macroeconomic or financial time series have “long memory,” why isn’t this characteristic being exploited in applied forecasting contexts?

And, since it is Friday, here are a couple of relevant videos to start the ball rolling.

Benoit Mandelbrot, maverick mathematician and discoverer of ‘fractals,’ stands at the crossroads in the 1970’s, contributing or suggesting many of the concepts still being intensively researched.

In economics, business, and finance, the self-similarity at all scales idea is trimmed in various ways, since none of the relevant time series are infinitely divisible.

A lot of energy has gone into following Mandelbrot suggestions on the estimation of Hurst exponents for stock market returns.

This YouTube by a Parallax Financial in Redmond, WA gives you a good flavor of how Hurst exponents are being used in technical analysis. Later, I will put up materials on the econometrics involved.

Blog posts are a really good way to get into this material, by the way. There is a kind of formalism – such as all the stuff in time series about backward shift operators and conventional Box-Jenkins – which is necessary to get into the discussion. And the analytics are by no means standardized yet.

An Update on Bitcoin

Fairly hum-drum days of articles on testing for unit roots in time series led to discovery of an extraordinary new forecasting approach – using the future to predict the present.

Since virtually the only empirical application of the new technique is predicting bubbles in Bitcoin values, I include some of the recent news about Bitcoins at the end of the post.

Noncausal Autoregressive Models

I think you have to describe the forecasting approach recently considered by Lanne and Saikkonen, as well as Hencic, Gouriéroux and others, as “exciting,” even “sexy” in a Saturday Night Live sort of way.

Here is a brief description from a 2015 article in the Econometrics of Risk called Noncausal Autoregressive Model in Application to Bitcoin/USD Exchange Rates

noncausal

I’ve always been a little behind the curve on lag operators, but basically Ψ(L-1) is a function of the standard lagged operators, while Φ(L) is a second function of offsets to future time periods.

To give an example, consider,

yt = k1yt-1+s1yt+1 + et

where subscripts t indicate time period.

In other words, the current value of the variable y is related to its immediately past value, and also to its future value, with an error term e being included.

This is what I mean by the future being used to predict the present.

Ordinarily in forecasting, one would consider such models rather fruitless. After all, you are trying to forecast y for period t+1, so how can you include this variable in the drivers for the forecasting setup?

But the surprising thing is that it is possible to estimate a relationship like this on historic data, and then take the estimated parameters and develop simulations which lead to predictions at the event horizon, of, say, the next period’s value of y.

This is explained in the paragraph following the one cited above –

noncausal2

In other words, because et in equation (1) can have infinite variance, it is definitely not normally distributed, or distributed according to a Gaussian probability distribution.

This is fascinating, since many financial time series are associated with nonGaussian error generating processes – distributions with fat tails that often are platykurtotic.

I recommend the Hencic and Gouriéroux article as a good read, as well as interesting analytics.

The authors proposed that a stationary time series is overlaid by explosive speculative periods, and that something can be abstracted in common from the structure of these speculative excesses.

Mt. Gox, of course, mentioned in this article, was raided in 2013 by Japanese authorities, after losses of more than $465 million from Bitcoin holders.

Now, two years later, the financial industry is showing increasing interest in the underlying Bitcoin technology and Bitcoin prices are on the rise once again.

bitcoin

Anyway, the bottom line is that I really, really like a forecast methodology based on recognition that data come from nonGaussian processes, and am intrigued by the fact that the ability to forecast with noncausal AR models depends on the error process being nonGaussian.

Coming Attractions

Well, I have been doing a deep dive into financial modeling, but I want to get back to blogging more often. It gets in your blood, and really helps explore complex ideas.

So- one coming attraction here is going to be deeper discussion of the fractal market hypothesis.

Ladislav Kristoufek writes in a fascinating analysis (Fractal Markets Hypothesis and the Global Financial Crisis:Scaling, Investment Horizons and Liquidity) that,

“..it is known that capital markets comprise of various investors with very different investment horizons { from algorithmically-based market makers with the investment horizon of fractions of a second, through noise traders with the horizon of several minutes, technical traders with the horizons of days and weeks, and fundamental analysts with the monthly horizons to pension funds with the horizons of several years. For each of these groups, the information has different value and is treated variously. Moreover, each group has its own trading rules and strategies, while for one group the information can mean severe losses, for the other, it can be taken a profitable opportunity.”

The mathematician and discoverer of fractals Mandelbrot and investor Peters started the ball rolling, but the idea maybe seemed like a fad of the 1980’s and 1990s.

But, more and more,  new work in this area (as well as my personal research) points to the fact that the fractal market hypothesis is vitally important.

Forget chaos theory, but do notice the power laws.

The latest  fractal market research is rich in mathematics – especially wavelets, which figure in forecasting, but which I have not spent much time discussing here.

There is some beautiful stuff produced in connection with wavelet analysis.

For example, here is a construction from a wavelet analysis of the NASDAQ from another paper by Kristoufek

Wavlet1

The idea is that around 2008, for example, investing horizons collapsed, with long term traders exiting and trading becoming more and more short term. This is associated with problems of liquidity – a concept in the fractal market hypothesis, but almost completely absent from many versions of the so-called “efficient market hypothesis.”

Now, maybe like some physicists, I am open to the discovery of deep keys to phenomena which open doors of interpretation across broad areas of life.

Another coming attraction will be further discussion of forward information on turning points in markets and the business cycle generally.

The current economic expansion is growing long in tooth, pushing towards the upper historically observed lengths of business expansions in the United States.

The basic facts are there for anyone to notice, and almost sound like a litany of complaints about how the last crisis in 2008-2009 was mishandled. But China is decelerating, and the emerging economies do not seem positioned to make up the global growth gap, as in 2008-2009. Interest rates still bounce along the zero bound. With signs of deteriorating markets and employment conditions, the Fed may never find the right time to raise short term rates – or if they plunge ahead will garner virulent outcry. Financial institutions are even larger and more concentrated now than before 2008, so “too big to fail” can be a future theme again.

What is the best panel of financial and macroeconomic data to watch the developments in the business cycle now?

So those are a couple of topics to be discussed in posts here in the future.

And, of course, politics, including geopolitics will probably intervene at various points.

Initially, I started this blog to explore issues I encountered in real-time business forecasting.

But I have wide-ranging interests – being more of a fox than a hedgehog in terms of Nate Silver’s intellectual classification.

I’m a hybrid in terms of my skill set. I’m seriously interested in mathematics and things mathematical. I maybe have a knack for picking through long mathematical arguments to grab the key points. I had a moment of apparent prodigy late in my undergrad college career, when I took graduate math courses and got straight A’s and even A+ scores on final exams and the like.

Mathematics is time consuming, and I’ve broadened my interests into economics and global developments, working around 2002-2005 partly in China.

As a trivia note,  my parents were immigrants to the US from Great Britain , where their families were in some respects connected to the British Empire that more or less vanished after World War II and, in my father’s case, to the Bank of England. But I grew up in what is known as “the West” (Colorado, not California, interestingly), where I became a sort of British cowboy and subsequently, hopefully, have continued to mature in terms of attitudes and understanding.

Sales and new product forecasting in data-limited (real world) contexts