Tag Archives: US macroeconomic forecasts

Global and US Economic Outlook – November 2014

There are a number of free, publically available macroeconomic forecast resources which have standing and a long track record.

Also, investment and other banks make partial releases of their macro projections.

IMF World Economic Outlook

The International Monetary Fund (IMF) revises its World Economic Outlook (WEO) toward the end of each year, this year in October with Legacies, Clouds, Uncertainties.

One advantage is comprehensive coverage. So there are WEO projections over 1, 2 and 3 year horizons for more than 100 countries, even obscure island principalities, and for dozens of variables, including GDP variously measured, inflation, imports and exports, unemployment rate, and population.

Here are highlights of the October revision (click to enlarge).

WEO14

Largely due to weaker-than-expected global activity in the first half of 2014, the growth forecast for the world economy has been revised downward to 3.3 percent for this year, 0.4 percentage point lower than in the April 2014 World Economic Outlook (WEO). The global growth projection for 2015 was lowered to 3.8 percent.

The global recovery continues to be uneven, with some countries and areas struggling, while others move forward into growth.

Downside risks are increasing and include –

SHORT TERM: worsening geopolitical tensions (Ukraine, Syria) and reversal of recent risk spread and volatility compression in financial markets

MEDIUM TERM: stagnation and low potential growth in advanced economies (Eurozone flirting with deflation) and a decline in potential growth in emerging markets

Organization of Economic Cooperation and Development (OECD) Projections

The OECD Economic Outlook Advance Release for the G-20 from October 2014 projects the following growth rates for 2014 and 2015 (click to enlarge).

OECDgraphic

For total global GDP growth, the OECD projects 3.3 percent for 2014 and 3.7 percent for 2015 or 0.1 percent less for 2015 than the IMF.

Chinese economic growth is ratcheting down from double-digit levels several years ago, to around 7 percent, while Indian GDP growth is projected to stay in the 6 percent range.

There are significant differences in the IMF and OECD forecasts for the United States.

Survey of Professional Forecasters

The Survey of Professional Forecasters (SPF) is another publically available set of macroeconomic forecasts, but focusing on the US economy. The SPF is maintained by the Philadelphia Federal Reserve Bank, which polls participating analysts quarterly, compiling consensus results, spreads, and distributions.

The latest SPF Survey was released August 2014, and is somewhat more optimistic about US economic growth than the IMF and OECD projections.

SPF3rdQ14

Investment Bank Data and Projections

Wells Fargo Securities Economics Group produces a monthly report with detailed quarterly forecasts for the US economy. Here is a sample from August 2014 (click to enlarge).

WFforecast

I’m compiling a list of these products and their availability.

The bottom line is there are plenty of forecasts to average together to gin up high likelihood numbers to plug into sales and other business forecast models.

At the same time, there is a problem with calling turning points in almost all these products.

This is not a problem on YouTube now, though. If you search “economic forecasts 2015” on YouTube today, you will see a lengthly list of predictions of economic collapse and market catastrophe by the likes of Jim Rogers, Gerald Calente, and others who dabble in this genre.

We need something like the canary in the coal mine.

Oil and Gas Prices – a “Golden Swan”?

Crude oil prices plummeted last week, moving toward $80/Bbl for West Texas Intermediate (WTI) – the spot pricing standard commodity.

CrudeOilSpotPrice

OPEC – the Organization of Petroleum Exporting Counties – is a key to trajectory of oil prices, accounting for about 40 percent of global oil output.

Media reports that the Saudi Arabian Kingdom, which is the largest producer in OPEC, is advising that it will not cut oil production at the current time. The US Energy Information Agency (EIA) has a graph on its website underlining the importance of Saudi production to global oil prices.

Saudiproductionoilprice

Officially, there is very little in the media to pin down the current Saudi policy, although, off-the-record, Saudi representatives apparently have indicated they could allow crude prices to drift between $80 and $90 a barrel for a couple of years. This could impact higher cost producers, such as Iran and burgeoning North American shale oil production.

At the same time, several OPEC members, such as Venezuela and Libya, have called for cuts in output to manage crude prices going forward. And a field jointly maintained by Saudi Arabia and Kuwait just has been shut down, ostensibly for environmental upgrades.

OPEC’s upcoming November 27 meeting in Vienna, Austria should be momentous.

US Oil Production

Currently, US oil production is running at 8.7 million barrels a day, a million barrels a day higher than in a comparable period of 2013, and the highest level since 1986.

The question of the hour is whether US production can continue to increase with significantly lower oil prices.

Many analysts echo the New York Times, which recently compared throttling back US petroleum activity to slowing a freight train.

Most companies make their investment decisions well in advance and need months to slow exploration because of contracts with service companies. And if they do decide to cut back some drilling, they will pick the least prospective fields first as they continue developing the richest prospects.

At the same time, the most recent data suggest US rig activity is starting to slip.

Economic Drivers

It’s all too easy to engage in arm-waving, when discussing energy supplies and prices and their relationship to the global economy.

Of course, we have supply and demand, as one basis. Supplies have been increasing, in part because of new technologies in US production and Libyan production coming back on line.

Demands have not been increasing, on the other hand, as rapidly as in the past. This reflects slowing growth in China and continuing energy conservation.

One imponderable is the influence of speculators on oil prices. Was there a “bubble” before 2009, for example, and could speculators drive oil prices significantly lower in coming months?

Another factor that is hard to assess is whether 2015 will see a recession in major parts of the global economy.

The US Federal Reserve has been planning on eliminating Quantitative Easing (QE) – its program of long-term bond purchases – and increasing the federal funds rate from its present level of virtually zero. Many believe that these actions will materially slow US and global economic growth. Coupled with the current deflationary environment in Europe, there have been increasing signs that factors could converge to trigger a recession sometime in 2015.

However, low energy prices usually are not part of the prelude for a recession, although they can develop after the recession takes hold.

Instead, prices at the pump in the US could fall below $3.00 a gallon, providing several hundred dollars extra in discretionary income over the course of a year. This, just prior to the Christmas shopping season.

So – if US oil production continues to increase and prices at the pump fall below $3.00, there will be jobs and cheap gas, a combination likely to forstall a downturn, at least in the US for the time being.

Top image courtesy of GameDocs

The Holy Grail of Business Forecasting – Forecasting the Next Downturn

What if you could predict the Chicago Fed National Activity Index (CFNAI), interpolated monthly values of the growth of nominal GDP, the Aruoba-Diebold-Scotti (ADS) Business Conditions Index, and the Kansas City Financial Stress Index (KCFSI) three, five, seven, even twelve months into the future? What if your model also predicted turning points in these US indexes, and also similar macroeconomic variables for countries in Asia and the European Union? And what if you could do all this with data on monthly returns on the stock prices of companies in the financial sector?

That’s the claim of Linda Allen, Turan Bali, and Yi Tang in a fascinating 2012 paper Does Systemic Risk in the Financial Sector Predict Future Economic Downturns?

I’m going to refer to these authors as Bali et al, since it appears that Turan Bali, shown below, did some of the ground-breaking research on estimating parametric distributions of extreme losses. Bali also is the corresponding author.

T_bali

Bali et al develop a new macroindex of systemic risk that predicts future real economic downturns which they call CATFIN.

CATFIN is estimated using both value-at-risk (VaR) and expected shortfall (ES) methodologies, each of which are estimated using three approaches: one nonparametric and two different parametric specifications. All data used to construct the CATFIN measure are available at each point in time (monthly, in our analysis), and we utilize an out-of-sample forecasting methodology. We find that all versions of CATFIN are predictive of future real economic downturns as measured by gross domestic product (GDP), industrial production, the unemployment rate, and an index of eighty-five existing monthly economic indicators (the Chicago Fed National Activity Index, CFNAI), as well as other measures of real macroeconomic activity (e.g., NBER recession periods and the Aruoba-Diebold-Scott [ADS] business conditions index maintained by the Philadelphia Fed). Consistent with an extensive body of literature linking the real and financial sectors of the economy, we find that CATFIN forecasts aggregate bank lending activity.

The following graphic illustrates three components of CATFIN and the simple arithmetic average, compared with US recession periods.

CATFIN

Thoughts on the Method

OK, here’s the simple explanation. First, these researchers identify US financial companies based on definitions in Kenneth French’s site at the Tuck School of Business (Dartmouth). There are apparently 500-1000 of these companies for the period 1973-2009. Then, for each month in this period, rates of return of the stock prices of these companies are calculated. Then, three methods are used to estimate 1% value at risk (VaR) – two parametric methods and one nonparametric methods. The nonparametric method is straight-forward –

The nonparametric approach to estimating VaR is based on analysis of the left tail of the empirical return distribution conducted without imposing any restrictions on the moments of the underlying density…. Assuming that we have 900 financial firms in month t , the nonparametric measure of1%VaR is the ninth lowest observation in the cross-section of excess returns. For each month, we determine the one percentile of the cross-section of excess returns on financial firms and obtain an aggregate 1% VaR measure of the financial system for the period 1973–2009.

So far, so good. This gives us the data for the graphic shown above.

In order to make this predictive, the authors write that –

CATFINEQ

Like a lot of leading indicators, the CATFIN predictive setup “over-predicts” to some extent. Thus, there are there are five instances in which a spike in CATFIN is not followed by a recession, thereby providing a false positive signal of future real economic distress. However, the authors note that in many of these cases, predicted macroeconomic declines may have been averted by prompt policy intervention. Their discussion of this is very interesting, and plausible.

What This Means

The implications of this research are fairly profound – indicating, above all, the priority of the finance sector in leading the overall economy today. Certainly, this consistent with the balance sheet recession of 2008-2009, and probably will continue to be relevant going forward – since nothing really has changed and more concentration of ownership in finance has followed 2008-2009.

I do think that Serena Ng’s basic point in a recent review article probably is relevant – that not all recessions are the same. So it may be that this method would not work as well for, say, the period 1945-1970, before financialization of the US and global economies.

The incredibly ornate mathematics of modeling the tails of return distributions are relevant in this context, incidentally, since the nonparametric approach of looking at the empirical distributions month-by-month could be suspect because of “cherry-picking.” So some companies could be included, others excluded to make the numbers come out. This is much difficult in a complex maximum likelihood estimation process for the location parameters of these obscure distributions.

So the question on everybody’s mind is – WHAT DOES THE CATFIN MODEL INDICATE NOW ABOUT THE NEXT FEW MONTHS? Unfortunately, I am unable to answer that, although I have corresponded with some of the authors to inquire whether any research along such lines can be cited.

Bottom line – very impressive research and another example of how important science can get lost in the dance of prestige and names.

Calling the Next Recession – The Need for New Policy Responses

Yesterday I saw a headline on Reuters,

U.S. retail sales pause, seen rebounding in months ahead

with a story that made the best out of a recent stall in US consumer spending, especially for cars.

I also noticed –

Japan’s Economy Contracts Sharply

Real gross domestic product, the total value of all goods and services produced in the economy, shrank 6.8% in the three months through June on an annualized basis from the prior quarter

In Europe, the economic tea leaves suggest a developing recession in Italy, negative growth in Germany, and stasis in France, as highlighted in this Wall Street Journal graphic.

EUprospects

Mish Shedlock, furthermore, is all over the bizarre new data coming out of China on bank loans in the standard and shadow banking systems.

New Yuan Loans and Shadow Banking Collapse in China; Record Bank Deposit Slump

All this after the 1st Quarter surprise drop in US real GDP of -2.7 percent, quarter-over-quarter.

A Note on How I Forecast the Global Economy

So my experience is with enterprise level IT companies with markets in the major global economic regions – Europe, Japan, China, the US and the ROW (rest of the world).

The idea is to keep tabs on regional developments to predict sales and, in some respects, to mix and match resources to the most promising markets.

After you do this for a while, it’s obvious there are interdependencies between these markets, in particular trade interdependencies.

Europe provides a large market for Chinese products – a market which has flagged in recent years with prolonged economic troubles in peripheral EU zone areas. The United States also provides China important markets for its goods.

Japan, as one of the largest economies in the world, is in the mix here too.

Bottom line – if all the major global economic regions (except South America?) are flagging, a synchronized global recession is increasingly likely.

What the Problem Is

This is sort of a “plain-vanilla” forecast, and might be fine-tuned with quantitative models – although none of these is especially accurate on a global scale.

But the deeper issue and problem has to do with the US Federal Reserve and many other central banks. And the failure to follow standard fiscal policy measures during the last economic downturn.

A new recession in the United States in 2014 or 2015 would find the US Federal Reserve Bank with no policy tools. The federal funds rate, the overnight rate directly controlled by the Fed, currently is virtually zero. The bond-buying program known as “quantitative easing (QE)” is scheduled to end in October, which means it is still running. The Fed balance sheet already includes more than $4 trillion in liabilities, more than 75 percent of which were incurred fighting the last recession.

That leaves fiscal policy as the only real response to a new recession.

However, the prospects for Congress to step up to the bat in the next two years do not look good.

Barry Ritholtz highlights the problem with Congress in a recent Bloomberg column – Naming the Biggest Losers in America.

The drag from federal government usually is a simple and obvious fix. During a recession and recovery, spending should rise and the Fed should make credit less expensive.

Except in this cycle. Before you start telling me about beliefs and ideology and the deficit, all one needs to do is compare federal spending during the 2001 recession cycle, with a Republican controlling the White House and a split Congress, to the present cycle. Apparently, the importance of reducing deficits and having a smaller government only applies when the GOP doesn’t control the White House.

Look also at state and local government, another huge drag on the economy. Block grants to the states could have helped to pay for police, emergency workers, teachers, road and bridge maintenance as they have in past recessions. But they weren’t, for partisan political reasons. The nation is worse off for it.

Business equipment investment and other forms of capital expenditures have been jump started with an accelerated depreciation tax allowances in past recessions. For some reason, this was allowed to lapse in 2013. This wasn’t very smart; if anything, they should have been extended and made more aggressive.

The biggest drag of all has been the persistent weakness in residential real estate. The recent increases in home prices are the result of record-low mortgage rates and limited inventory, not an economic recovery. As we noted in “The Best Housing Program You’ve Never Heard Of,” there were some attempts to ameliorate this, but they amounted to too little too late.

The bottom line is that as a nation, and mainly because of Congress, we haven’t risen to the challenges we face. There has been little intelligence, no creativity, negligible cooperation, and an epic failure of civic responsibility.

Amen.

Reflections

All this highlights for me that we need to face facts on US Federal Reserve policy, which currently is stuck at the zero lower bound for the federal funds rate and is still buying long term bonds.

The next recession is likely to hit before the Fed “normalizes” interest rates and its QE programs.

Also, the character of the US Congress is unlikely to convert en masse to Keynesian economics in the next two years.

This means, in turn, that unorthodox measures to stimulate the US and global economy will be necessary.

What are they?

The Next Recession – Will It Be A Global Meltdown?

One my focuses is the global economy and any cracks in the firmament which might presage the next recession. I rely a lot on my Twitter account to keep me on the crest of the wave, in this regard.

I’m really concerned, as are many of my colleagues and contacts in business and government.

We’ve hardly escaped the effects of last recession 2008-2009. Those are US dates, of course, set by the National Bureau of Economic Research (NBER) the official recession “dater” in this country.

There have been a series of rolling impacts and consequences of this so-called “Great Recession.”

Europe

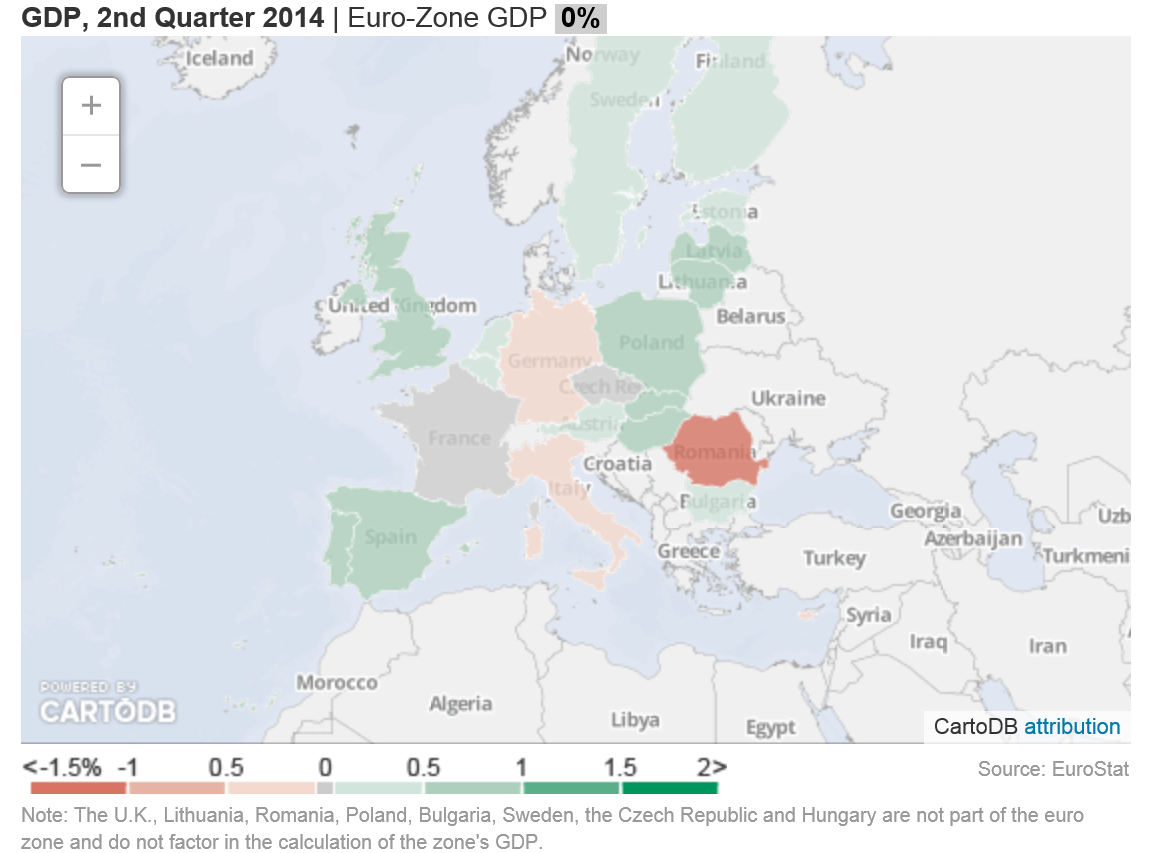
Housing or real estate bubbles were present in Europe, too, particularly in Spain and Ireland. Then, there was the problem of the Greek economy and state, which did not support the level of public debt that had been garnered by, in some cases, corrupt public officials. And European problems were complicated by the currency union of the euro in a context where there is not, as yet, a centralized EU state. Anyway, not to reprise the whole matter blow-by-blow, but most of Europe, with the exception of Germany, plunged into recession and struggled with austerity policies that made things worse for Main Street or, as they like to say in Britain, “High Street.”

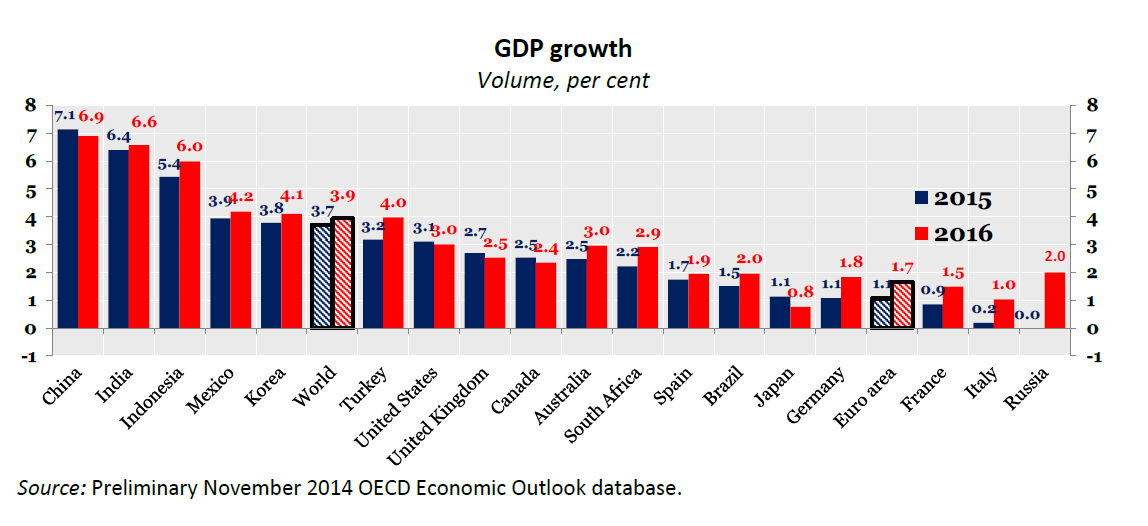
Many European countries are just now coming out of recession, and overall, the growth rate in the EU area is almost indistinguishable from zero.

So another recession in the next one to two years would really set them back.

China

Part of the problem China has been experiencing is related to the persisting downturn in most of Europe, since Europe is a big trading partner. And so, for that matter is the United States, which bought less from China during the recession years.

But another problem is that China now is experiencing a mojo big property bubble of its own.

Newly wealthy Chinese do not really have any place to put their money, except real estate. The Chinese, like the Japanese, are big savers, and for many middle class families, buying the second apartment or even a house is an investment for the future. Yet Chinese real estate prices have skyrocketed, leaving the average Chinese wage earner in the dust, with less and less hope of ever owning a residence.

Apparently, in connection with this real estate speculation, a large shadow banking system has emerged. Some estimates circulate on Twitter suggesting this rivals the size of the official Chinese banking system.

Can “market socialism” or “market Leninism” experience a financial crisis, based on too many debts that cannot be paid?

I’ve been to China a few times, and done some business there – all the while trying to understand how things are set up. My feeling is that one should not impute banking practices that seem pro forma in, say, Great Britain or the US, to the Chinese. I think they are much more ready to “break the rules” in order to keep the party going (which is sort of a pun).

Having said that, I do think a Chinese crisis could develop if property values collapse, as they are wont to do in bubble mode.

Again, it’s hard to say how this might play out, since the victims and suffering would be among the nouveau riche of China, of whom there are millions, and many more average families who have invested their nest egg in a hot property.

But I can’t think that collapse of real estate values in modern China would not have worldwide repurcussions.

The Rest of the World

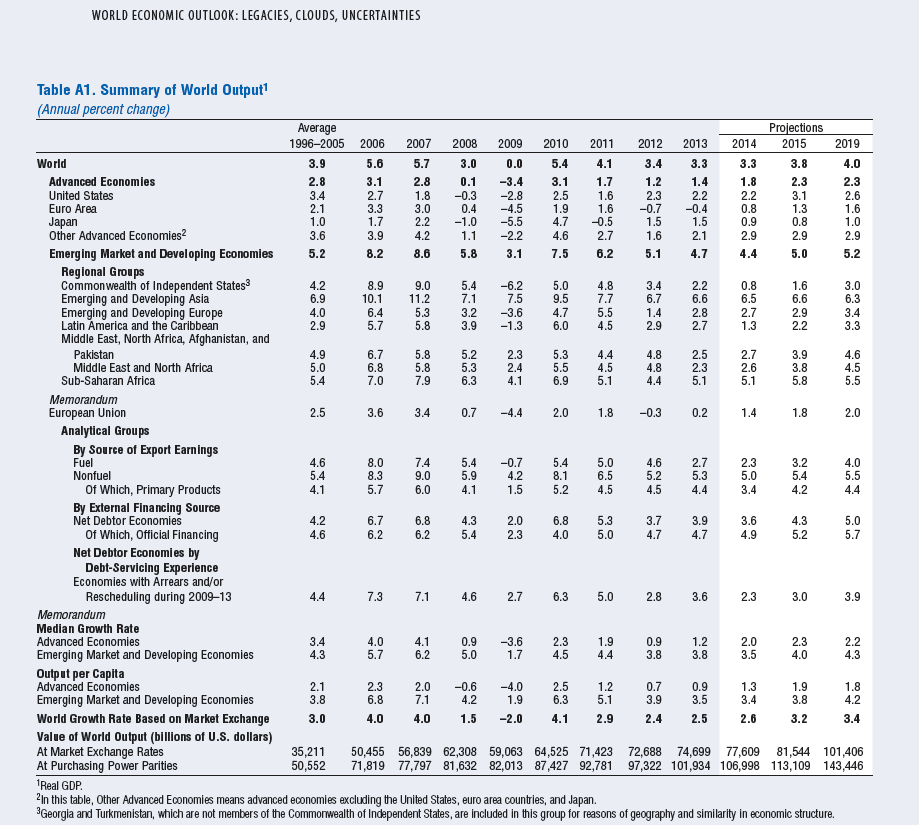
Regrettably, I cannot go through other major regions, one-by-one, but I’d have to say that things are not so good. The BRIC’s as a group all have more problems than a few years back, when they were hailed as the bright new centers of economic growth by that Goldman Sachs analyst. That’s Brazil, Russia, India, and China, of course.

Possibilities of Increased Conflict

There is a kind of axiom of geopolitics and social interaction that when the pie is growing and everybody can get more, even though their slice may not have been very big to begin with, there is a tendency for people to make do, go about their business and so forth. Reverse this and you have the concept that shrinking the pie – as austerity policies and the Great Recession have done – tends to increase levels of conflict. At first, to the extent that people have the idea that “we are all in this together” there may be increased cooperation. But that is not the current situation in almost any society. Quite the contrary, as Piketty and the Occupy Movement highlight, there is growing awareness of inequality of wealth and income.

There are armed conflicts in Syria, the Ukraine, Afghanistan (resurgent Taliban), and areas and regions in Africa. The Indian elections recently installed a Hindu nationalist who hopefully will be a reformer, but may, if the going gets tough, revert or acquiesce to more conflict with Pakistan and with non-Hindu populations within India. Pakistan, one of the world’s nuclear powers, appears to be extremely unstable politically. There are deep civil divisions in Thailand between city and rural areas that parallel class divisions. China is flexing its muscles in the South China Sea.

And we may be moving from an era of US-centric global capitalism to a time when the Eurasian supercontinent will become significantly more important and perhaps decoupled from Wall Street and the City of London. Already, there are threats to dollar supremacy, and, historically, as US economic power is eclipsed by the more rapidly growing economies of Asia, some adjustment seems predictable.

In all this, Hollywood can be counted on to roll out some really corking new international intrigue films, perhaps (although I doubt it) with more complex plots.

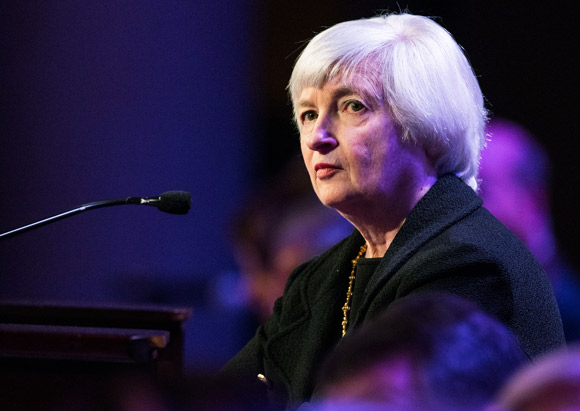
The Situation with the US Federal Reserve Bank

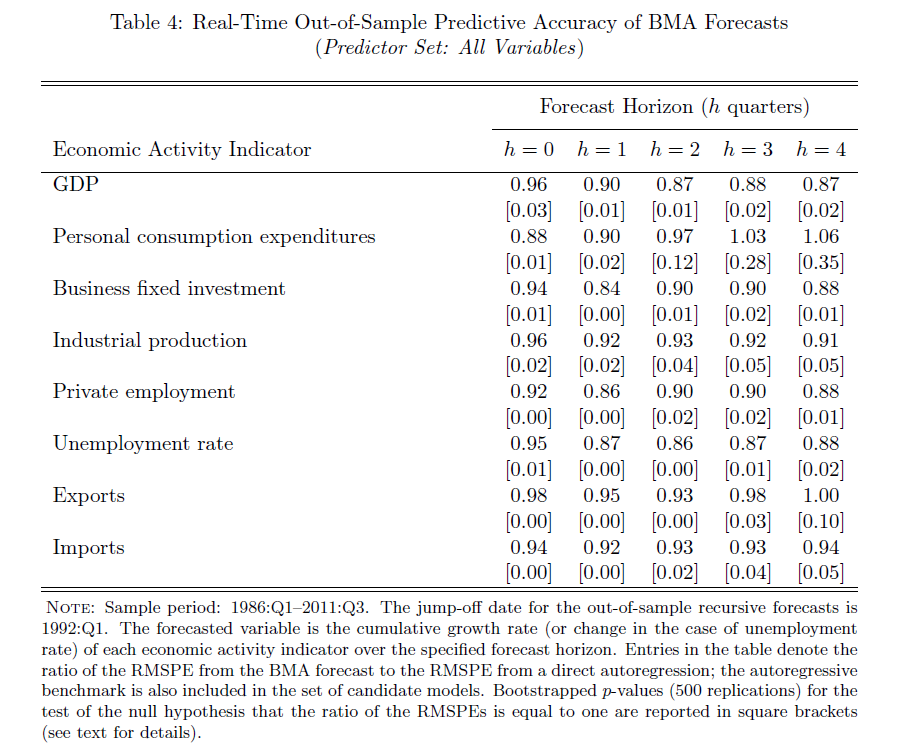
The point of this international survey and reprise of recent business history is to highlight areas where surprises may originate, shaking the markets, and perhaps triggering the next recession.

But the most likely suspect is the US Federal Reserve Bank.

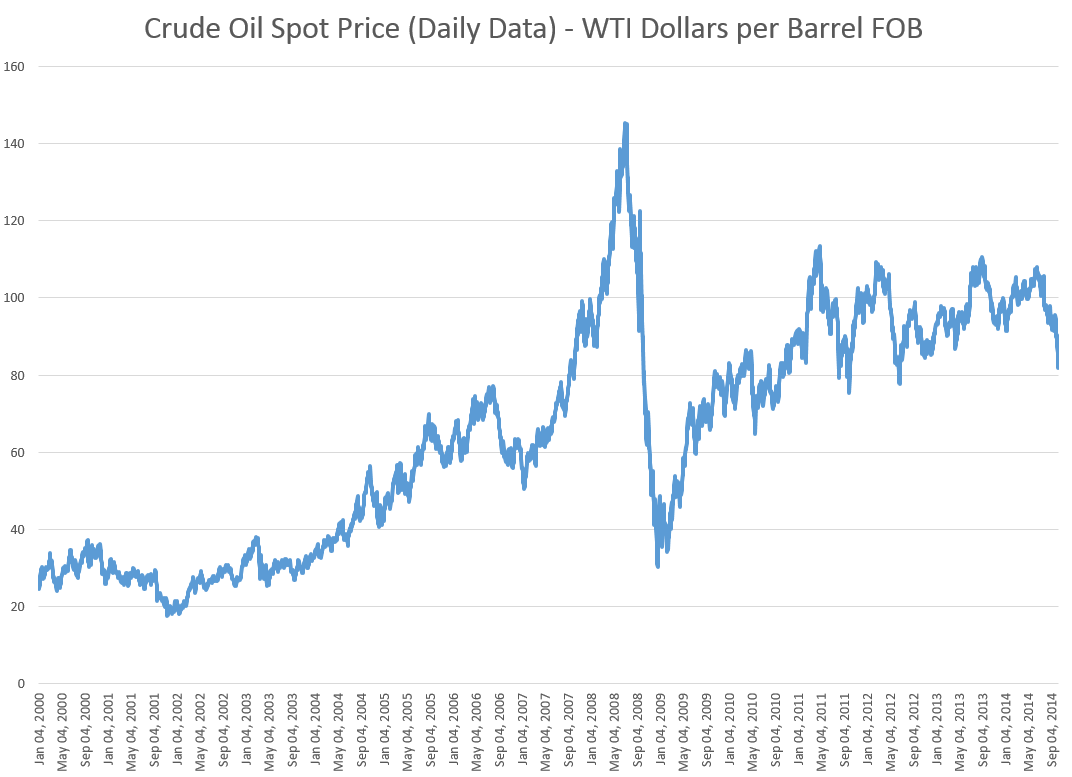
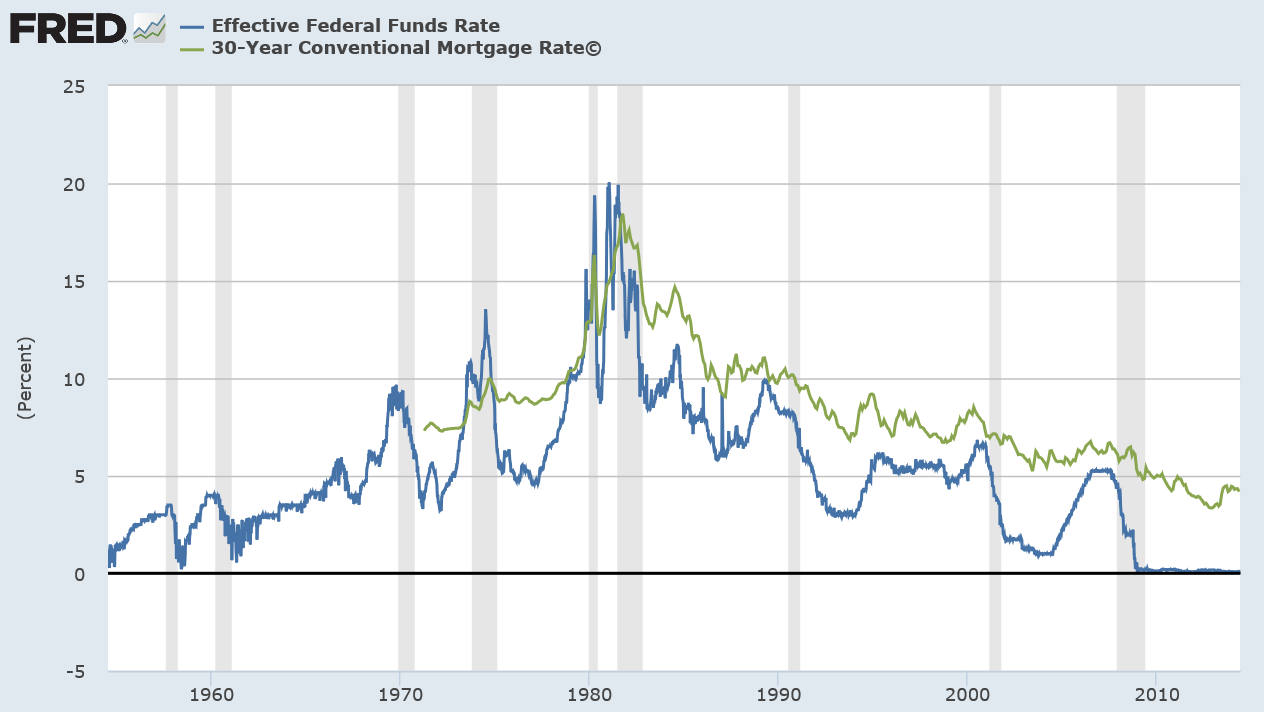
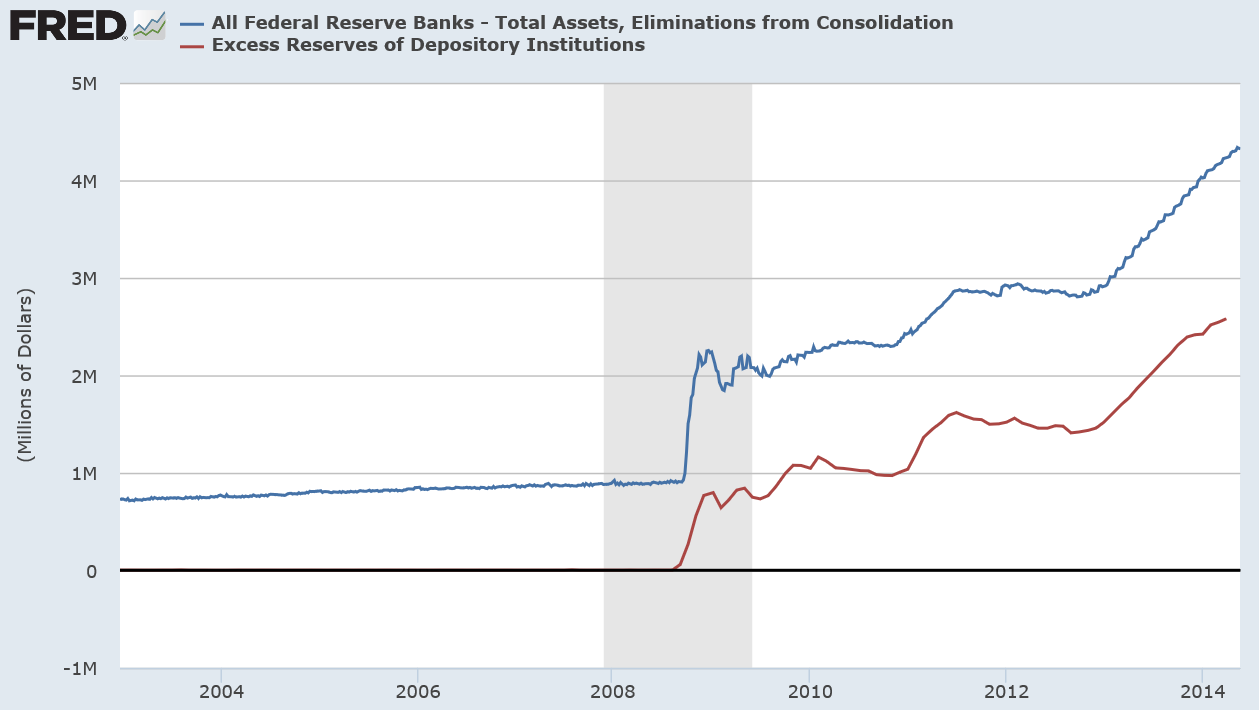
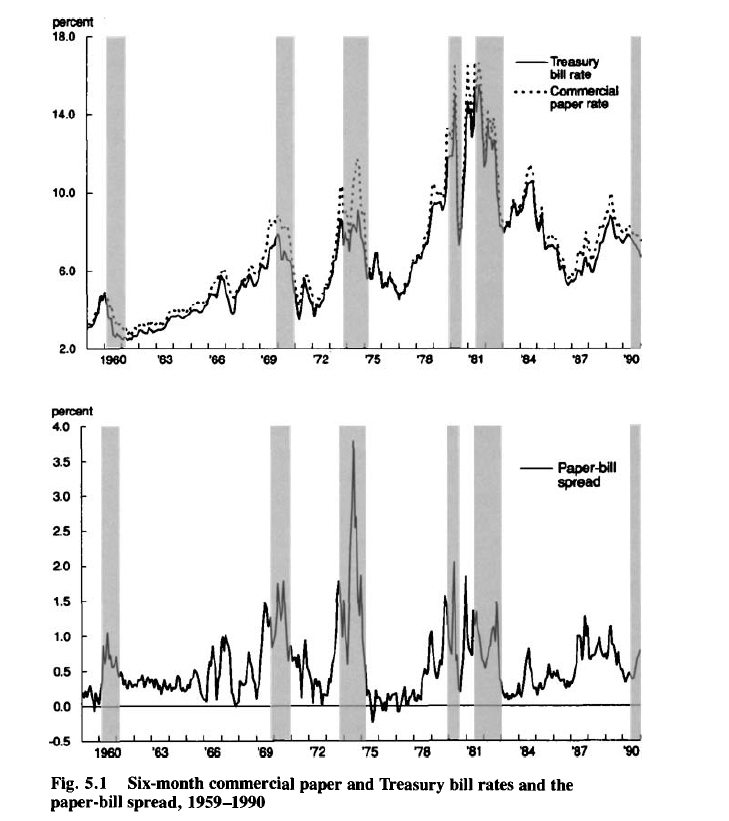
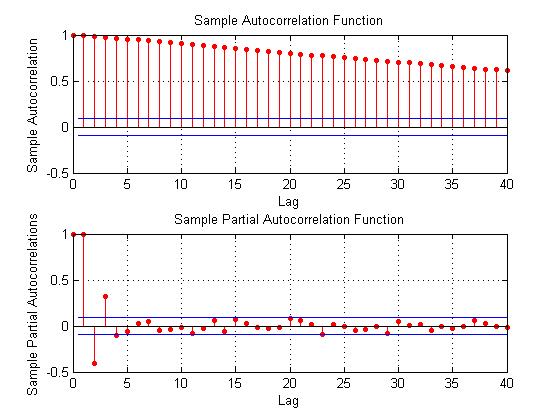
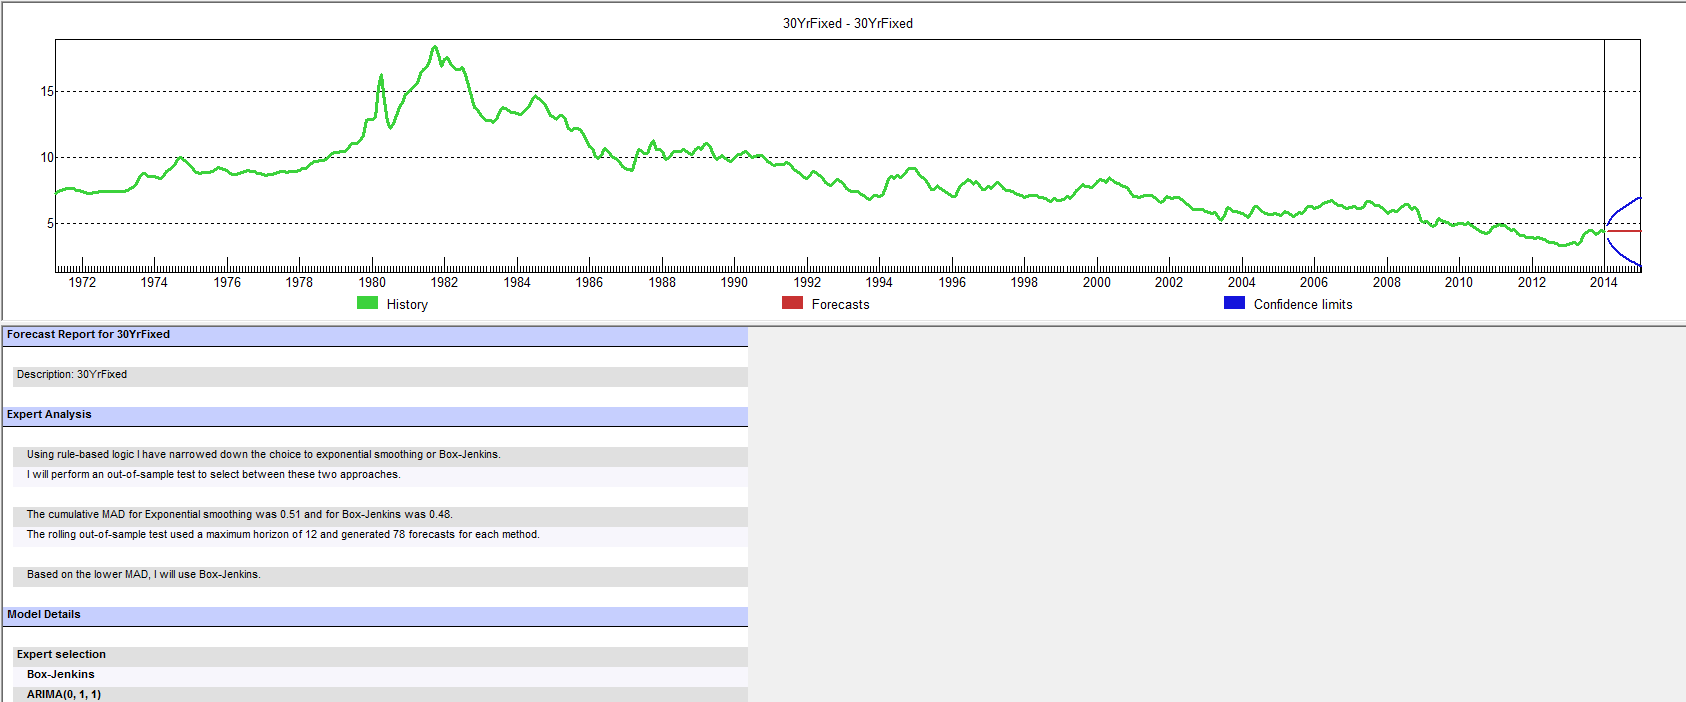
Two graphs speak volumes.

interestratesnew

Fedassets

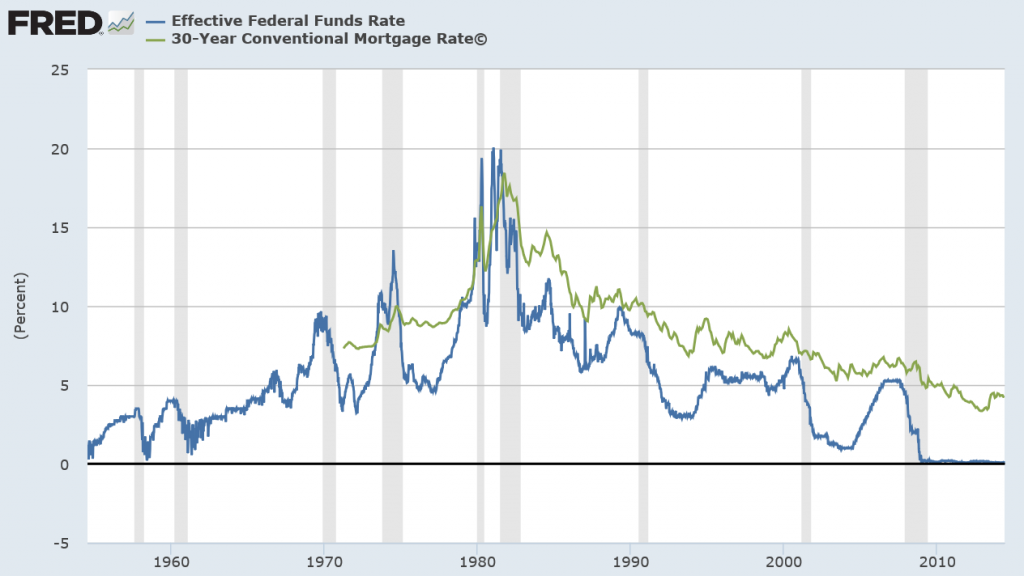
Seeking to encourage economic recovery, the US Federal Reserve dropped the federal funds rate to a number effectively almost zero – a historically low number. This zero bound federal funds rate has persisted since the end of 2009, or for about five years.

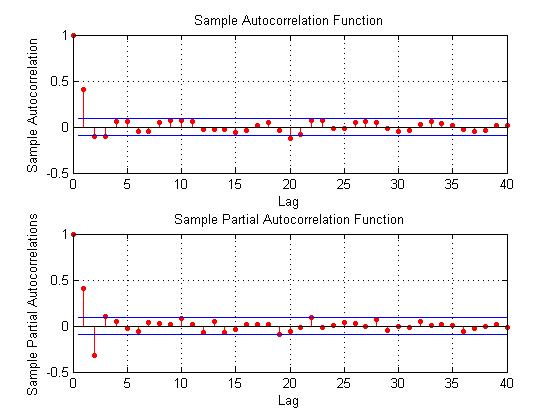
The Fed also has engaged in new policies, whereby it goes into private bond markets and buys long term bonds – primarily mortgage-backed securities. The second chart tracks this inasmuch as a good portion of the more than 4 trillion in Fed assets (for which there are corresponding liabilities, of course) are these mortgage-backed securities. In effect, the Fed has purchased a sizeable portion of the US housing market – one might say “nationalize” except that would be forgetting the fact that the Fed is actually a private institution whose governance is appointed by the Executive Branch of the US government.

In any case, this bond-buying is the famous “quantitative easing” (QE) and is mirrored in the accumulation of excess reserves by the banking system. Generally, that is, banks and financial institutions issue mortgages, sell them among themselves to be packaged in mortgage-backed securities, and the Fed has been buying these.

Banks can easily loan these excess reserves, but they consistently have not. Why is an interesting question beyond the scope of this discussion, but the consequence is that the Fed’s actions are “firewalled” from increasing the rate of inflation, which is what ordinarily you might think would occur given that various metrics of money supply also have surged upward.

Now “Fed-watching” is its own little cottage industry among financial commentators, and I am not going to second-guess the media here. The Fed has announced a plan to “taper” these purchases of long term bonds. This is likely to increase the mortgage rates and, probably to some extent, based on expectations already has.

So, the long and the short of it are that this set of policies – zero federal funds rate and bond buying cannot go on forever.

If economic growth has been low-grade since 2010 with these low interest rates, what is the reasonable outlook for a higher interest rate regime?

Timing of the Next Recession

When is the most likely time for a recession, for example? Would it be later in 2014, in 2015, or thereafter, maybe in 2016.

Here is a table of all the recessions in the US since the middle 1850’s along with facts about their duration (source: NBER).

NBERRecess

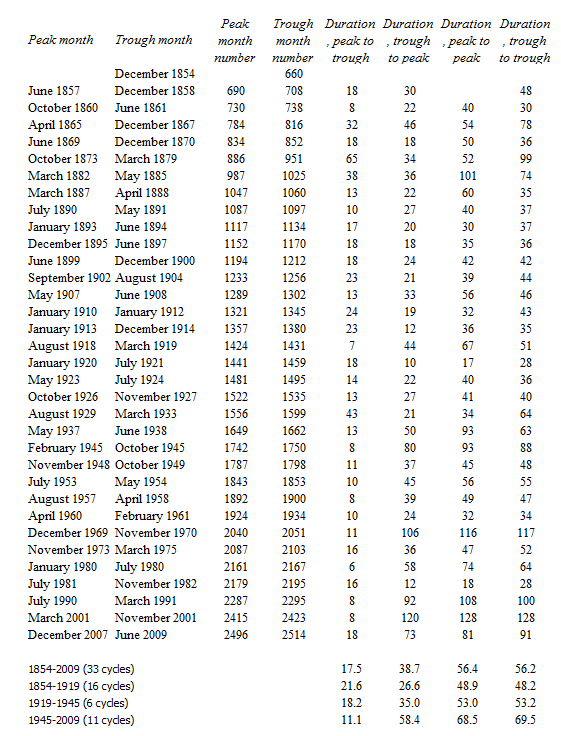
Without even considering averages, the maximum period of trough to trough – that is, from the bottom of one recession to the bottom of the next – has been 128 months or ten years and eight months. Here, incidentally, the month numbers begin January 1800, for what that’s worth.

Thus, at the outside, based on these empirics, the trough of the next recession is likely to occur no later than early 2020.

Note that we have already blown through the average length from trough to trough of about 58.4 months or about five years from June 2009.

On a simple probabilistic basis, therefore, we are moving into the tail of the distribution of business cycle durations, suggesting that the chances of a downturn are in some sense already above 50 percent.

And note that the experience of the current business recovery is nothing like this historically maximum span in the 1990’s between the trough of the recession of 1990-1991 and the trough of November 2001.

This business recovery persistently seems to move ahead just above or, in the last quarter of 2013, below “stall speed.”

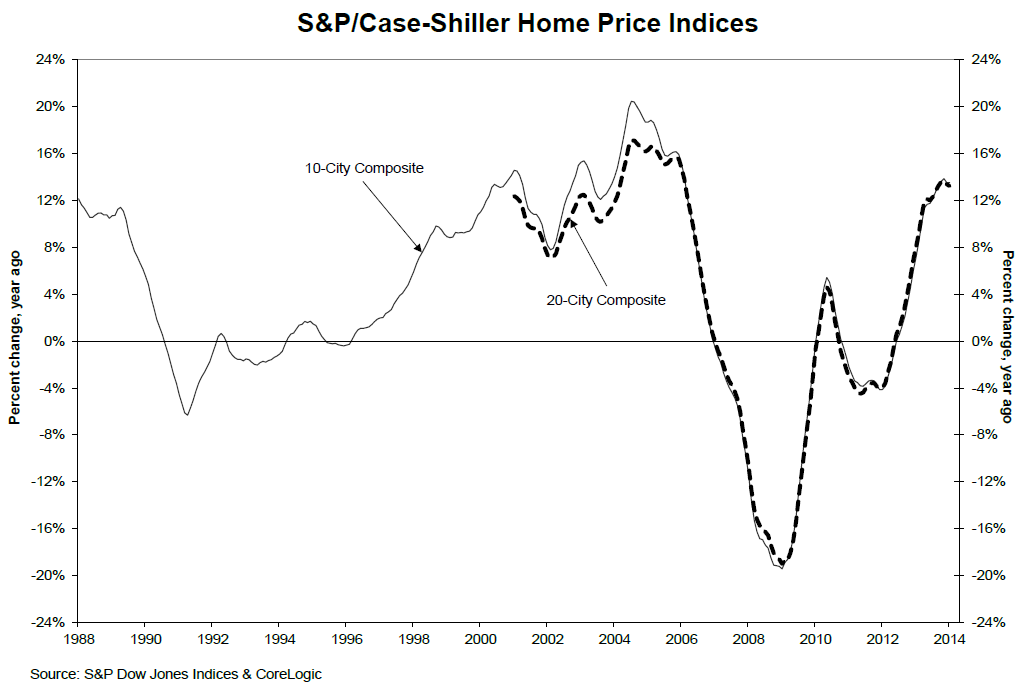
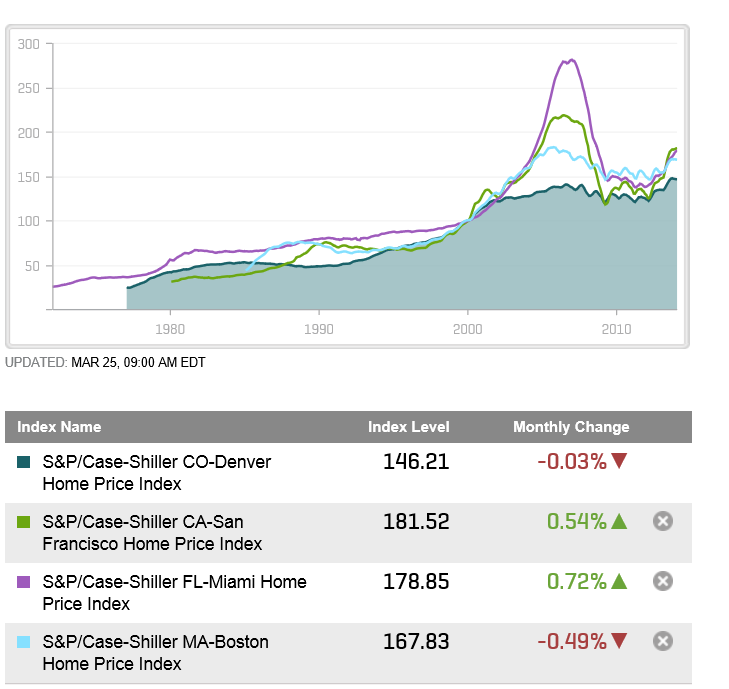
Seemingly, a fairly minor perturbation could set off a chain reaction, given the advanced frothiness in the stock market and softness in housing prices.

More of the Same, Worse

Neil Baroifsky was special inspector with oversight authority for the TARP during the bailout phase of the Great Recession, and currently is a partner in the Litigation Department of national law firm Jenner & Block LLP.

He’s also an author and often is called on for his opinion about developments in malfeasance writ large among the finance giants – such as the Credit Suisse settlement. In connection with a recent NPR interview, Barofsky said,

Although it is good that we averted a catastrophe back in 2008, the way that we did so I believe has unfortunately set the stage for an even more devastating financial crisis in the future.

HOBSON: In the future? How far?

BAROFSKY: Well, if I knew that, Michael Lewis would be writing his next book about people who made billions on timing the markets perfectly about me, which would be great.

(LAUGHTER)

BAROFSKY: But if you look, a lot of the same broken incentives from 2008 are still there. It’s just a question of when, not if. You can’t look at the fundamental broken incentives in the financial system and really come to a conclusion other than that we’re headed down the same dangerous path that we were that culminated in the explosion of ’08.

Barofsky’s point is readily supported by facts, such as –

The US and global financial system is even more concentrated today than in 2007, making “too big to fail”and even bigger potential problem now, than before the Great Recession. Even Alan Greenspan has taken note.

And the “pass the buck” system, whereby bond rating agencies are paid by the originators to evaluate exotic securities (“financial innovations”) created by the banking and shadow banking industries, securities which are then passed on to pension funds and hapless investors – this system appears to still be completely in place. Talk about the concept of “moral hazard.”

Global Impact

I think you get the picture.

For one reason or another, some fairly minor event is likely to set off a cascade of consequences in US and global financial markets, leading to the next recession. Probably, within one, two, or three years, as a matter of fact. Because the US Fed, and, for that matter, other central banks will still be working their way out of the last recession, there may be fewer “policy tools” to halt the stampede to sell, cutback, and so forth. Governments could respond with aggressive fiscal policy, but that option appears limited unless there are major changes in the political climate in the US and Europe.

Personally, I think wholly new directions of policy should be contemplated at the personal, local, regional, and of course at national levels.

We need to create what I have started to call “islands of stability.” This is the old idea of local self-reliance, but in new packaging. I really think there should be discussions widely across the US at least about how to decouple from the global economy and, indeed, from the financial concentrations on Wall Street. As a matter of self-preservation, until such time as more courageous national policies can be undertaken to reign in such obvious risks.

LInks – late May

US and Global Economic Prospects

Goldman’s Hatzius: Rationale for Economic Acceleration Is Intact

We currently estimate that real GDP fell -0.7% (annualized) in the first quarter, versus a December consensus estimate of +2½%. On the face of it, this is a large disappointment. It raises the question whether 2014 will be yet another year when initially high hopes for growth are ultimately dashed.

 Today we therefore ask whether our forecast that 2014-2015 will show a meaningful pickup in growth relative to the first four years of the recovery is still on track. Our answer, broadly, is yes. Although the weak first quarter is likely to hold down real GDP for 2014 as a whole, the underlying trends in economic activity are still pointing to significant improvement….

 The basic rationale for our acceleration forecast of late 2013 was twofold—(1) an end to the fiscal drag that had weighed on growth so heavily in 2013 and (2) a positive impulse from the private sector following the completion of the balance sheet adjustments specifically among US households. Both of these points remain intact.

Economy and Housing Market Projected to Grow in 2015

Despite many beginning-of-the-year predictions about spring growth in the housing market falling flat, and despite a still chugging economy that changes its mind quarter-to-quarter, economists at the National Association of Realtors and other industry groups expect an uptick in the economy and housing market through next year.

The key to the NAR’s optimism, as expressed by the organization’s chief economist, Lawrence Yun, earlier this week, is a hefty pent-up demand for houses coupled with expectations of job growth—which itself has been more feeble than anticipated. “When you look at the jobs-to-population ratio, the current period is weaker than it was from the late 1990s through 2007,” Yun said. “This explains why Main Street America does not fully feel the recovery.”

Yun’s comments echo those in a report released Thursday by Fitch Ratings and Oxford Analytica that looks at the unusual pattern of recovery the U.S. is facing in the wake of its latest major recession. However, although the U.S. GDP and overall economy have occasionally fluctuated quarter-to-quarter these past few years, Yun said that there are no fresh signs of recession for Q2, which could grow about 3 percent.

Report: San Francisco has worse income inequality than Rwanda

If San Francisco was a country, it would rank as the 20th most unequal nation on Earth, according to the World Bank’s measurements.

Googlebus

Climate Change

When Will Coastal Property Values Crash And Will Climate Science Deniers Be The Only Buyers?

sea

How Much Will It Cost to Solve Climate Change?

Switching from fossil fuels to low-carbon sources of energy will cost $44 trillion between now and 2050, according to a report released this week by the International Energy Agency.

Natural Gas and Fracking

How The Russia-China Gas Deal Hurts U.S. Liquid Natural Gas Industry

This could dampen the demand – and ultimately the price for – LNG from the United States. East Asia represents the most prized market for producers of LNG. That’s because it is home to the top three importers of LNG in the world: Japan, South Korea and China. Together, the three countries account for more than half of LNG demand worldwide. As a result, prices for LNG are as much as four to five times higher in Asia compared to what natural gas is sold for in the United States.

The Russia-China deal may change that.

If LNG prices in Asia come down from their recent highs, the most expensive LNG projects may no longer be profitable. That could force out several of the U.S. LNG projects waiting for U.S. Department of Energy approval. As of April, DOE had approved seven LNG terminals, but many more are waiting for permits.

LNG terminals in the United States will also not be the least expensive producers. The construction of several liquefaction facilities in Australia is way ahead of competitors in the U.S., and the country plans on nearly quadrupling its LNG capacity by 2017. More supplies and lower-than-expected demand from China could bring down prices over the next several years.

Write-down of two-thirds of US shale oil explodes fracking mythThis is big!

Next month, the US Energy Information Administration (EIA) will publish a new estimate of US shale deposits set to deal a death-blow to industry hype about a new golden era of US energy independence by fracking unconventional oil and gas.

EIA officials told the Los Angeles Times that previous estimates of recoverable oil in the Monterey shale reserves in California of about 15.4 billion barrels were vastly overstated. The revised estimate, they said, will slash this amount by 96% to a puny 600 million barrels of oil.

The Monterey formation, previously believed to contain more than double the amount of oil estimated at the Bakken shale in North Dakota, and five times larger than the Eagle Ford shale in South Texas, was slated to add up to 2.8 million jobs by 2020 and boost government tax revenues by $24.6 billion a year.

China

The Annotated History Of The World’s Next Reserve Currency

yuanhistory

Goldman: Prepare for Chinese property bust

…With demand poised to slow given a tepid economic backdrop, weaker household affordability, rising mortgage rates and developer cash flow weakness, we believe current construction capacity of the domestic property industry may be excessive. We estimate an inventory adjustment cycle of two years for developers, driving 10%-15% price cuts in most cities with 15% volume contraction from 2013 levels in 2014E-15E. We also expect M&A activities to take place actively, favoring developers with strong balance sheet and cash flow discipline.

China’s Shadow Banking Sector Valued At 80% of GDP

The China Banking Regulatory Commission has shed light on the country’s opaque shadow banking sector. It was as large as 33 trillion yuan ($5.29 trillion) in mid-2013 and equivalent to 80% of last year’s GDP, according to Yan Qingmin, a vice chairman of the commission.

In a Tuesday WeChat blog sent by the Chong Yang Institute for Financial Studies, Renmin University, Yan wrote that his calculation is based on shadow lending activities from asset management businesses to trust companies, a definition he said was very broad.  Yan said the rapid expansion of the sector, which was equivalent to 53% of GDP in 2012, entailed risks of some parts of the shadow banking business, but not necessarily the Chinese economy.

Yan’s estimation is notably higher than that of the Chinese Academy of Social Sciences. The government think tank said on May 9 that the sector has reached 27 trillion yuan ($4.4 trillion in 2013) and is equivalent to nearly one fifth of the domestic banking sector’s total assets.

Massive, Curvaceous Buildings Designed to Imitate a Mountain Forest

Chinamassive

Information Technology (IT)

I am an IT generalist. Am I doomed to low pay forever? Interesting comments and suggestions to this question on a Forum maintained by The Register.

I’m an IT generalist. I know a bit of everything – I can behave appropriately up to Cxx level both internally and with clients, and I’m happy to crawl under a desk to plug in network cables. I know a little bit about how nearly everything works – enough to fill in the gaps quickly: I didn’t know any C# a year ago, but 2 days into a project using it I could see the offshore guys were writing absolute rubbish. I can talk to DB folks about their DBs; network guys about their switches and wireless networks; programmers about their code and architects about their designs. Don’t get me wrong, I can do as well as talk, programming, design, architecture – but I would never claim to be the equal of a specialist (although some of the work I have seen from the soi-disant specialists makes me wonder whether I’m missing a trick).

My principle skill, if there is one – is problem resolution, from nitty gritty tech details (performance and functionality) to handling tricky internal politics to detoxify projects and get them moving again.

How on earth do I sell this to an employer as a full-timer or contractor? Am I doomed to a low income role whilst the specialists command the big day rates? Or should I give up on IT altogether

Crowdfunding is brutal… even when it works

China bans Windows 8

China has banned government use of Windows 8, Microsoft Corp’s latest operating system, a blow to a US technology company that has long struggled with sales in the country.

The Central Government Procurement Center issued the ban on installing Windows 8 on Chinese government computers as part of a notice on the use of energy-saving products, posted on its website last week.

Data Analytics

Statistics of election irregularities – good forensic data analytics.

Real Estate Forecasts – 1

Nationally, housing prices peaked in 2014, as the following Case-Shiller chart shows.

CS2014

The Case Shiller home price indices have been the gold standard and the focus of many forecasting efforts. A key feature is reliance on the “repeat sales method.” This uses data on properties that have sold at least twice to capture the appreciated value of each specific sales unit, holding quality constant.

The following chart shows Case-Shiller (C-S) house indexes for four MSA’s (metropolitan statistical areas) – Denver, San Francisco, Miami, and Boston.

CScities

The price “bubble” was more dramatic in some cities than others.

Forecasting Housing Prices and Housing Starts

The challenge to predictive modeling is more or less the same – how to account for a curve which initially rises, and then falls (in some cases dramatically), “stabilizes” and begins to climb again, although with increased volatility, again as long term interest rates rise. 

Volatility is a feature of housing starts, also, when compared with growth in households and the housing stock, as highlighted in the following graphic taken from an econometric analysis by San Francisco Federal Reserve analysts.

SandDfactorshousingThe fluctuations in housing starts track with drivers such as employment, energy prices, prices of construction materials, and real mortgage rates, but the short term forecasting models, including variables such as current listings and even Internet search activity, are promising.

Companies operating in this space include CoreLogic, Zillow and Moody’s Analytics. The sweet spot in all these services is to disaggregate housing price forecasts more local levels – the county level, for example.

Finally, in this survey of resources, one of the best housing and real estate blogs is Calculated Risk.

I’d like to post more on these predictive efforts, their statistical rationale, and their performance.

Also, the Federal Reserve “taper” of Quantitative Easing (QE) currently underway is impacting long term interest rates and mortgage rates.

The key question is whether the US housing market can withstand return to “normal” interest rate conditions in the next one to two years, and how that will play out.

Credit Spreads As Predictors of Real-Time Economic Activity

Several distinguished macroeconomic researchers, including Ben Bernanke, highlight the predictive power of the “paper-bill” spread.

The following graphs, from a 1993 article by Benjamin M. Friedman and Kenneth N. Kuttner, show the promise of credit spreads in forecasting recessions – indicated by the shaded blocks in the charts.

CPTBspread

Credit spreads, of course, are the differences in yields between various corporate debt instruments and government securities of comparable maturity.

The classic credit spread illustrated above is the difference between six-month commercial paper rates and 6 month Treasury bill rates.

Recent Research

More recent research underlines the importance of building up credit spreads from metrics relating to individual corporate bonds , rather than a mishmash of bonds with different duration, credit risk and other characteristics.

Credit Spreads as Predictors of Real-Time Economic Activity: A Bayesian Model-Averaging Approach is key research in this regard.

The authors first note that,

the “paper-bill” spread—the difference between yields on nonfinancial commercial paper and comparable-maturity Treasury bills—had substantial forecasting power for economic activity during the 1970s and the 1980s, but its predictive ability vanished in the subsequent decade

They then acknowledge that credit spreads based on indexes of speculative-grade or “junk” corporate bonds work fairly well for the 1990s, but their performance is uneven.

Accordingly, Faust, Gilchrist, Wright, and Zakrajsek (GYZ) write that

In part to address these problems, GYZ constructed 20 monthly credit spread indexes for different maturity and credit risk categories using secondary market prices of individual senior unsecured corporate bonds.. [measuring]..the underlying credit risk by the issuer’s expected default frequency (EDF™), a market-based default-risk indicator calculated by Moody’s/KMV that is more timely that the issuer’s credit rating]

Their findings indicate that these credit spread indexes have substantial predictive power, at both short- and longer-term horizons, for the growth of payroll employment and industrial production. Moreover, they significantly outperform the predictive ability of the standard default-risk indicators, a result that suggests that using “cleaner” measures of credit spreads may, indeed, lead to more accurate forecasts of economic activity.

Their research applies credit spreads constructed from the ground up, as it were, to out-of-sample forecasts of

…real economic activity, as measured by real GDP, real personal consumption expenditures (PCE), real business fixed investment, industrial production, private payroll employment, the civilian unemployment rate, real exports, and real imports over the period from 1986:Q1 to 2011:Q3. All of these series are in quarter-over-quarter growth rates (actually 400 times log first differences), except for the unemployment rate, which is simply in first differences

The results are forecasts which significantly beat univariate (autoregressive) model forecass, as shown in the following table.

Cspreadresults

Here BMA is an abbreviation for Bayesian Model Averaging, the author’s method of incorporating these calculated credit spreads in predictive relationships.

Additional research validates the usefulness of credit spreads so constructed for predicting macroeconomic dynamics in several European economies –

We find that credit spreads and excess bond premiums, when used alongside monetary policy tightness indicators and leading indicators of economic performance, are highly significant for predicting the growth in the index of industrial production, employment growth, the unemployment rate and real GDP growth at horizons ranging from one quarter to two years ahead. These results are confirmed for individual countries in the euroarea and for the United Kingdom, and are robust to different measures of the credit spread. It is the unpredictable part associated with the excess bond premium that has greater influence on real activity compared to the predictable part of the credit spread. The implications of our results are that careful selection of the bonds used to construct the credit spreads, excluding those with embedded options and or illiquid secondary markets, delivers a robust indicator of financial market tightness that is distinct from tightness due to monetary policy measures or leading indicators of economic activity.

The Situation Today

A Morgan Stanley Credit Report for fixed income, released March 21, 2014, notes that

Spreads in both IG and HY are at the lowest levels we have seen since 2007, roughly 110bp for IG and 415bp for HY. A question we are commonly asked is how much tighter can spreads go in this cycle

So this is definitely something to watch. 

Interest Rates – 3

Can interest rates be nonstationary?

This seems like a strange question, since interest rates are bounded, except in circumstances, perhaps, of total economic collapse.

“Standard” nonstationary processes, by contrast, can increase or decrease without limit, as can conventional random walks.

But, be careful. It’s mathematically possible to define and study random walks with reflecting barriers –which, when they reach a maximum or minimum, “bounce” back from the barrier.

This is more than esoteric, since the 30 year fixed mortgage rate monthly averages series discussed in the previous post has a curious property. It can be differenced many times, and yet display first order autocorrelation of the resulting series.

This contrasts with the 10 year fixed maturity Treasury bond rates (also monthly averages). After first differencing this Treasury bond series, the resulting residuals do not show statistically significant first order autocorrelation.

Here a stationary stochastic process is one in which the probability distribution of the outcomes does not shift with time, so the conditional mean and conditional variance are, in the strict case, constant. A classic example is white noise, where each element can be viewed as an independent draw from a Gaussian distribution with zero mean and constant variance.

30 Year Fixed Mortgage Monthly Averages – a Nonstationary Time Series?

Here are some autocorrelation functions (ACF’s) and partial autocorrelation functions (PACF’s) of the 30 year fixed mortgage monthly averages from April 1971 to January 2014, first differences of this series, and second differences of this series – altogether six charts produced by MATLAB’s plot routines.

Data for this and the following series are downloaded from the St. Louis Fed FRED site.

MLmort0

Here the PACF appears to cut off after 4 periods, but maybe not quite, since there are values for lags which touch the statistical significance boundary further out.

MLmort1

This seems more satisfactory, since there is only one major spike in the ACF and 2-3 initial spikes in the PACF. Again, however, values for lags far out on the horizontal axis appear to touch the boundary of statistical significance.

MLmort2

Here are the ACF and PACF’s of the “difference of the first difference” or the second difference, if you like. This spike at period 2 for the ACF and PACF is intriguing, and, for me, difficult to interpret.

The data series includes 514 values, so we are not dealing with a small sample in conventional terms.

I also checked for seasonal variation – either additive or multiplicative seasonal components or factors. After taking steps to remove this type of variation, if it exists, the same pattern of repeated significance of autocorrelations of differences and higher order differences persists.

Forecast Pro, a good business workhorse for automatic forecasting, selects ARIMA(0,1,1) as the optimal forecast model for this 30 year fixed interest mortgage monthly averages. In other words, Forecast Pro glosses over the fact that the residuals from an ARIMA(0,1,1) setup still contain significant autocorrelation.

Here is a sample of the output (click to enlarge)

FP30yr

10 Year Treasury Bonds Constant Maturity

The situation is quite different for 10 year Treasury Bonds monthly averages, where the downloaded series starts April 1953 and, again, ends January 2014.

Here is the ordinary least squares (OLS) regression of the first order autocorrelation.

10yrTreasregHere the R2 or coefficient of determination is much lower than for the 30 year fixed mortgage monthly averages, but the first order lagged rate is highly significant statistically.

On the other hand, the residuals of this regression do not exhibit a high degree of first order autocorrelation, falling below the 80 percent significance level.

What Does This Mean?

The closest I have come to formulating an explanation for this weird difference between these two “interest rates” is the discussion in a paper from 2002 –

On Mean Reversion in Real Interest Rates: An Application of Threshold Cointegration

The authors of this research paper from the Institute for Advanced Studies in Vienna acknowledge findings that some interests rates may be nonstationary, at least over some periods of time. Their solution is a nonlinear time series approach, but they highlight several of the more exotic statistical features of interest rates in passing – such as evidence of non-normal distributions, excess kurtosis, conditional heteroskedasticity, and long memory.

In any case, I wonder whether the 30 year fixed mortgage monthly averages might be suitable for some type of boosting model working on residuals and residuals of residuals.

I’m going to try that later on this Spring.

Top Bloomberg Macro Forecaster Rankings for 2014

Bloomberg compiles global rankings for forecasters of US macro variables, based on their forecasts of a range of key monthly indicators. The rankings are based on performance over two year periods, ending November in the year the rankings are announced.

Here is a summary sheet for the past three years for the top twenty US macroeconomic forecasters or forecasting teams, with their organizational affiliation (click to enlarge).

Top Bloomberg rankings

SOURCES: http://www.christophe-barraud.com/wp-content/uploads/2014/01/Classement-Bloomberg-janvier-20141.pdf, http://www.bloomberg.com/bb/avfile/r5M7ODl4WNms, https://www.economy.com/home/products/samples/2012-01-20-Bloomberg.pdf

The list of top forecasters for the US economy has been fairly stable recently. At least seventeen out of the top twenty forecasters for the US are listed twice; six forecasters or forecasting teams made the top list in all three periods.

Interestingly, European forecasters have recently taken the lead. Bloomberg News notes Number One – Christophe Barraud is only 27 years old, and developed an interest in forecasting, apparently, as a teenager, when he and his dad bet on horses at tracks near Nice, France.

In the most recent ranking, key indicators include CPI, Durable Goods Orders, Existing Home Sales, Housing Starts, IP, ISM Manufacturing, ISM Nonmanufacturing, New Home Sales, Nonfarm Payrolls, Personal Income, Personal Spending, PPI, Retail Sales, Unemployment and GDP. A total of 68 forecasters or forecasting teams qualified for and participated in the ranking exercise.

Bloomberg Markets also announced other regional rankings, shown in this infographic

Bloombergmarkets And as a special treat this Friday, for the collectors among readers, here is the Ben Bernacke commemorative baseball card, developed at the Fed as a going away present.

Bernacke