All posts by Clive Jones

China Update – The Beatings Will Continue Until Morale Improves

It’s essentially illegal to short a stock in China today.

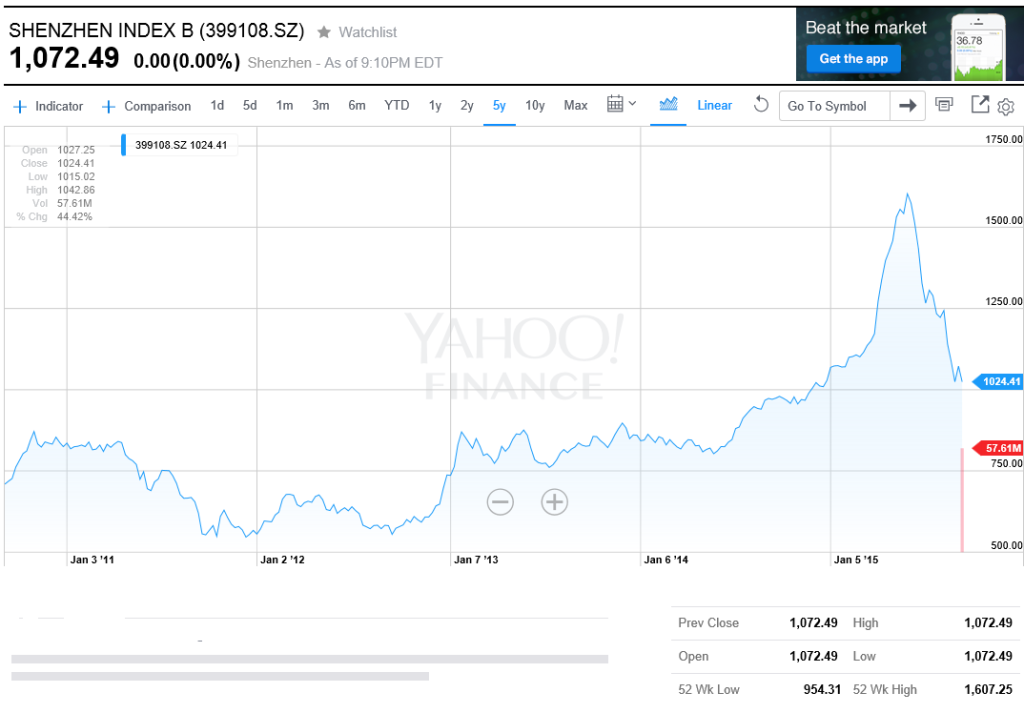
This developed in response to the more than 40  percent drop in market value  of most stocks– as in the chart for Shenzhen Index B shown below.

shenzhen

B shares (Chinese: B股, officially Domestically Listed Foreign Investment Shares) on the Shanghai and Shenzhen stock exchanges refers to those that are traded in foreign currencies. Shares that are traded on the two mainland Chinese stock exchanges in Renminbi, the currency in mainland China, are called A shares.

China Seen Delaying Shenzhen Stock Link Until 2016 Amid Turmoil

Chinese authorities have gone to extreme lengths to prop up the stock market as both the Shanghai Composite Index and the Shenzhen Composite Index lost more than 40 percent from their June highs. They’ve banned major shareholders from selling stakes, armed a state-run margin trader with billions of dollars to buy equities, allowed hundreds of companies to halt their shares and placed curbs on bearish bets in the futures market.

One casualty has been the World’s Biggest Stock-Index Futures Market

Volumes in the country’s CSI 300 Index and CSI 500 Index futures sank to record lows on Wednesday after falling 99 percent from their June highs. Ranked by the World Federation of Exchanges as the most active market for index futures as recently as July, liquidity in China has dried up as authorities raised margin requirements, tightened position limits and started a police probe into bearish wagers.

China’s Response to Stock Plunge Rattles Traders

A business journalist has been detained and shown apologizing on national television for writing an article that could have hurt the market.

Caijin

Apparently, the beatings will continue until morale improves.

The spectacle of Wang Xiaolu, reporter at a Chinese business publication, enacting Monday what authorities called a confession of spreading “panic and disorder” in the stock market through his reporting should scare investors.

The announcement Sunday by China’s Ministry of Public Security that 197 people had been punished for spreading rumors about stocks and other issues should scare investors.

That the head of hedge fund manager Man Group Plc’s China unit has been taken into custody, as reported by Bloomberg on Monday, should scare global investors.

This is not to say that China isn’t capable of browbeating and arm-twisting and public money spending its way to a higher stock market. China asked brokerages to increase their support of a market rescue fund by 100 billion yuan last week, according to reports, a move perhaps tied to a desire for a rally, or at least stability, ahead of Thursday’s parade commemorating victory over Japan…….

They do know that a huge country is scared so badly of something that they will not, cannot, allow things to be said that cause stocks to fall.

Reflections

These strong-arm tactics go beyond anything seen in the West, in terms of damage control. Transparency,  an key feature in financial analysis, has been thrown out the window. With Goons going around bullying people to hold stocks that have lost 40 percent of their value, pressing journalists to keep quiet about problems in the market, it is a strange world in Chinese finance and stocks. People “disappear” – no record of arrest being announced.

There is no question but that Chinese macroeconomic statistics must also be viewed in a more skeptical light.

This makes assessment of the Chinese slowdown more difficult.

One Month Forecast of SPY ETF Price Level – Extreme Value Prediction Algorithm (EVPA)

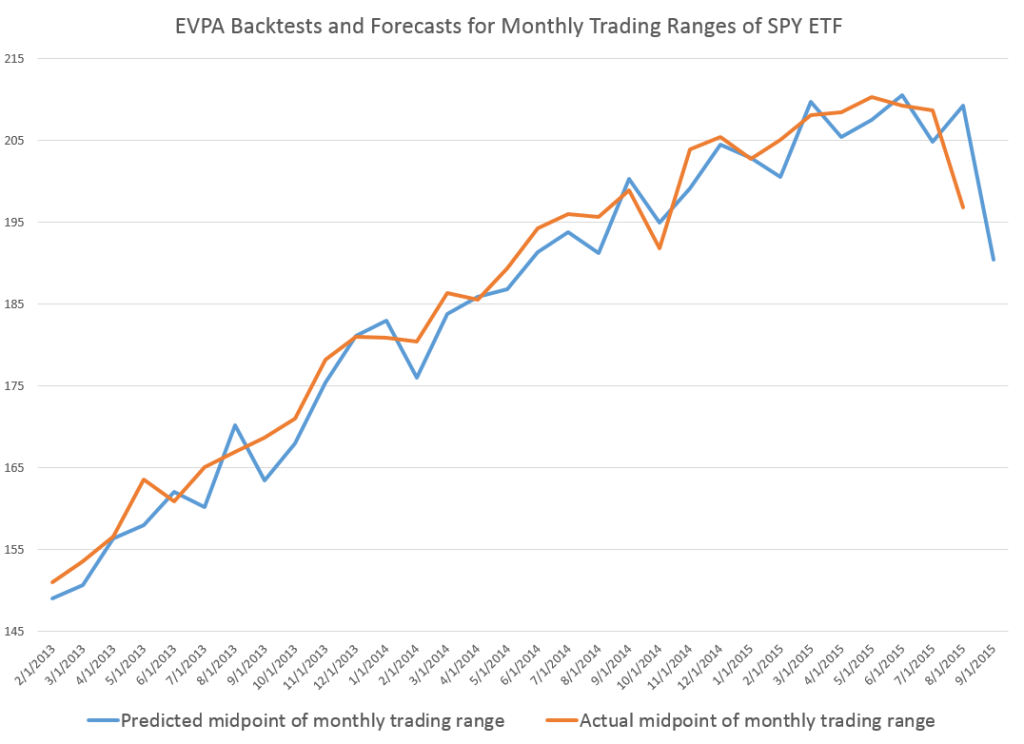
Here is a chart showing backtests and a prediction for the midpoints of the monthly trading ranges of the SPY exchange traded fund.

MonthSPY

The orange line traces out the sequence of actual monthly midpoints of the price range – the average of the high and low price for the month.

The blue line charts the backtests going back to 2013 and a forecast for September 2015 – which is the right-most endpoint of the blue line. The predicted September midpoint is $190.43.

The predictions come from the EVPA, an algorithm backtested to 1994 for the SPY. Since 1994, the forecast accuracy, measured by the MAPE or mean absolute percent error, is 2.4 percent. This significantly improves on a No Change model, one of the alternative forecast benchmarks for this series, and the OOS R2 of the forecast of the midpoint of the monthly trading range is a solid 0.33.

Just from eyeballing the graph above, it seems like there are systematic errors to the downside in the forecasts.

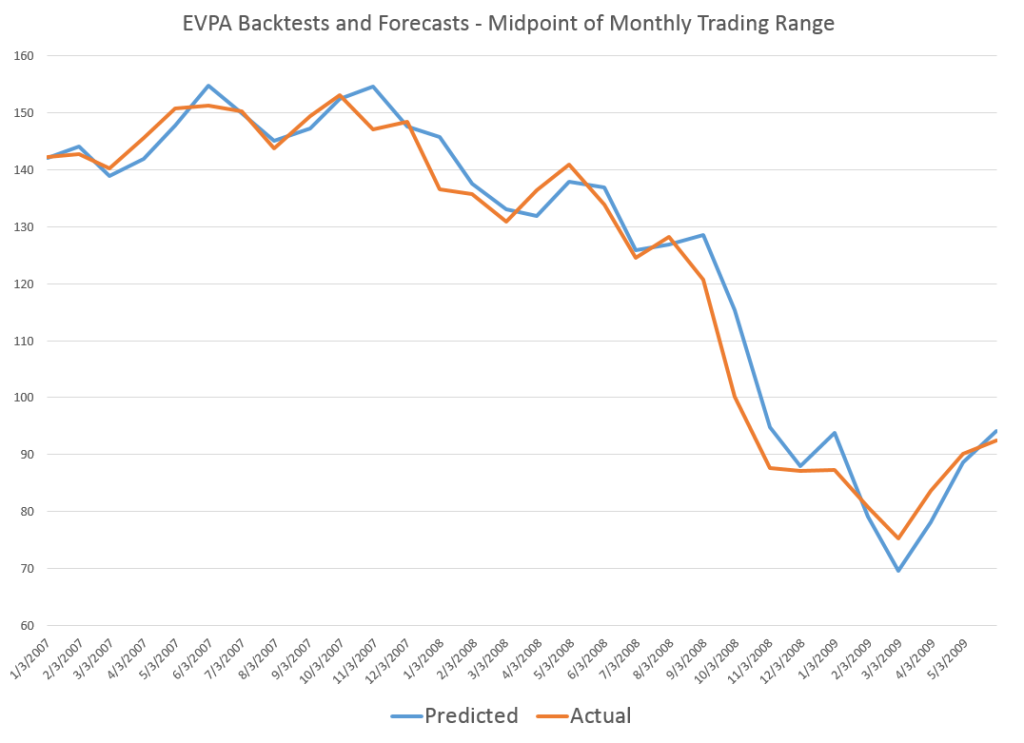
However, the reverse appears to happen, when the SPY prices are falling over a longer period of time.

2008SPYMonth

I would suggest, therefore, that the prediction of about $190 for September is probably going to be higher than the actual number.

Now – disclaimer. This discussion is provided for scientific and entertainment purposes only. We assume no responsibility for any trading actions taken, based on this information. The stock market, particularly now, is volatile. There are lots of balls in the air – China, potential Fed actions on interest rates, more companies missing profit expectations, and so forth – so literally anything may happen.

The EVPA is purely probabilistic. It is right more often than wrong. Its metrics are better than those of alternative forecast models in the cases I have studied. But, withal, it still is a gamble to act on its predictions.

But the performance of the EVPA is remarkable, and I believe further improvements are within reach.

Economic Impact Modeling

I had a chance, recently, to watch computer simulations and interact with a regional economic impact model called REMI. This is a multi-equation model of some vintage (dating back the 1980’s) that has continued to evolve. It’s probably currently the leader in the field and has seen recent application to assessing proposals for increasing the minimum wage – in California, Vermont, San Francisco – and to evaluating  a carbon tax for the Citizen’s Climate Initiative  (see the video presentation at the end of this post).

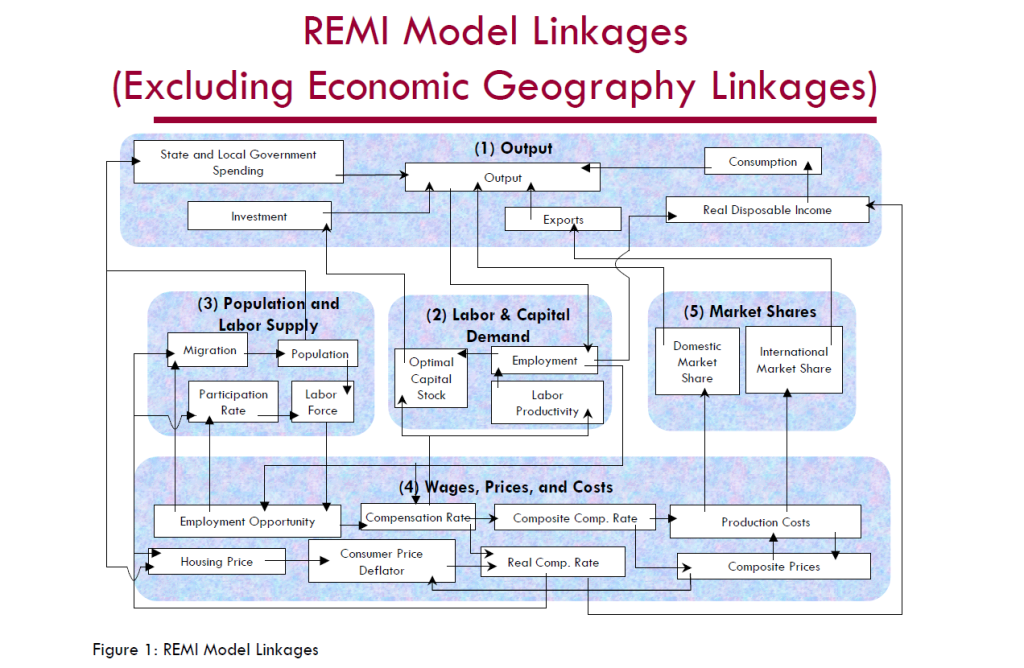
One way to interact with REMI is to click on blocks in a computer screen based on the following schematic

REMIblocs

I watched Brian Lewandowski do this at Colorado University’s Leeds School of Business.

Brian set parameters for increases in labor productivity for professional services and changes in investment in primary and secondary educational by clicking on boxes or blocks. Brian, Richard Wobbekind (pictured below), and I discussed results, and how REMI is helpful in exploring “what-if’s” and might have applications to  optimizing tax policies at the state level..

RichWobbekind

Wobbekind is himself a leader in preparing and presenting State-level forecasts for Colorado, and is active in the International Institute of Forecasters (IIF) which sponsors the International Journal of Forecasting and Foresight – as well as being an Associate Dean of CU’s Leeds School of Business.

Key Point About Multi-Equation, Multivariate Economic Models

From the standpoint of forecasting, the best way I can understand where REMI should be placed in the tool-kit is to remember the distinction between conditional and unconditional forecasts.

REMI model documentation indicates that,

The REMI model consists of thousands of simultaneous equations with a structure that is relatively straightforward. The exact number of equations used varies depending on the extent of industry, demographic, demand, and other detail in the specific model being used. The overall structure of the model can be summarized in five major blocks: (1) Output, (2) Labor and Capital Demand, (3) Population and Labor Supply, (4) Wages, Prices, and Costs, and (5) Market Shares

So you might have equations such as,

X1t = a0 + a1Z1t +..+ akZkt

X2t = b0 + b1Z1t +..+ brZrt

In order to predict unconditionally what (X1t,X2t) will be at some specific future time T*, it is necessary to correctly derive the parameters (a0,a1,..,ak,b0,b1,,…,br).

And it also is necessary, for an unconditional forecast, to predict the future values of all the exogenous variables on the right-hand side of the equation – that is all the Z variables that are not in fact X variables.

This usually means that unconditional forecasts from multivariate forecast models have wide and rapidly diverging confidence intervals.

Thus, if you try to forecast future employment in, say, California with such models, they may underperform simpler, single equation models – such as those based on exponential smoothing, for example.

This does not invalidate general systems models such as REMI.

Assuming the flows and linkages of sectors and blocks are realistic and correctly modeled, such models can help think through the consequences of policy decisions, new legislation, and infrastructure investments.

This is essentially to say that these models may present good conditional forecasts – basically “what-if’s” without being the best forecasting tool available.

Here is a video presentation based on the Citizen’s Climate Initiative application of REMI to assessing a carbon tax – an interesting proposal.

Today’s Stock Market

Shakespeare’s Hamlet says at one point, “There are more things Horatio, than are dreamt of in your philosophy.” This is also a worthy thought when it comes to stock market forecasts.

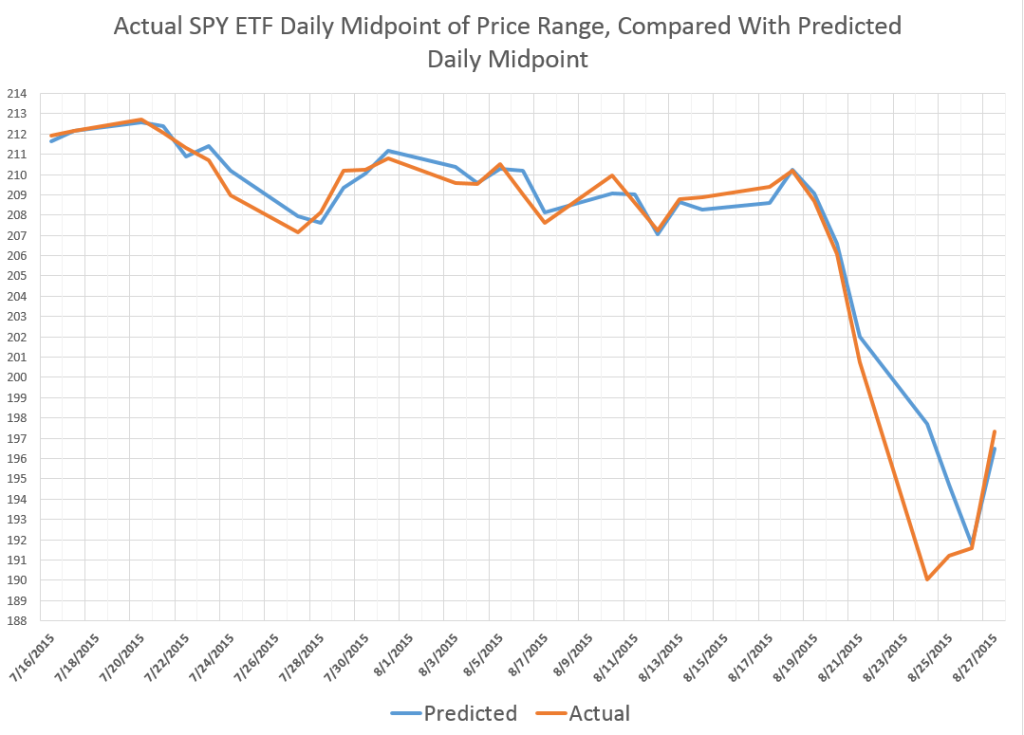
So here is a chart showing recent daily predictions of the midpoint (MP) of the daily price ranges for the SPY exchange traded fund (ETF), compared with the actual dollar value of the midpoint of the trading range for each day.

FlashCrash

The predictions are generated by the EVPA – extreme value prediction algorithm. This is a grown-up version of the idea that ratios, like the ratio between the opening price and the previous high or low, can give us a leg up in predicting the high or low prices (or midpoint) for a trading day.

Note the EVPA is quite accurate up to recent days, when forecast errors amplify at the end of the week of August 21. In fact, in backtests to 1994, EVPA forecasts the daily MP with a mean absolute percent error (MAPE) less that 0.4%.

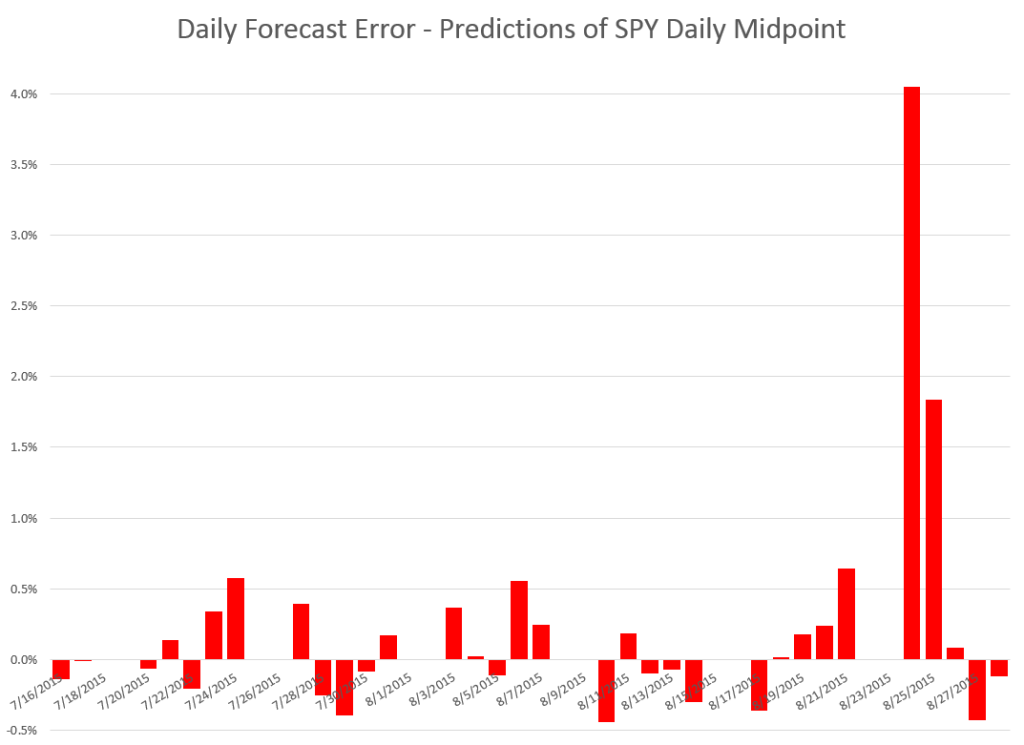
Here is a chart of the forecast errors corresponding to the predicted and actuals in the first chart above.

FCerror

Note the apparently missing bars for some dates are just those forecasts which show such tiny errors they don’t even make it to the display, which is dominated by the forecast error August 24 at about 4 percent.

Note also, the EVPA adjusts quickly, so that by Monday August 28th – when the most dramatic drop in the midpoint (closing price, etc.) occurs – the forecasts (or backcasts) show much lower forecast error (-0.1%).

Where This Is All Going

The EVPA keys off the opening price, which this morning is listed as 198.11 – lower than Friday’s closing price of 199.24.

This should tell you that the predictions for the day are not particularly rosy, and, indeed, the EVPA forecast for the week’s MP of the trading range is almost flat, compared to the midpoint of the trading range for last week. My forecast of the MP for this week is up 0.13%.

What that means, I am not quite sure.

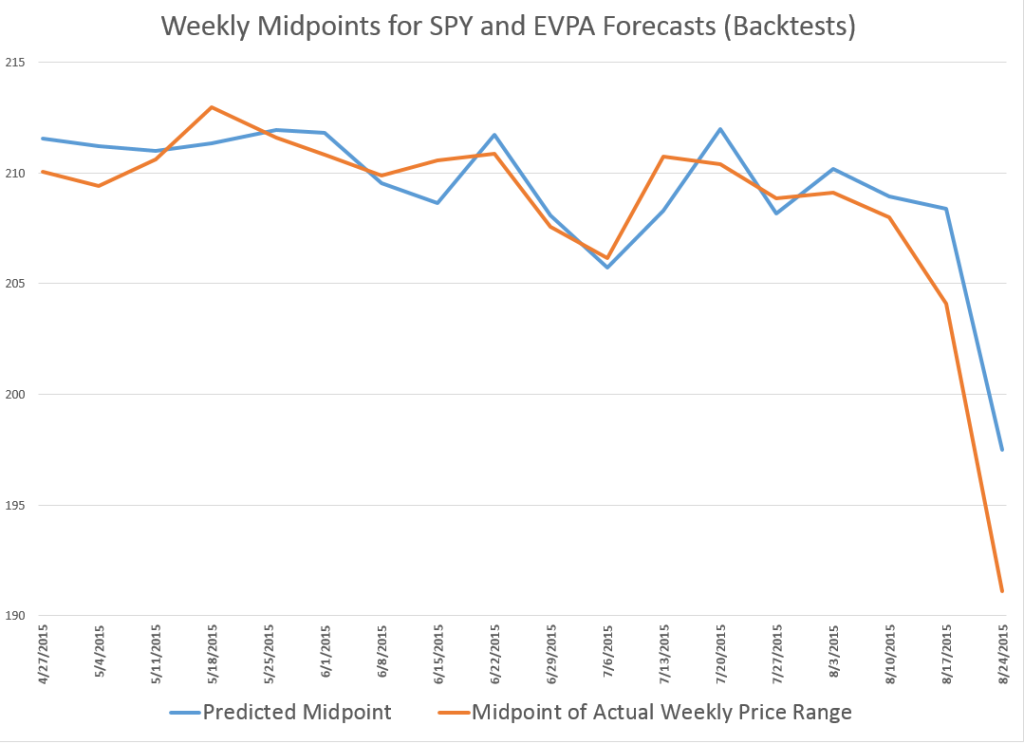
Here is a chart showing the performance of the weekly EVPA forecasts of the SPY MP for recent weeks.

WeeklySPYMP

This chart does not include the forecast for the current week.

What I find really interesting is that, according to this model, the slide in the SPY might have been spotted as early as the second week in August.

The EVPA is an amazing piece of data analytics, but it exists in an environment of enormous complexity. Studies showing that various international stock markets are cointegrated, and the sense of this clearly applies to Chinese and US stock markets. Also, there is talk of pulling the punchbowl of “free money” or zero interest rates, and that seems to have a dampening effect on the trading outlook.

Quite frankly, in recent weeks I have been so absorbed in R programming, testing various approaches, and, as noted in my previous post, weddings, that I have neglected these simple series. No longer. I plan to make these two prediction series automatic with my systems.

We will see.

Recent Events in the US Stock Market

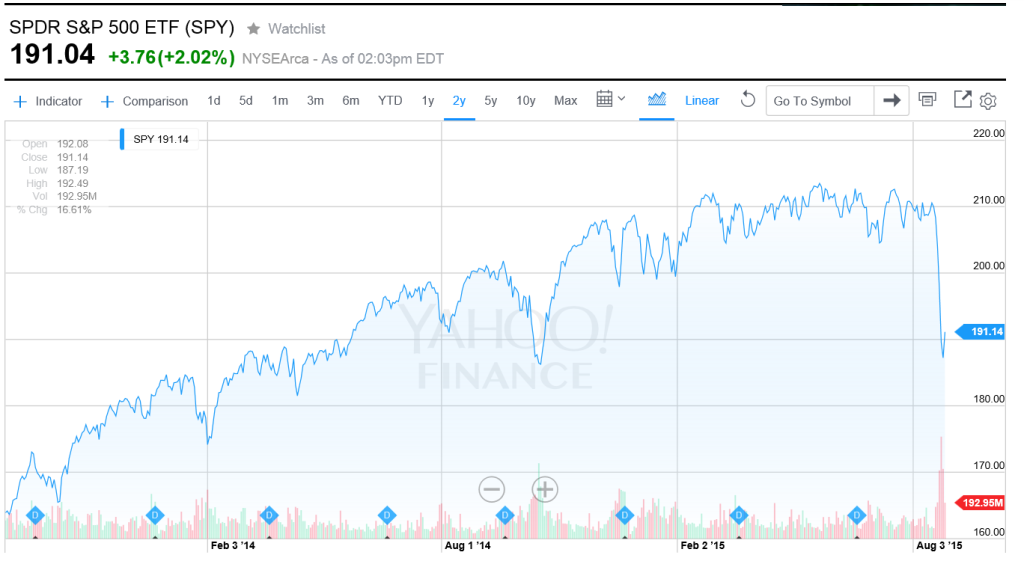
The recent drop in US stocks is dramatic, as the steep falloff of the SPY exchange traded fund (ETF) Monday, August 24th– almost the most recent action in the chart – shows.

SPYAUG26

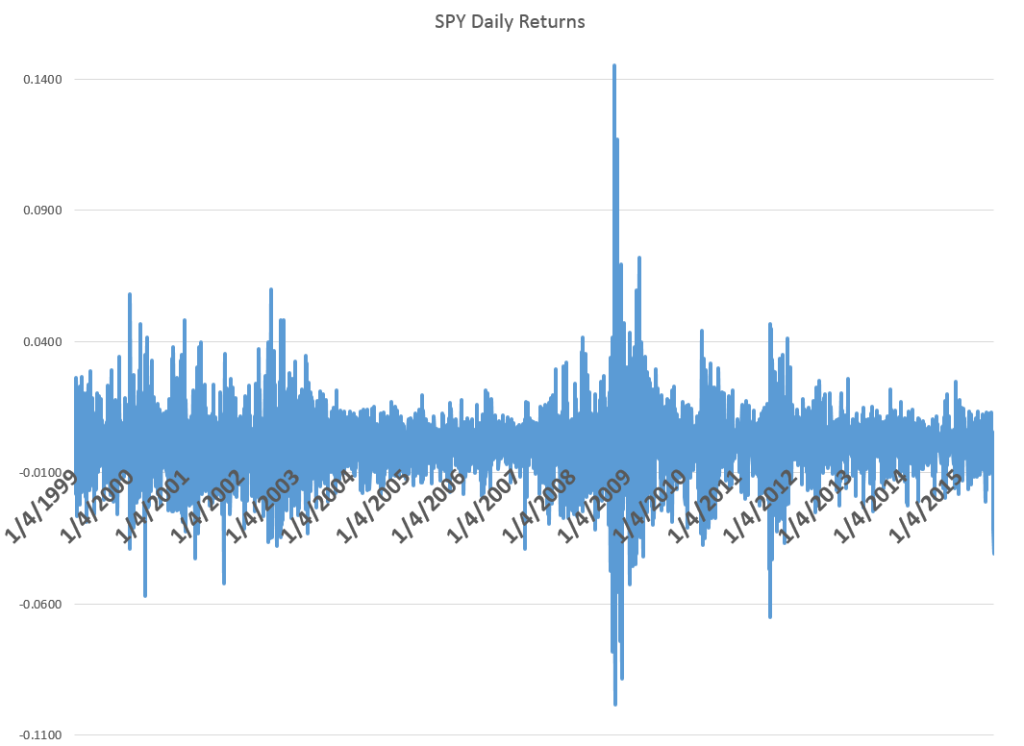
At the same time, this is by no means the steepest drop in closing prices, as the following chart of daily returns highlights.

SPYDailyReturns

TV commentators and others point to China and the prospective liftoff of US short term interest rates, with the Federal Reserve finally raising rates off the zero bound in – it was thought – September.

I have been impressed at the accuracy of Michael Pettis’ predictions in his China Financial Markets. Pettis has warned about a debt bubble in China for two years and consistently makes other correct calls. I have some first-hand experience doing business in China, and plan a longer post of the collapse of Chinese stock markets and the economic slowdown there.

You can imagine, if you will, a sort of global input-output table with a corresponding table of import/export flows. China has gotten a lot bigger since 2008-2009, absorbing significant amounts of the global output of iron and steel, oil, and other commodities.

Also, in 2008-2009 and in the earlier recession of 2001, China led the way to greater spending, buoying the global economy which, otherwise, was in sad shape. That’s not going to happen this time, if a real recession takes hold.

All very scary, but while the latest stuff took place, this is what I was doing.

CliveChair

In other words, I was the father of the groom at a splendid wedding for my younger son at the Pearl Buck estate just outside Philadelphia.

Well, that wonderful thing being done, I plan to return to more frequent posting on BusinessForecastblog.

I also apologize for having the tools to predict the current downturn, at least after developments later last week, and not signaling readers.

But frankly, I’m not sure the extreme value prediction algorithms (EVPA) reliably predict major turning points. In fact, there seem to be outside influences at key junctures. However, once a correction is underway, predictability returns. Thus, the algorithms do more than simply forecast the growth in stock prices. The EVPA also works to predict the extent of downturns.

Here’s a tip. Start watching ratios such as those between  differences between the  opening price in a trading day and the previous day’s high or low price, divided by the previous day’s high or low price, respectively. Very significant predictors of the change in daily highs and lows, and with significance for changes in closing prices, if you bring some data analytics to bear.

Links – early August, 2015

Well, I’m back, after deep dives into R programming and statistical modeling. I’d like to offer these links which I’ve bookmarked in recent days. The first four cover a scatter of topics, from impacts of the so-called sharing economy and climate developments to the currency impacts of the more and more certain moves by the US Federal Reserve to increase interest rates in September.

But then I’ve collected a number of useful links on robotics and artificial intelligence.

How the ‘sharing economy’ is upending the travel industry

DS: New York Attorney General Eric Schneiderman last October issued a report finding 72 percent of the reservations on Airbnb going back to 2010 were in violation of city law. What’s the industry doing to address these concerns?

MB: Listen, I think there are a lot of outdated regulations and a lot of outdated laws that were written in a time where you couldn’t possibly imagine the innovation that has come up from the sharing economy, and a lot of those need to be updated to meet the world that we live in today, and I think that’s important.  Sometimes you have regulations that are put in place by incumbent industries that didn’t want competition and you have some regulations that were put in place back in the ’60s and ’70s, where you couldn’t imagine any of these things, and so I think sometimes you need to see updates.

So there you go – laws on the books are outdated.

Brain-controlled prosthesis nearly as good as one-finger typing

The goal of all this research is to get thought-controlled prosthetics to people with ALS. Today these people may use an eye-tracking system to direct cursors or a “head mouse” that tracks the movement of the head. Both are fatiguing to use. Neither provides the natural and intuitive control of readings taken directly from the brain.

The U.S. Food and Drug Administration recently gave Shenoy’s team the green light to conduct a pilot clinical trial of their thought-controlled cursor on people with spinal cord injuries.

Jimmy Carter: The U.S. Is an “Oligarchy With Unlimited Political Bribery”

Unfortunately, very apt characterization from a formal standpoint of political science.

Carter

What to Expect from El Niño: North America

The only El Niño events in NOAA’s 1950-2015 database comparable in strength to the one now developing occurred in 1982-83 and 1997-98… Like other strong El Niño events, this one will almost certainly last just one winter. But at least for the coming wet season, it holds encouraging odds of well-above average precipitation for California. During a strong El Niño, the subtropical jet stream is energized across the southern U.S., while the polar jet stream tends to stay north of its usual winter position or else consolidate with the subtropical jet. This gives warm, wet Pacific systems a better chance to push northeast into California… Milder and drier a good bet for Pacific Northwest, Northern Plains, western Canada.. Rockies snowfall: The south usually wins out…Thanks to the jet-shifting effects noted above, snowfall tends to be below average in the Northern Rockies and above average in the Southern Rockies during strong El Niños. The north-south split extends to Colorado, where northern resorts such as Steamboat Springs typically lose out to areas like the San Juan and Sangre de Cristo ranges across the southern part of the state. Along the populous Front Range from Denver to Fort Collins, El Niño hikes the odds of a big snowstorm, especially in the spring and autumn. About half of Boulder’s 12” – 14” storms occur during El Niño, and the odds of a 20” or greater storm are quadrupled during El Niño as opposed to La Niña.

According to NOAA, the single most reliable El Niño outcome in the United States, occurring in more than 80% of El Niño events over the last century, is the tendency for wet wintertime conditions along and near the Gulf Coast, thanks to the juiced-up subtropical jet stream.

Emerging market currencies crash on Fed fears and China slump

The currencies of Brazil, Mexico, South Africa and Turkey have all crashed to multi-year lows as investors flee emerging markets and commodity prices crumble.

Robotics and Artificial Intelligence

Some of the most valuable research I’ve found so far on the job and societal impacts of robotics comes from a survey of experts conducted by the Pew Research Internet Project AI, Robotics, and the Future of Jobs,

Some 1,896 experts responded to the following question:

The economic impact of robotic advances and AI—Self-driving cars, intelligent digital agents that can act for you, and robots are advancing rapidly. Will networked, automated, artificial intelligence (AI) applications and robotic devices have displaced more jobs than they have created by 2025?

Half of these experts (48%) envision a future in which robots and digital agents have displaced significant numbers of both blue- and white-collar workers—with many expressing concern that this will lead to vast increases in income inequality, masses of people who are effectively unemployable, and breakdowns in the social order.

The other half of the experts who responded to this survey (52%) expect that technology will not displace more jobs than it creates by 2025. To be sure, this group anticipates that many jobs currently performed by humans will be substantially taken over by robots or digital agents by 2025. But they have faith that human ingenuity will create new jobs, industries, and ways to make a living, just as it has been doing since the dawn of the Industrial Revolution.

Read this – the comments on both sides of this important question are trenchant, important.

The next most useful research comes from a 2011 publication of Brian Arthur in the McKinsey Quarterly The second economy – which is the part of the economy where machines transact just with other machines.

Something deep is going on with information technology, something that goes well beyond the use of computers, social media, and commerce on the Internet. Business processes that once took place among human beings are now being executed electronically. They are taking place in an unseen domain that is strictly digital. On the surface, this shift doesn’t seem particularly consequential—it’s almost something we take for granted. But I believe it is causing a revolution no less important and dramatic than that of the railroads. It is quietly creating a second economy, a digital one.

Twenty years ago, if you went into an airport you would walk up to a counter and present paper tickets to a human being. That person would register you on a computer, notify the flight you’d arrived, and check your luggage in. All this was done by humans. Today, you walk into an airport and look for a machine. You put in a frequent-flier card or credit card, and it takes just three or four seconds to get back a boarding pass, receipt, and luggage tag. What interests me is what happens in those three or four seconds. The moment the card goes in, you are starting a huge conversation conducted entirely among machines. Once your name is recognized, computers are checking your flight status with the airlines, your past travel history, your name with the TSA (and possibly also with the National Security Agency). They are checking your seat choice, your frequent-flier status, and your access to lounges. This unseen, underground conversation is happening among multiple servers talking to other servers, talking to satellites that are talking to computers (possibly in London, where you’re going), and checking with passport control, with foreign immigration, with ongoing connecting flights. And to make sure the aircraft’s weight distribution is fine, the machines are also starting to adjust the passenger count and seating according to whether the fuselage is loaded more heavily at the front or back.

These large and fairly complicated conversations that you’ve triggered occur entirely among things remotely talking to other things: servers, switches, routers, and other Internet and telecommunications devices, updating and shuttling information back and forth. All of this occurs in the few seconds it takes to get your boarding pass back. And even after that happens, if you could see these conversations as flashing lights, they’d still be flashing all over the country for some time, perhaps talking to the flight controllers—starting to say that the flight’s getting ready for departure and to prepare for that…

If I were to look for adjectives to describe this second economy, I’d say it is vast, silent, connected, unseen, and autonomous (meaning that human beings may design it but are not directly involved in running it). It is remotely executing and global, always on, and endlessly configurable. It is concurrent—a great computer expression—which means that everything happens in parallel. It is self-configuring, meaning it constantly reconfigures itself on the fly, and increasingly it is also self-organizing, self-architecting, and self-healing…

If I were to look for adjectives to describe this second economy, I’d say it is vast, silent, connected, unseen, and autonomous (meaning that human beings may design it but are not directly involved in running it). It is remotely executing and global, always on, and endlessly configurable. It is concurrent—a great computer expression—which means that everything happens in parallel. It is self-configuring, meaning it constantly reconfigures itself on the fly, and increasingly it is also self-organizing, self-architecting, and self-healing

I’m interested in how to measure the value of services produced in this “second economy.”

Finally, China’s adoption of robotics seems to signal something – as in this piece about a totally automatic factor for cell phone parts –

China sets up first unmanned factory; all processes are operated by robots

At the workshop of Changying Precision Technology Company in Dongguan, known as the “world factory”, which manufactures cell phone modules, 60 robot arms at 10 production lines polish the modules day .. The technical staff just sits at the computer and monitors through a central control system… In the plant, all the processes are operated by computer- controlled robots, computer numerical control machining equipment, unmanned transport trucks and automated warehouse equipment.

Our Next President is a Wrestling Giant – Trump

Greetings, and I thought you would all enjoy this bit of rough-and-tumble involving the leading Republican candidate so far for US President – Donald Trump.

Make sure you watch past the 42 second mark to see Trump lambast his billionaire buddy. 

So this is really happening. Trump apparently has hired people to work on his campaign for President, and he has taken an early lead over Scott Walker and Jeb Bush, and the other more minor candidates.

Economic Outlook – July 2015

For my money, Janet Yellen’s speech July 10 – parts of which I quote below – is important.

Yellen says the Fed plans the first increase in interest rates this year – in September or December, given Fed meeting schedules.

I believe the fact that we have virtually zero interest rates, and have for some time, creates distortions in economic discussions, not to mention its bizarre effects on the real economy.

On the one hand, the US Federal Reserve must realize that if it does not raise interest rates in this phase of the business cycle, it may be a very long time before we get off the zero lower bound. This creates a tendency to “happy talk” from monetary officials, although not Ms. Yellen specifically, papering over weakness in the US and global economy.

On the other hand, I suspect there are now economic interests invested in continuation of low rates, and their contribution going forward may be to sound the alarm at the slightest sign of economic troubles.

And, truly, this expansion phase of the current business cycle is “growing long in the tooth.” It began, according to the National Bureau of Economic Research, in summer 2009. This makes for 96 months from the previous trough of the business cycle to the current time. Only two previous US business expansions historically are longer than this, and only by one or two years.

The price of (economic) freedom is eternal vigilance. With that in mind, consider some of the datapoints on the current economic outlook.

United States

There is an extensive extract from Ms. Yellen’s speech, assessing US economic conditions, the latest report indicating retail sales softened, and the earlier May 2015 consensus forecast of the Survey of Professional Forecasters, indicating lower economic growth expectations.

Janet Yellen’s Speech at the City Club of Cleveland, Ohio

Let me turn now to where I think the economy is headed over the next several years. The latest estimates show that both real GDP and industrial production actually edged down in the first quarter of this year. Some of this weakness appears to be the result of factors that I expect will be only transitory, such as the unusually harsh winter weather in some regions of the country and the West Coast port labor dispute that briefly restrained international trade and caused disruptions in manufacturing supply chains. Also, statistical noise or measurement issues may have played some role. This is not the first time in recent years that real GDP has been reported to decline, or grow unusually slowly, in the first quarter of the year. There is a healthy debate among economists–many within the Federal Reserve System–about some of the technical factors that may lie behind this pattern.4 Nevertheless, at least a couple of other more persistent factors also likely weighed on economic output and industrial production in the first quarter. In particular, the higher foreign exchange value of the dollar that I mentioned, as well as weak growth in some foreign economies, has restrained the demand for U.S. exports. Moreover, lower crude oil prices have significantly depressed business investment in the domestic energy sector. Indeed, industrial production continued to decline somewhat in April and May. We expect the drag on domestic economic activity from these factors to ease over the course of this year, as the value of the dollar and crude oil prices stabilize, and I anticipate moderate economic growth, on balance, for this year as a whole. As always, however, the economic outlook is uncertain. Notably, although the economic recovery in the euro area appears to have gained a firmer footing, the situation in Greece remains unresolved.

JenetYellen

Looking further ahead, I think that many of the fundamental factors underlying U.S. economic activity are solid and should lead to some pickup in the pace of economic growth in the coming years. In particular, I anticipate that employment will continue to expand and the unemployment rate will decline further.

An improving job market should, in turn, help support a faster pace of household spending growth. Additional jobs and potentially faster wage growth bolster household incomes, and lower energy prices mean consumers have more money to spend on other goods and services. In addition, growing employment and wages should make consumers more comfortable in spending a greater portion of their incomes than they have been in the aftermath of the Great Recession. Moreover, increases in house values and stock market prices, along with reductions in debt in recent years, have pushed up households’ net worth, which also should support more spending. Finally, interest rates faced by borrowers remain low, reflecting the FOMC’s highly accommodative monetary policies. Indeed, recent encouraging data about retail sales and light motor vehicle purchases in the beginning of the second quarter could be an indication that the pace of consumer spending is picking up.

Another positive factor for the outlook is that the drag on economic growth in recent years from changes in federal fiscal policies appears to have waned. Temporary fiscal stimulus measures supported economic output during the recession and early in the recovery, but those stimulus measures have since expired, and additional policy actions were taken to reduce the federal budget deficit. By 2011, these changes in fiscal policies were holding back economic growth. However, the effects of those fiscal policy actions now seem to be mostly behind us.5

There are a couple of factors, however, that I expect could restrain economic growth. First, business owners and managers remain cautious and have not substantially increased their capital expenditures despite the solid fundamentals and brighter prospects for consumer spending. Businesses are holding large amounts of cash on their balance sheets, which may suggest that greater risk aversion is playing a role. Indeed, some economic analysis suggests that uncertainty about the strength of the recovery and about government economic policies could be contributing to the restraint in business investment.6

A second factor that could restrain economic growth regards housing. While national home prices have been rising for a few years and home sales have improved recently, residential construction has remained quite soft. Many households still find it difficult to obtain mortgage credit, but, more generally, the weak job market and slow wage gains in recent years appear to have induced people to double-up on housing. For example, many young adults continue to live with their parents. Population growth is creating a need for more housing, whether to rent or to own, and I do expect that continuing job and wage gains will encourage more people to form new households. Nevertheless, activity in the housing sector seems likely to improve only gradually.

Regarding inflation, as I mentioned earlier, the recent effects of lower prices for crude oil and for imports on overall inflation are expected to wane during this year. Combined with further tightening in labor and product markets, I expect inflation will move toward the FOMC’s 2 percent objective over the next few years. Importantly, a number of different surveys indicate that longer-term inflation expectations have remained stable even as recent readings on inflation have fallen. If inflation expectations had not remained stable, I would be more concerned because consumer and business expectations about inflation can become self-fulfilling.

From the New York Times – To my ears, most of Ms. Yellen’s speech expertly laid out why the economy is not ready for interest rate increases anytime soon. Then, toward the end, she said that based on her views, she expected to begin raising rates “at some point later this year.” That would mean a rate hike in three months, at the Fed’s next meeting in September, or six months hence at its December meeting.

ADVANCE MONTHLY SALES FOR RETAIL AND FOOD SERVICES

The U.S. Census Bureau announced today that advance estimates of U.S. retail and food services sales for June, adjusted for seasonal variation and holiday and trading-day differences, but not for price changes, were $442.0 billion, a decrease of 0.3 percent (±0.5%)* from the previous month, but up 1.4 percent (±0.9%) above June 2014. Total sales for the April 2015 through June 2015 period were up 1.7 percent (±0.7%) from the same period a year ago. The April 2015 to May 2015 percent change was revised from +1.2 percent (±0.5%) to +1.0 percent (±0.3%).

Retail trade sales were down 0.3 percent (±0.5%)* from May 2015, but up 0.6 percent (±0.7%)* above last year. Food services and drinking places were up 7.7 percent (±3.3%) from June 2014 and sporting goods, hobby, books and music were up 6.6 percent (±1.9%) from last year. Gasoline stations were down 17.1% (±1.4%) from the previous year.

Second Quarter 2015 Survey of Professional Forecasters

(Release Date: May 15, 2015) Weaker Outlook for Growth

The outlook for growth in the U.S. economy over the next three years looks weaker now than it did in February, according to 44 forecasters surveyed by the Federal Reserve Bank of Philadelphia. The forecasters predict real GDP will grow at an annual rate of 2.5 percent this quarter and 3.1 percent next quarter. On an annual-average over annual-average basis, real GDP will grow 2.4 percent in 2015, down 0.8 percentage point from the previous estimate. The forecasters predict real GDP will grow 2.8 percent each in 2016 and 2017, and 2.5 percent in 2018.

Global

Emerging markets made up some of the slack in the global economy after 2008-2009, but today are everywhere slowing, as the latest revision of the International Monetary Fund (IMF) World Economic Outlook indicates.

IMF July World Economic Outlook – Slower Growth in Emerging Markets, a Gradual Pickup in Advanced Economies

Global growth is projected at 3.3 percent in 2015, marginally lower than in 2014, with a gradual pickup in advanced economies and a slowdown in emerging market and developing economies. In 2016, growth is expected to strengthen to 3.8 percent.

  • A setback to activity in the first quarter of 2015, mostly in North America, has resulted in a small downward revision to global growth for 2015 relative to the April 2015 World Economic Outlook (WEO). Nevertheless, the underlying drivers for a gradual acceleration in economic activity in advanced economies—easy financial conditions, more neutral fiscal policy in the euro area, lower fuel prices, and improving confidence and labor market conditions—remain intact.
  • In emerging market economies, the continued growth slowdown reflects several factors, including lower commodity prices and tighter external financial conditions, structural bottlenecks, rebalancing in China, and economic distress related to geopolitical factors. A rebound in activity in a number of distressed economies is expected to result in a pickup in growth in 2016.
  • The distribution of risks to global economic activity is still tilted to the downside. Near-term risks include increased financial market volatility and disruptive asset price shifts, while lower potential output growth remains an important medium-term risk in both advanced and emerging market economies. Lower commodity prices also pose risks to the outlook in low-income developing economies after many years of strong growth.

Link to Blanchard video

China May Tip World Into Recession: Morgan Stanley

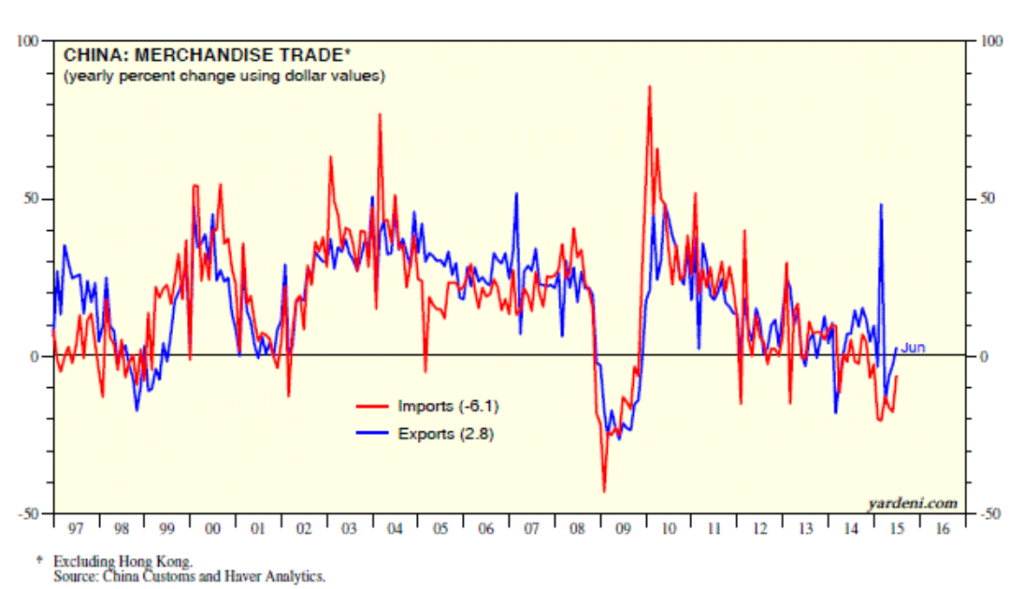
Also there is this interesting chart From Dr. Ed’s Blog
ChinaTrade

Impending Disaster In Greece

My take is that the harsh dealing with Greece led by, apparently, the Germans is more symbolic than directly material to global economic conditions. Nevertheless, it is an ugly symbol, representing, it seems, the end of dreamy thoughts about European integration and the onset of recognition of new German hegemony in Europe.

I am an admirer of modern Germany, having struggled to relearn enough German to read newspapers recently and ask for items in German bakeries. I see the German perspective, but I deeply regret its narrow scope. I think more conservative Germans are missing the big picture here. Of course, the plight of the Greeks is desperate and lamentable.

One final remark – forecasting comes to the fore at junctures such as these. Are we on the cusp, have we started to slide down, or is there still some upside? Compelling questions.
Back to the Drawing Board

Well, not exactly, since I never left it.

But the US and other markets opened higher today, after round-the-clock negotiations on the Greek debt.

I notice that Jeff Miller of Dash of Insight frequently writes stuff like, We would all like to know the direction of the market in advance. Good luck with that! Second best is planning what to look for and how to react.

Running the EVPA with this morning’s pop up in the opening price of the SPY, I get a predicted high for the day of 210.17 and a predicted low of 207.5. The predicted low for the day will be spot-on, if the current actual low for the trading range holds.

I can think of any number of arguments to the point that the stock market is basically not predictable, because unanticipated events constantly make an impact on prices. I think it would even be possible to invoke Goedel’s Theorem – you know, the one that uses meta-mathematics to show that every axiomatic system of complexity greater than a group is essentially incomplete. There are always new truths.

On the other hand, backtesting the EVPA – extreme value prediction algorithm – is opening up new vistas. I’m appreciative of helpful comments of and discussions with professionals in the finance and stock market investing field.

I strain every resource to develop backtests which are out-of-sample (OOS), and recently have found a way to predict closing prices with resources from the EVPA.

MOnthlyROISPYevpa

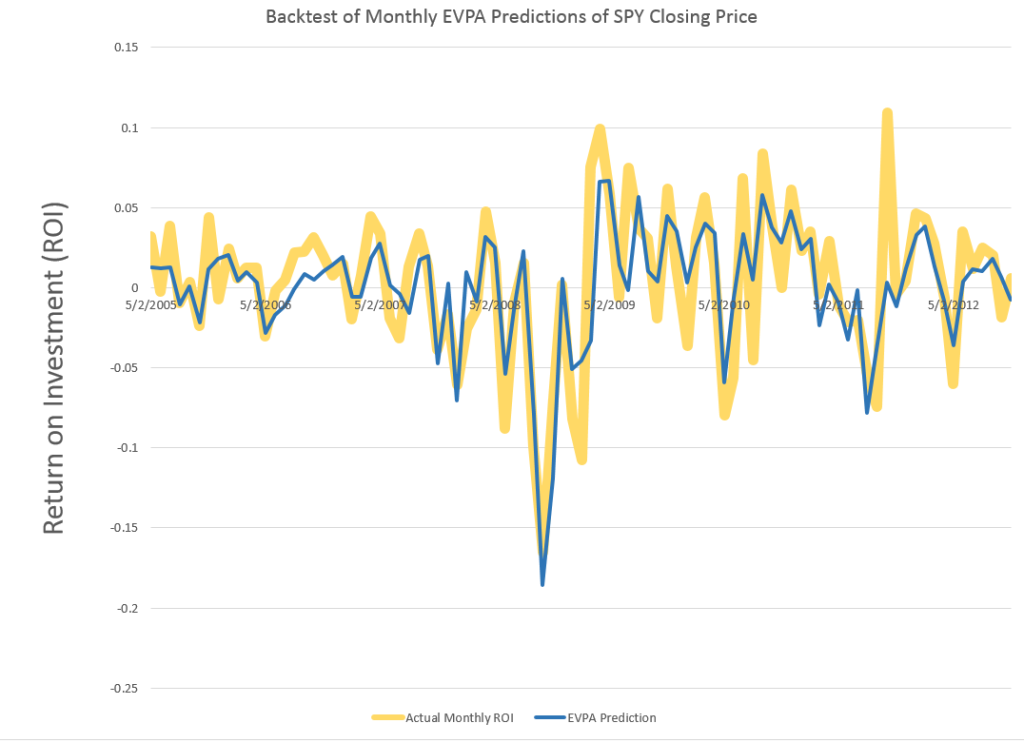
Great chart. The wider gold lines are the actual monthly ROI for the SPY, based on monthly closing prices. The blue line shows the OOS prediction of these closing prices, based on EVPA metrics. As you can see, the blue line predictions flat out miss or under-predict some developments in the closing prices. At the same time, in other cases, the EVPA predictions show uncanny accuracy, particularly in some of the big dips down.

Recognize this is something new. Rather than, say, predicting developments likely over a range of trading days – the high and low of a month, the  chart above shows predictions for stock prices at specific times, at the closing bell of the market the last trading day of each month.

I calculate the OOS R2 at 0.63 for the above series, which I understand is better than can be achieved with an autoregressive model for the closing prices and associated ROI’s.

I’ve also developed spreadsheets showing profits, after broker fees and short term capital gains taxes, from trading based on forecasts of the EVPA.

But, in addition to guidance for my personal trading, I’m interested in following out the implications of how much the historic prices predict about the prices to come.

Direction of the Market Next Week – July 13

Last Friday, before July 4th, I ran some numbers on the SPY exchange traded fund, looking at backcasts from the EVPA (extreme value prediction algorithm) for the Monday and Tuesday before, when Greece kept the banks closed and defaulted on its IMF payment. I also put up a ten day look forward on the EVPA predictions.

Of course, the SPY is an ETF which tracks the S&P 500.

The EVPA predicted the SPY high and low would drop at the beginning of the following week, beginning July 6, but seemed to suggest some rebound by the end of this week – that is today, July 10.

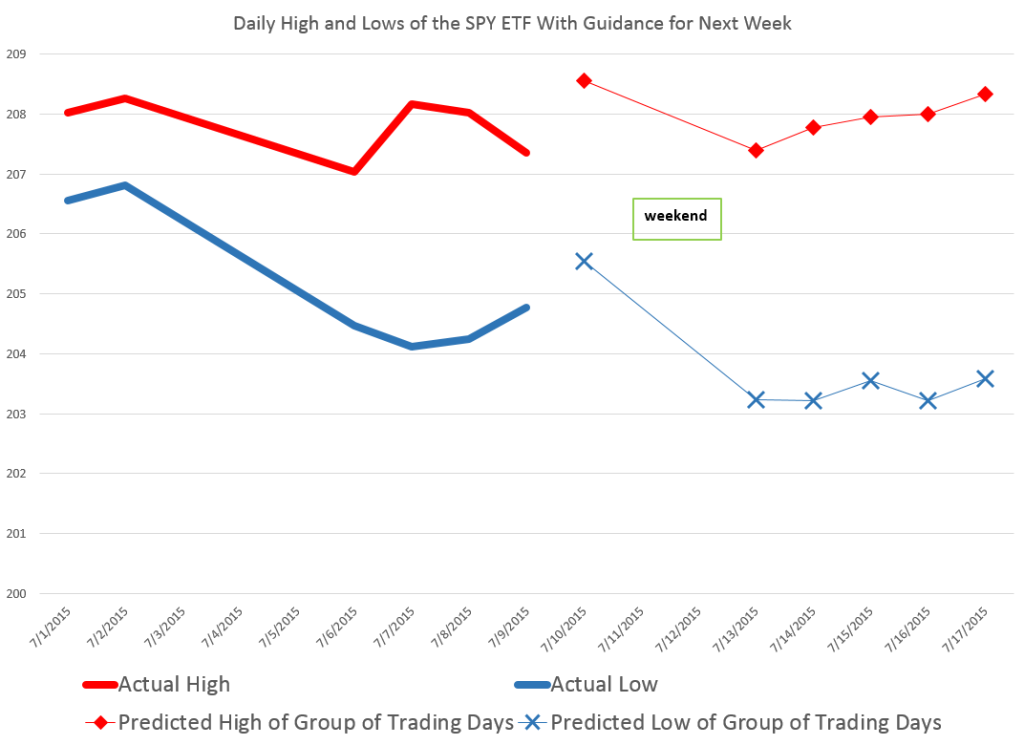
Here is a chart for today and next week with comments on interpreting the forecasts.

NextWeek

So the EVPA predicts the high and low over the current trading day, and aggregations of 2,3,4,.. trading days going forward.

The red diamonds in the chart map out forecasts for the high price of the SPY today, July 10, and for groups of trading days beginning today and ending Monday, July 13, and the rest of the days of next week.

Similarly, the blue crosses map out forecasts for the SPY low prices which are predicted to be reached over 1 day, the next two trading days, the next three trading days, and so forth.

Attentive readers will notice an apparent glitch in the forecasts for the high prices to come – namely that the predicted high of the next two trading days is lower than the predicted high for today – which is, of course, logically impossible.

But, hey, this is econometrics, not logic, and what we need to do is interpret the output of the models against what it is we are looking for.

In this case, a solid reduction in the predicted high of the coming two day period, compared with the prediction of today’s high signals that the high of the SPY is likely to be lower Monday than today.

This is consistent with predictions for the low today and for the next two trading days shown in blue – which indicates lower lows will be reached the second day.

Following that, the EVPA predictions for higher groupings of trading days are inconclusive, given statistical tolerances of the approach.

Note that the predictions of the high and low for today, Friday, July 10, are quite accurate, assuming these bounds have been reached by this point – two o’clock on Wall Street. In percentage error terms, the EVAP forecasts are over-forecasting 0.3% for the high and 0.2% for the low.

Again, the EVPA always keys off the opening price of the period being forecast.

I also have a version of the EVPA which forecasts ahead for the coming week, for two week periods, and so forth.

Leading up to the financial crisis of 2008 and then after the worst in October of that year, the EVPA weekly forecasts clearly highlight turning points.

Currently, weekly forecasts going up to monthly durations do not signal any clear trend in the market, but rather signal increasing volatility.