Category Archives: climate change

Links – early August, 2015

Well, I’m back, after deep dives into R programming and statistical modeling. I’d like to offer these links which I’ve bookmarked in recent days. The first four cover a scatter of topics, from impacts of the so-called sharing economy and climate developments to the currency impacts of the more and more certain moves by the US Federal Reserve to increase interest rates in September.

But then I’ve collected a number of useful links on robotics and artificial intelligence.

How the ‘sharing economy’ is upending the travel industry

DS: New York Attorney General Eric Schneiderman last October issued a report finding 72 percent of the reservations on Airbnb going back to 2010 were in violation of city law. What’s the industry doing to address these concerns?

MB: Listen, I think there are a lot of outdated regulations and a lot of outdated laws that were written in a time where you couldn’t possibly imagine the innovation that has come up from the sharing economy, and a lot of those need to be updated to meet the world that we live in today, and I think that’s important.  Sometimes you have regulations that are put in place by incumbent industries that didn’t want competition and you have some regulations that were put in place back in the ’60s and ’70s, where you couldn’t imagine any of these things, and so I think sometimes you need to see updates.

So there you go – laws on the books are outdated.

Brain-controlled prosthesis nearly as good as one-finger typing

The goal of all this research is to get thought-controlled prosthetics to people with ALS. Today these people may use an eye-tracking system to direct cursors or a “head mouse” that tracks the movement of the head. Both are fatiguing to use. Neither provides the natural and intuitive control of readings taken directly from the brain.

The U.S. Food and Drug Administration recently gave Shenoy’s team the green light to conduct a pilot clinical trial of their thought-controlled cursor on people with spinal cord injuries.

Jimmy Carter: The U.S. Is an “Oligarchy With Unlimited Political Bribery”

Unfortunately, very apt characterization from a formal standpoint of political science.

Carter

What to Expect from El Niño: North America

The only El Niño events in NOAA’s 1950-2015 database comparable in strength to the one now developing occurred in 1982-83 and 1997-98… Like other strong El Niño events, this one will almost certainly last just one winter. But at least for the coming wet season, it holds encouraging odds of well-above average precipitation for California. During a strong El Niño, the subtropical jet stream is energized across the southern U.S., while the polar jet stream tends to stay north of its usual winter position or else consolidate with the subtropical jet. This gives warm, wet Pacific systems a better chance to push northeast into California… Milder and drier a good bet for Pacific Northwest, Northern Plains, western Canada.. Rockies snowfall: The south usually wins out…Thanks to the jet-shifting effects noted above, snowfall tends to be below average in the Northern Rockies and above average in the Southern Rockies during strong El Niños. The north-south split extends to Colorado, where northern resorts such as Steamboat Springs typically lose out to areas like the San Juan and Sangre de Cristo ranges across the southern part of the state. Along the populous Front Range from Denver to Fort Collins, El Niño hikes the odds of a big snowstorm, especially in the spring and autumn. About half of Boulder’s 12” – 14” storms occur during El Niño, and the odds of a 20” or greater storm are quadrupled during El Niño as opposed to La Niña.

According to NOAA, the single most reliable El Niño outcome in the United States, occurring in more than 80% of El Niño events over the last century, is the tendency for wet wintertime conditions along and near the Gulf Coast, thanks to the juiced-up subtropical jet stream.

Emerging market currencies crash on Fed fears and China slump

The currencies of Brazil, Mexico, South Africa and Turkey have all crashed to multi-year lows as investors flee emerging markets and commodity prices crumble.

Robotics and Artificial Intelligence

Some of the most valuable research I’ve found so far on the job and societal impacts of robotics comes from a survey of experts conducted by the Pew Research Internet Project AI, Robotics, and the Future of Jobs,

Some 1,896 experts responded to the following question:

The economic impact of robotic advances and AI—Self-driving cars, intelligent digital agents that can act for you, and robots are advancing rapidly. Will networked, automated, artificial intelligence (AI) applications and robotic devices have displaced more jobs than they have created by 2025?

Half of these experts (48%) envision a future in which robots and digital agents have displaced significant numbers of both blue- and white-collar workers—with many expressing concern that this will lead to vast increases in income inequality, masses of people who are effectively unemployable, and breakdowns in the social order.

The other half of the experts who responded to this survey (52%) expect that technology will not displace more jobs than it creates by 2025. To be sure, this group anticipates that many jobs currently performed by humans will be substantially taken over by robots or digital agents by 2025. But they have faith that human ingenuity will create new jobs, industries, and ways to make a living, just as it has been doing since the dawn of the Industrial Revolution.

Read this – the comments on both sides of this important question are trenchant, important.

The next most useful research comes from a 2011 publication of Brian Arthur in the McKinsey Quarterly The second economy – which is the part of the economy where machines transact just with other machines.

Something deep is going on with information technology, something that goes well beyond the use of computers, social media, and commerce on the Internet. Business processes that once took place among human beings are now being executed electronically. They are taking place in an unseen domain that is strictly digital. On the surface, this shift doesn’t seem particularly consequential—it’s almost something we take for granted. But I believe it is causing a revolution no less important and dramatic than that of the railroads. It is quietly creating a second economy, a digital one.

Twenty years ago, if you went into an airport you would walk up to a counter and present paper tickets to a human being. That person would register you on a computer, notify the flight you’d arrived, and check your luggage in. All this was done by humans. Today, you walk into an airport and look for a machine. You put in a frequent-flier card or credit card, and it takes just three or four seconds to get back a boarding pass, receipt, and luggage tag. What interests me is what happens in those three or four seconds. The moment the card goes in, you are starting a huge conversation conducted entirely among machines. Once your name is recognized, computers are checking your flight status with the airlines, your past travel history, your name with the TSA (and possibly also with the National Security Agency). They are checking your seat choice, your frequent-flier status, and your access to lounges. This unseen, underground conversation is happening among multiple servers talking to other servers, talking to satellites that are talking to computers (possibly in London, where you’re going), and checking with passport control, with foreign immigration, with ongoing connecting flights. And to make sure the aircraft’s weight distribution is fine, the machines are also starting to adjust the passenger count and seating according to whether the fuselage is loaded more heavily at the front or back.

These large and fairly complicated conversations that you’ve triggered occur entirely among things remotely talking to other things: servers, switches, routers, and other Internet and telecommunications devices, updating and shuttling information back and forth. All of this occurs in the few seconds it takes to get your boarding pass back. And even after that happens, if you could see these conversations as flashing lights, they’d still be flashing all over the country for some time, perhaps talking to the flight controllers—starting to say that the flight’s getting ready for departure and to prepare for that…

If I were to look for adjectives to describe this second economy, I’d say it is vast, silent, connected, unseen, and autonomous (meaning that human beings may design it but are not directly involved in running it). It is remotely executing and global, always on, and endlessly configurable. It is concurrent—a great computer expression—which means that everything happens in parallel. It is self-configuring, meaning it constantly reconfigures itself on the fly, and increasingly it is also self-organizing, self-architecting, and self-healing…

If I were to look for adjectives to describe this second economy, I’d say it is vast, silent, connected, unseen, and autonomous (meaning that human beings may design it but are not directly involved in running it). It is remotely executing and global, always on, and endlessly configurable. It is concurrent—a great computer expression—which means that everything happens in parallel. It is self-configuring, meaning it constantly reconfigures itself on the fly, and increasingly it is also self-organizing, self-architecting, and self-healing

I’m interested in how to measure the value of services produced in this “second economy.”

Finally, China’s adoption of robotics seems to signal something – as in this piece about a totally automatic factor for cell phone parts –

China sets up first unmanned factory; all processes are operated by robots

At the workshop of Changying Precision Technology Company in Dongguan, known as the “world factory”, which manufactures cell phone modules, 60 robot arms at 10 production lines polish the modules day .. The technical staff just sits at the computer and monitors through a central control system… In the plant, all the processes are operated by computer- controlled robots, computer numerical control machining equipment, unmanned transport trucks and automated warehouse equipment.

Forecasting Controversy Swirling Around Computer Models and Forecasts

I am intrigued by Fabius Maximus’ We must rely on forecasts by computer models. Are they reliable?

This is a broad, but deeply relevant, question.

With the increasing prominence of science in public policy debates, the public’s beliefs about theories also have effects. Playing to this larger audience, scientists have developed an effective tool: computer models making bold forecasts about the distant future. Many fields have been affected, such as health care, ecology, astronomy, and climate science. With their conclusions amplified by activists, long-term forecasts have become a powerful lever to change pubic opinion.

It’s true. Large scale computer models are vulnerable to confirmation bias in their construction and selection – example being the testing of drugs. There are issues of measuring their reliability and — more fundamentally — validation (e.g., falsification).

Peer-review has proven quite inadequate to cope with these issues (which lie beyond the concerns about peer-review’s ability to cope with even standard research). A review or audit of a large model often requires over a man-years or more of work by a multidisciplinary team of experts, the kind of audit seldom done even on projects of great public concern.

Of course, FM is sort of famous, in my mind, for their critical attitude toward global warming and climate change.

And they don’t lose an opportunity to score points about climate science, citing the Georgia Institute of Technology scientist Judith Curry.

Dr. Curry is author of a recent WSJ piece The Global Warming Statistical Meltdown

At the recent United Nations Climate Summit, Secretary-General Ban Ki-moon warned that “Without significant cuts in emissions by all countries, and in key sectors, the window of opportunity to stay within less than 2 degrees [of warming] will soon close forever.” Actually, this window of opportunity may remain open for quite some time. A growing body of evidence suggests that the climate is less sensitive to increases in carbon-dioxide emissions than policy makers generally assume—and that the need for reductions in such emissions is less urgent.

A key issue in this furious and emotionally-charged debate is discussed in my September blogpost CO2 Concentrations Spiral Up, Global Temperature Stabilizes – Was Gibst?

..carbon dioxide (CO2) concentrations continue to skyrocket, while global temperature has stabilized since around 2000.

The scientific consensus (excluding Professor Curry and the climate change denial community) is that the oceans currently are absorbing the excess heat, but this cannot continue forever.

If my memory serves me (and I don’t have time this morning to run down the link), backtesting the Global Climate Models (GCM) in a recent IPCC methodology publication basically crashed and burned – but the authors blithely moved on to re-iterate the “consensus.”

At the same time, the real science behind climate change – the ice cores for example retrieved from glacial and snow and ice deposits of long tenure – do show abrupt change may be possible. Within a decade or two, for example, there might be regime shifts in global climate.

I am not going to draw conclusions at this point, wishing to carry on this thread with some discussion of macroeconomic models and forecasting.

But I leave you today with my favorite viewing of Blalog’s “Chasing Ice.”

Forecasting Controversy – the Polar Vortex

Three short, amusing videos to watch while keeping warm as the snow falls in Las Vegas and most other places are plunged into subzero weather.

The Polar Vortex Explained in 2 Minutes from the White House.

This video clip, originally distributed through the Office of Science and Technology Policy, kicked off the controversy.

Rush Limbaugh Response

Rush Limbaugh, always a reliable source on science and general systems theory, says the polar vortex was invented by liberal conspirators to scare folks.

Limbaugh is Full of Hot Air

Weatherman Al Roker fired back at Limbaugh’s ‘Polar Vortex’ Conspiracy, showing a page from his meteorology textbook from way back when, defining the term,”polar vortex.”

But can the Polar Vortex – recognized as a real weather phenomenon for decades – be forecast and is it related to climate change?

Well, this year there was an interesting split between weather forecasting services. As an article reacting to the October 16 release of the NWS Long Range Forecast notes .. the commercial forecasters are telling us to brace for the return of the Arctic air in the U.S. while the federal forecasters have countered by saying another wavy vortex dipping far south is “unlikely.”

Thus, we had NOAA: Another warm winter likely for western U.S., South may see colder weather           .

Well, the National Weather Service and its Canadian counterpart missed the big cold snap in November and the current incursion of artic air to lower lattitudes, due to shifting of the polar vortex.

Accuweather and the Weather Channel, on the other hand, scored big on their forecasts.

At the same time, Internet studies do not show that Accuweather has any leg up in long range forecasting –  snow in New York, for example – beyond a few days from the release of the forecast.

Also, the scientific basis for linking climate change and these polar vortex events is tenuous, or at least multi-factor.

Thus, a recent article in Nature – Weakening of the stratospheric polar vortex by Arctic sea-ice loss – concludes [footnote numbers removed] –

Through a combination of observation-based data analysis and climate model experiments, we provide corroborative evidence for the notion that Arctic sea-ice loss over the B–K seas plays an important role in weakening the stratospheric polar vortex. Regional sea-ice reductions over the B–K seas cause not only in situ surface warming but also significant upper-level responses that exhibit positive geopotential height anomalies over Eastern Europe and negative anomalies from East Asia to the Eastern Pacific along the wave-guide of the tropospheric westerly jet. This anomaly pattern projects heavily into the climatological wave, intensifying the vertical propagation of planetary-scale wave into the stratosphere and, in turn, weakening the stratospheric polar vortex. Therefore, planetary-scale wave generation by sea-ice losses and its upward propagation during early winter months underline the link between surface climate variability and polar stratospheric variability.

The weakened stratospheric polar vortex is often followed by a negative phase of the AO at the surface, favoring cold surface temperatures across Northern Hemisphere continents during the late winter months (Supplementary Fig. 1). Several physical mechanisms for this downward coupling have been proposed. They include the balanced response of the troposphere to stratospheric potential vorticity anomalies and wave-driven changes in the meridional circulation. It is also suggested that the tropospheric response involves changes in the synoptic eddies. However, it has been difficult to isolate the key process, and the detailed nonlinear processes involved are still under investigation21

As a final remark, we note that Arctic sea-ice loss represents only one of the possible factors that can affect the stratospheric polar vortex. Other factors reported in previous works include Eurasian snow cover, the Quasi Biannual Oscillation, the El-Nino and Southern Oscillation and solar activity.

I think it’s probably possible to show – through psychological and historical studies – that human decision-making over risky alternatives is most likely to fail with respect to (a) collective choices over (b) complex outcomes where target events have relatively low probability, although possibly huge costs. This makes the climate change issue and responding appropriately to it hugely difficult.

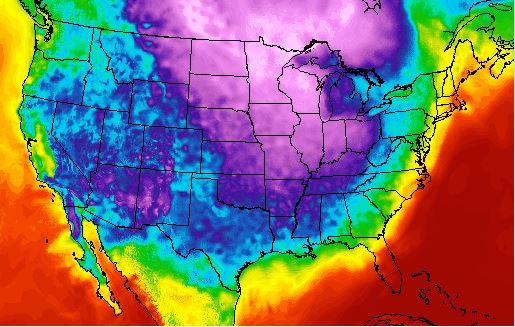
Top image from Medical Daily

Video Friday on Steroids

Here is a list of the URL’s for all the YouTube and other videos shown on this blog from January 2014 through May of this year. I encourage you to shop this list, clicking on the links. There’s a lot of good stuff, including several  instructional videos on machine learning and other technical topics, a series on robotics, and several videos on climate and climate change.

January 2014

The Polar Vortex Explained in Two Minutes

https://www.youtube.com/watch?v=5eDTzV6a9F4

NASA – Six Decades of a Warming Earth

https://www.youtube.com/watch?v=gaJJtS_WDmI

“CHASING ICE” captures largest video calving of glacier

https://www.youtube.com/watch?v=hC3VTgIPoGU

Machine Learning and Econometrics

https://www.youtube.com/watch?v=EraG-2p9VuE

Can Crime Prediction Software Stop Criminals?

https://www.youtube.com/watch?v=s1-pbJKA3H8

Analytics 2013 – Day 1

https://www.youtube.com/watch?v=LsyOLBroVx4

The birth of a salesman

https://www.youtube.com/watch?v=pWM1dR_V7uw

Economies Improve

https://www.youtube.com/watch?v=5_DeCMIig_M

Kaggle – Energy Applications for Machine Learning

https://www.youtube.com/watch?v=mZZFXTUz-nI

2014 Outlook with Jan Hatzius

https://www.youtube.com/watch?v=Ggv0oC8L3Tk

Nassim Taleb Lectures at the NSF

https://www.youtube.com/watch?v=omsYJBMoIJU

Vernon Smith – Experimental Markets

https://www.youtube.com/watch?v=Uncl-wRfoK8


Forecast Pro – Quick Tour

https://www.youtube.com/watch?v=s8jMp5qS8v4

February 2014

Stephen Wolfram’s Introduction to the Wolfram Language

https://www.youtube.com/watch?v=_P9HqHVPeik

Tornados

https://www.youtube.com/watch?v=TEGhgsiNFJ4

Econometrics – Quantile Regression

https://www.youtube.com/watch?v=P9lMmEkXuBw

Quantile Regression Example

https://www.youtube.com/watch?v=qrriFC_WGj8

Brooklyn Grange – A New York Growing Season

http://vimeo.com/86266334

Getting in Shape for the Sport of Data Science

https://www.youtube.com/watch?v=kwt6XEh7U3g

Machine Learning – Decision Trees

https://www.youtube.com/watch?v=-dCtJjlEEgM

Machine Learning – Random Forests

https://www.youtube.com/watch?v=3kYujfDgmNk

Machine Learning – Random Forecasts Applications

https://www.youtube.com/watch?v=zFGPjRPwyFw

Malcolm Gladwell on the 10,000 Hour Rule

https://www.youtube.com/watch?v=XS5EsTc_-2Q

Sornette Talk

https://www.youtube.com/watch?v=Eomb_vbgvpk

Head of India Central Bank Interview

https://www.youtube.com/watch?v=BrVzema7pWE

March 2014

David Stockman

https://www.youtube.com/watch?v=DI718wFmReo

Partial Least Squares Regression

https://www.youtube.com/watch?v=WKEGhyFx0Dg

April 2014

Thomas Piketty on Economic Inequality

https://www.youtube.com/watch?v=qp3AaI5bWPQ

Bonobo builds a fire and tastes marshmellows

https://www.youtube.com/watch?v=GQcN7lHSD5Y

Future Technology

https://www.youtube.com/watch?v=JbQeABIoO6A

May 2014

Ray Kurzweil: The Coming Singularity

https://www.youtube.com/watch?v=1uIzS1uCOcE

Paul Root Wolpe: Kurzweil Critique

https://www.youtube.com/watch?v=qRgMTjTMovc

The Future of Robotics and Artificial Intelligence

https://www.youtube.com/watch?v=AY4ajbu_G3k

Car Factory – KIA Sportage Assembly Line

https://www.youtube.com/watch?v=sjAZGUcjrP8

10 Most Popular Applications for Robots

https://www.youtube.com/watch?v=fH4VwTgfyrQ

Predator Drones

https://www.youtube.com/watch?v=nMh8Cjnzen8

The Future of Robotic Warfare

https://www.youtube.com/watch?v=_atffUtxXtk

Bionic Kangaroo

https://www.youtube.com/watch?v=HUxQM0O7LpQ

Ping Pong Playing Robot

https://www.youtube.com/watch?v=tIIJME8-au8

Baxter, the Industrial Robot

https://www.youtube.com/watch?v=ukehzvP9lqg

Bootstrapping

https://www.youtube.com/watch?v=1OC9ul-1PVg

Links, end of September

Information Technology (IT)

This is how the “Shell Shock” bug imperils the whole internet

It’s a hacker’s wet dream: a software bug discovered in the practically ubiquitous computer program known as “Bash” makes hundreds of millions of computers susceptible to hijacking. The impact of this bug is likely to be higher than that of the Heartbleed bug, which was exposed in April. The National Vulnerability Database, a US government system which tracks information security flaws, gave the bug the maximum score for “Impact” and “Exploitability,” and rated it as simple to exploit.

The bug, which has been labeled “Shell Shock” by security experts, affects computers running Unix-based operating systems like Mac OS X and Linux. That means most of the internet: according to a September survey conducted by Netcraft, a British internet services company, just 13% of the busiest one million websites use Microsoft web servers. Almost everyone else likely serves their website via a Unix operating system that probably uses Bash.

Microsoft’s Bing Predicts correctly forecasted the Scottish Independence Referendum vote

Bing Predicts was beta tested in the UK for this referendum. The prediction engine uses machine-learning models to analyse and detect patterns from a range of big data sources such as the web and social activity in order to make accurate predictions about the outcome of events.

Bing got the yes/no vote right, but missed the size of the vote to stay united with England, Wales, and Northern Ireland.

Is the profession of science broken (a possible cause of the great stagnation)? Fascinating discussion which mirrors many friends’ comments that too much time is taken up applying for and administering grants, and not enough time is left for the actual research, for unconventional ideas.

What has changed is the bureaucratic culture. The increasing interpenetration of government, university, and private firms has led everyone to adopt the language, sensibilities, and organizational forms that originated in the corporate world. Although this might have helped in creating marketable products, since that is what corporate bureaucracies are designed to do, in terms of fostering original research, the results have been catastrophic.

Climate

Climate Science Is Not Settled The Wall Street Journal piece by a former Obama adviser and BP scientist inflamed the commentariat, after publication September 16, on the eve of the big climate talks and march in New York City. See On eve of climate march, Wall Street Journal publishes call to wait and do nothing for a critical perspective.

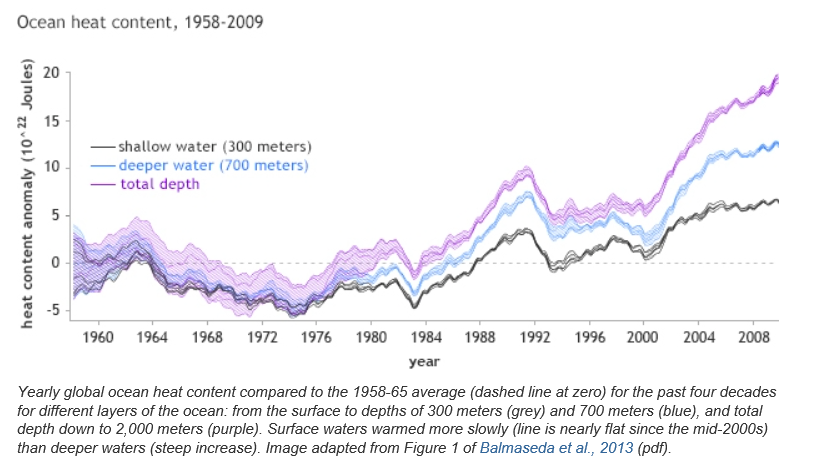
This chart, from NOAA, is one key – showing the divergence in heat stored in various layers of the oceans –

oceanheat

Nicholas Stern: The state of the climate — and what we might do about it TED talk.

Ebola

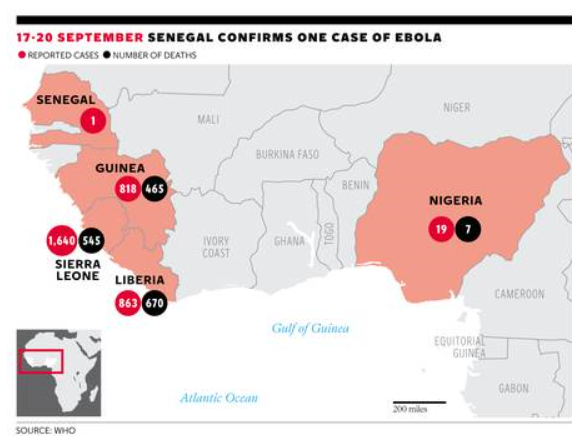
The public response to the Ebola epidemic is ramping up, but the situation is still dire and total cases and deaths are still increasing exponentially.

Ebola outbreak: Death toll passes 3,000 as WHO warns numbers are ‘vastly underestimated’

“The Ebola epidemic ravaging parts of West Africa is the most severe acute public health emergency seen in modern times.Never before in recorded history has a biosafety level four pathogen infected so many people so quickly, over such a broad geographical area, for so long.”

 ebolamap 

Global Economy

What Does a ‘Good’ Chinese Adjustment Look Like? Michael Pettis argues that what some see as a “soft landing” is in fact a preparation for later financial collapse. Instead, based on an intricate argument regarding interest rates and the nominal GDP growth rates in China, he proposes a reduction in Chinese GDP growth going forward through control of credit – in order to rebalance the Chinese consumer economy. Pettis is to my way of thinking always relevant, and often brilliant in the way he makes his analysis.

What Went Wrong? Russia Sanctions, EU, and the Way Out

Washington, Brussels and Moscow are in a vicious circle, which would spare none of them and which has potential to undermine global recovery.

Venture Capital

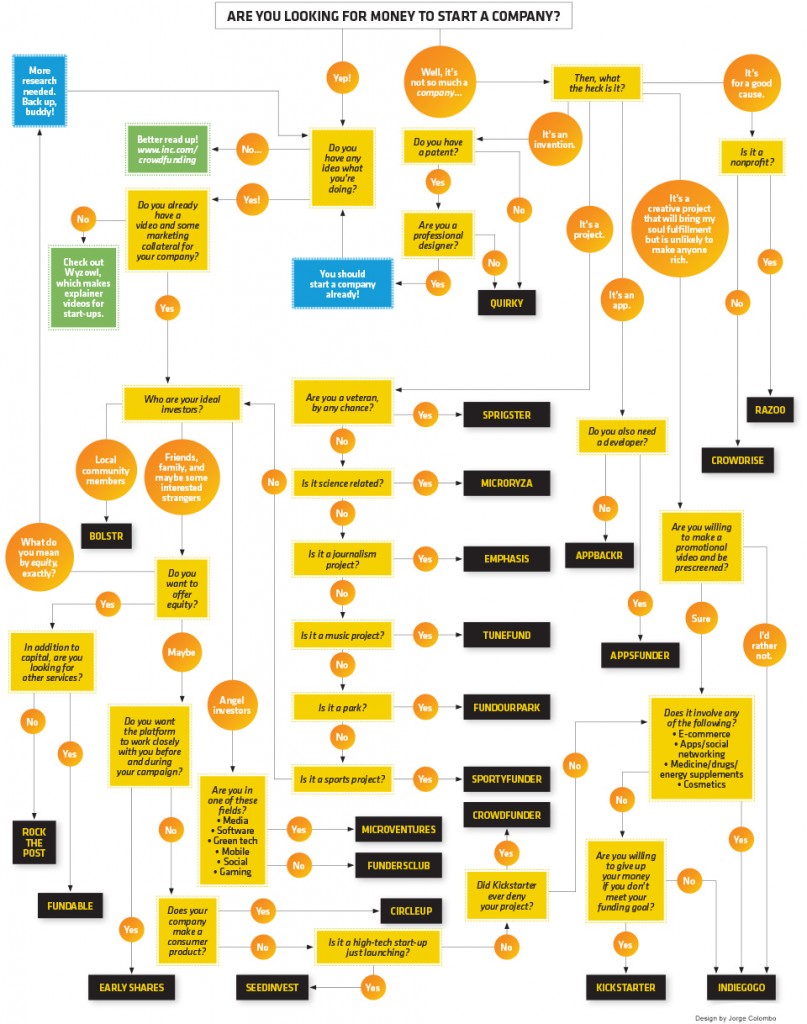
22 Crowdfunding Sites (and How To Choose Yours!)

inc-magazine-crowdfunding-infographic-june-2013_26652

CO2 Concentrations Spiral Up, Global Temperature Stabilizes – Was Gibst?

Predicting global temperature is challenging. This is not only because climate and weather are complex, but because carbon dioxide (CO2) concentrations continue to skyrocket, while global temperature has stabilized since around 2000.

Changes in Global Mean Temperature

The NASA Goddard Institute for Space Studies maintains extensive and updated charts on global temperature.

globalmeantempdelta

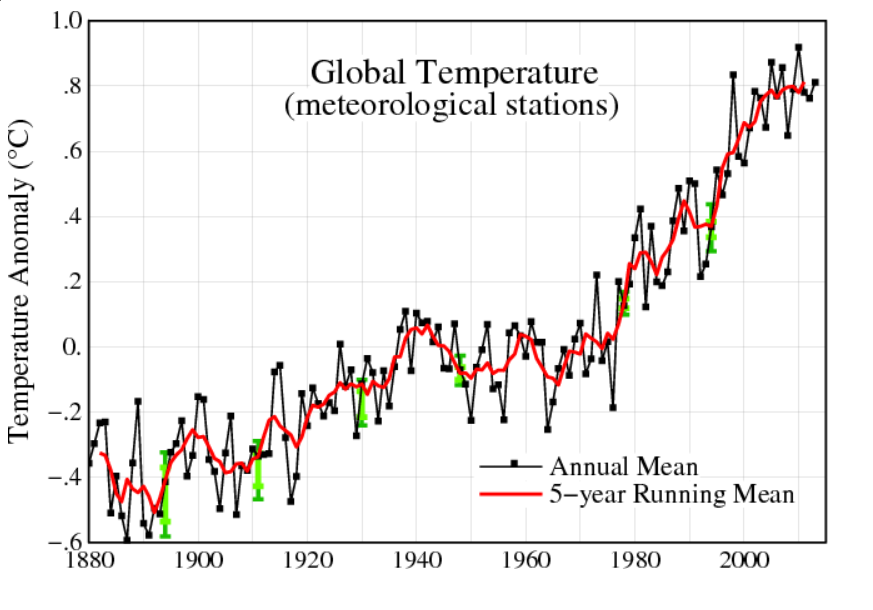
The chart for changes annual mean global temperature is compiled from weather stations from around the planet.

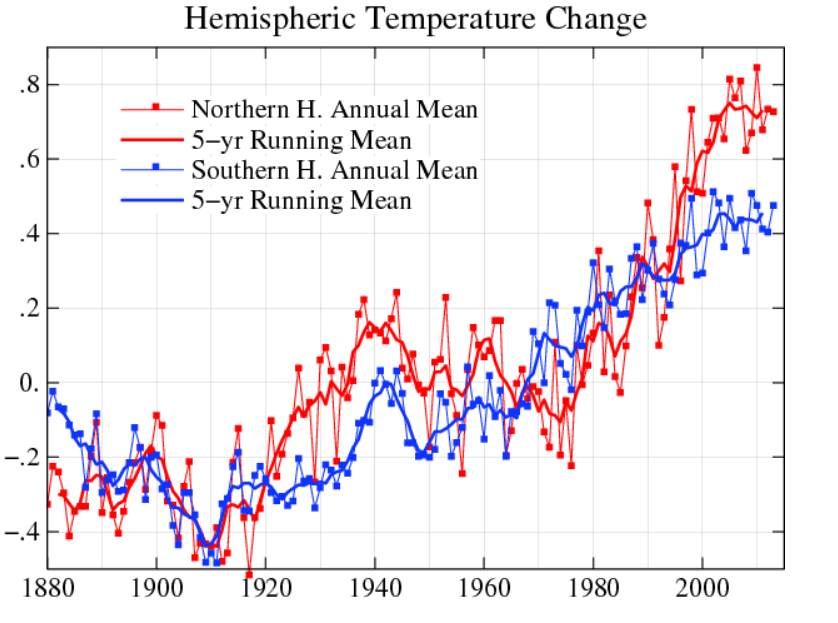
There is also hermispheric variation, with the northern hemisphere showing more increases than the southern hemisphere.

hemi

At the same time, observations of the annual change in mean temperature have stabilized since around 2000, as the five year moving averages show.

Atmospheric Carbon Dioxide Concentrations

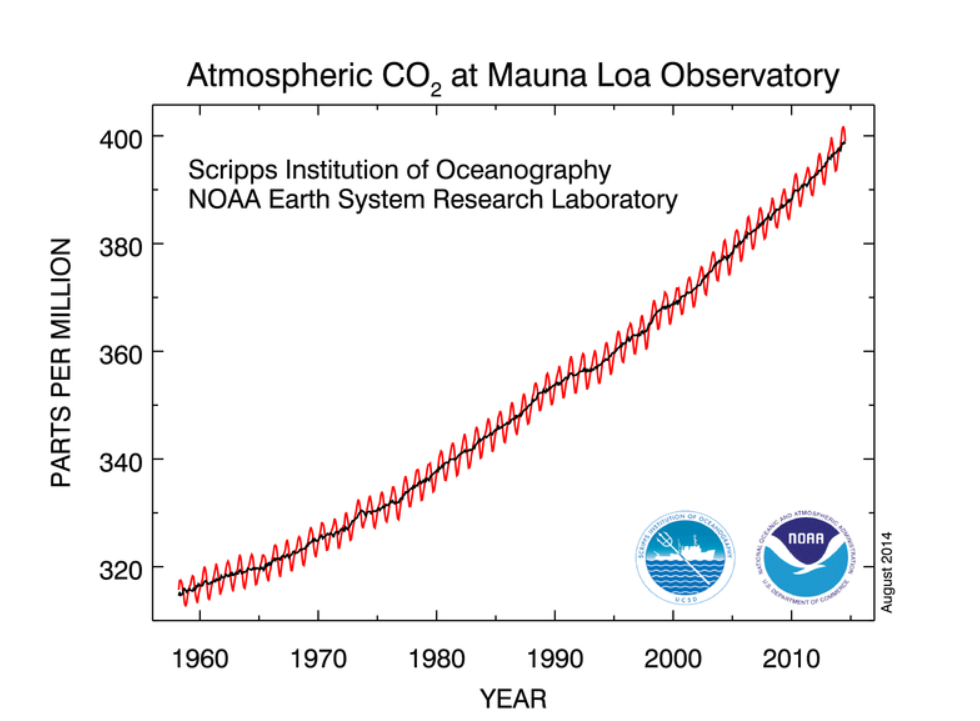
The National Oceanic and Atmospheric Administration (NOAA) maintains measurements of atmospheric carbon dioxide taken in Hawaii at Mauna Loa. These show continual increase since the measurements were first initiated in the late 1950’s.

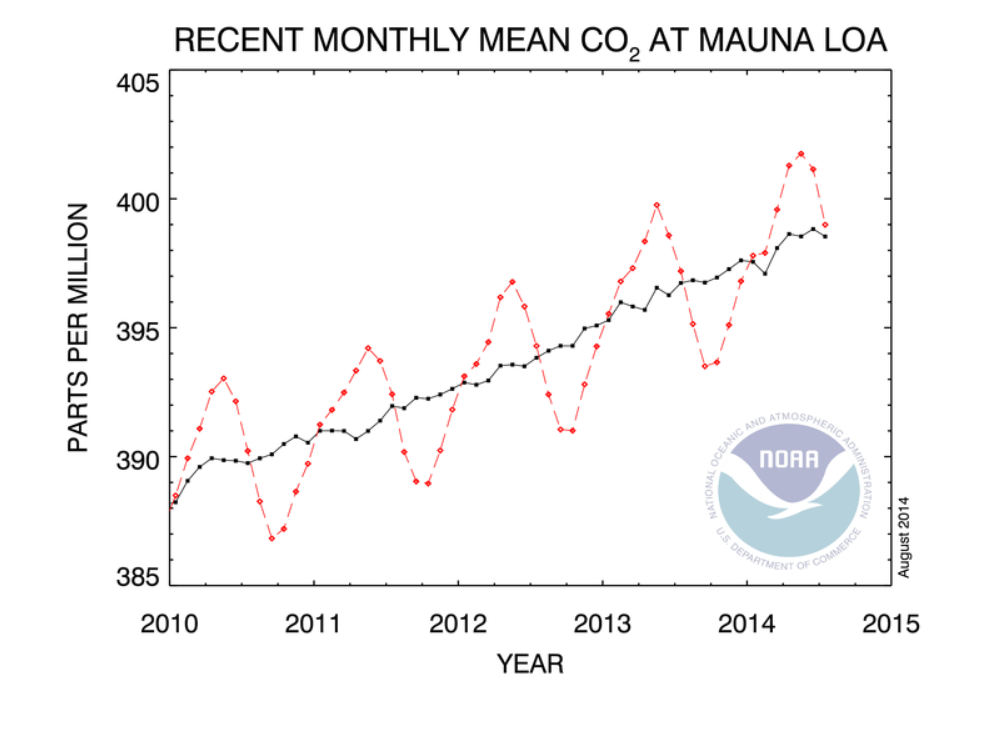
Here’s a chart showing recent monthly measurements, highlighting the consistent seasonal pattern and strong positive trend since 2010.

Maunaloa1

Here’s all the data. The black line in both charts represents the seasonally corrected trend.

Maunaloa2

A Forecasting Problem

This is a big problem for anyone interested in predicting the future trajectory of climate.

So, according to these measurements on Mauna Loa, carbon dioxide concentrations in the atmosphere have been increasing monotonically (with seasonal variation) since 1958, when measurements first began. Yet global temperatures have not increased on a clear trend since around 2000.

I want to comment in detail sometime on the forecasting controversies that have swirled around these types of measurements and their interpretation, but here let me just suggest the outlines of the problem.

So, it’s clear that the relationship between atmospheric CO2 concentrations and global temperature is not linear, or that there are major intervening variables. Cloud cover may increase with higher temperatures, due to more evaporation. The oceans are still warming, so maybe they are absorbing the additional heat. Perhaps there are other complex feedback processes involved.

However, if my reading of the IPCC literature is correct, these suggestions are still anecdotal, since the big systems models seem quite unable to account for this trajectory of temperature – or at least, recent data appear as outliers.

So there you have it. As noted in earlier posts here, global population is forecast to increase by perhaps one billion by 2030. Global output, even given uncertain impacts of coming recessions, may grow to $150 trillion dollars by 2030. Emissions of greenhouse gases, including but not limited to CO2 also will increase – especially given the paralyzing impacts of the current “pause in global warming” on coordinated policy responses. Deforestation is certainly a problem in this context, although we have not here reviewed the prospects.

One thing to note, however, is that the first two charts presented above trace out changes in global mean temperature by year. The actual level of global mean temperature surged through the 1990’s and remains high. That mean that ice caps are melting, and various processes related to higher temperatures are currently underway.

Climate Change by 2030

Is climate change real? Is it predictable? How much warming can we expect by 2020 and then by 2030 in a business as usual scenario? How bad can it get? What about mitigation? Is there any credibility to the loud protestations of the climate change deniers? What about the so-called hockey stick and the exchange of sinister emails?

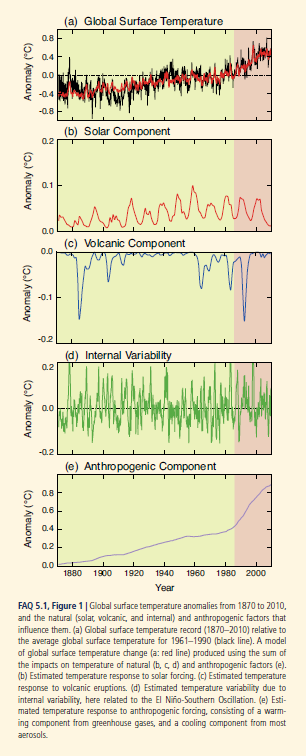
The Fifth Assessment Report of the Intergovernmental Panel on Climate Change (IPCC) addresses some of these questions. Its section The Physical Science Basis, which collates contributions of 250 scientists, contains this interesting graphic (click to enlarge) showing the upward trend in global temperature and the importance of the anthropogenic component, along with contributions from fluctuations in solar intensity and volcanic activity.

IPCCtemp

The Hockey Stick

Paleoclimate studies, also documented in this report, are the basis for the famous (notorious) hockey stick chart of long term global temperatures.

I was surprised to read, in catching up on this controversy, that the climate scientist Michael Mann who originated this chart has been totally vindicated (See The Hockey Stick: The Most Controversial Chart in Science, Explained).

Currently, scientific evidence suggests,

… present-day (2011) concentrations of the atmospheric greenhouse gases (GHGs) carbon dioxide (CO2), methane (CH4) and nitrous oxide (N2O) exceed the range of concentrations recorded in ice cores during the past 800,000 years. Past changes in atmospheric GHG concentrations can be determined with very high confidence1 from polar ice cores. Since AR4 these records have been extended from 650,000 years to 800,000 years ago.

The Drumbeat

In preparation for a September 23 summit, the UN has commissioned videos of weather forecasters supposedly announcing dire droughts, floods, and other weather catastrophes in 2050.

The IPCC also has videos. I include two – one on the physical science basis and the second on mitigation.

IPCC video 2013 –The Physical Science Basis

Climate summit 2014 – Mitigation

I personally am persuaded by the basic physics involved. As global GDP rises, so will energy consumption (although the details of this need to be examined carefully – conservation and change of technology can make big differences). In any case, more carbon dioxide and other similar gases will increase the greenhouse effect, raising global temperatures. It’s a good idea to call this climate change, rather than global warming, however, since volatility of weather patterns is a main result. There will be more climatic extremes, more droughts, but also more precipitation and flooding. Additionally, there could be changes in regional weather and climate patterns which could wreak havoc with the current distribution of population over geographic space. More rapid desertification is likely, and, of course, melting of glacial and polar ice will result in increases in sea level. And, as IPCC reports document, a lot of this is already happening.

There are, however, several problems that offer intellectual grounds for stalling the type of economic sacrifice that probably will be necessary to slow or reduce emissions.

First, there is the complexity of the evidence and argument, an issue flagged by Nate Silver recently. Secondly, there is the problem that, despite increases in greenhouse gas emissions after the turn of the century, there has been some leveling of global temperature increase, according to some metrics. Finally, there is the related problem of whether current climate models predict the recent past, whether they “retrodict.”

I’d like to address these issues or problems in a future post, along with my take on these projections or forecasts for 2020 and 2030.

Links – early July 2014

While I dig deeper on the current business outlook and one or two other issues, here are some links for this pre-Fourth of July week.

Predictive Analytics

A bunch of papers about the widsom of smaller, smarter crowds I think the most interesting of these (which I can readily access) is Identifying Expertise to Extract the Wisdom of Crowds which develops a way by eliminating poorly performing individuals from the crowd to improve the group response.

Application of Predictive Analytics in Customer Relationship Management: A Literature Review and Classification From the Proceedings of the Southern Association for Information Systems Conference, Macon, GA, USA March 21st–22nd, 2014. Some minor problems with writing English in the article, but solid contribution.

US and Global Economy

Nouriel Roubini: There’s ‘schizophrenia’ between what stock and bond markets tell you Stocks tell you one thing, but bond yields suggest another. Currently, Roubini is guardedly optimistic – Eurozone breakup risks are receding, US fiscal policy is in better order, and Japan’s aggressively expansionist fiscal policy keeps deflation at bay. On the other hand, there’s the chance of a hard landing in China, trouble in emerging markets, geopolitical risks (Ukraine), and growing nationalist tendencies in Asia (India). Great list, and worthwhile following the links.

The four stages of Chinese growth Michael Pettis was ahead of the game on debt and China in recent years and is now calling for reduction in Chinese growth to around 3-4 percent annually.

Because of rapidly approaching debt constraints China cannot continue what I characterize as the set of “investment overshooting” economic polices for much longer (my instinct suggests perhaps three or four years at most). Under these policies, any growth above some level – and I would argue that GDP growth of anything above 3-4% implies almost automatically that “investment overshooting” policies are still driving growth, at least to some extent – requires an unsustainable increase in debt. Of course the longer this kind of growth continues, the greater the risk that China reaches debt capacity constraints, in which case the country faces a chaotic economic adjustment.

Politics

Is This the Worst Congress Ever? Barry Ritholtz decries the failure of Congress to lower interest rates on student loans, observing –

As of July 1, interest on new student loans rises to 4.66 percent from 3.86 percent last year, with future rates potentially increasing even more. This comes as interest rates on mortgages and other consumer credit hovered near record lows. For a comparison, the rate on the 10-year Treasury is 2.6 percent. Congress could have imposed lower limits on student-loan rates, but chose not to.

This is but one example out of thousands of an inability to perform the basic duties, which includes helping to educate the next generation of leaders and productive citizens. It goes far beyond partisanship; it is a matter of lack of will, intelligence and ability.

Hear, hear.

Climate Change

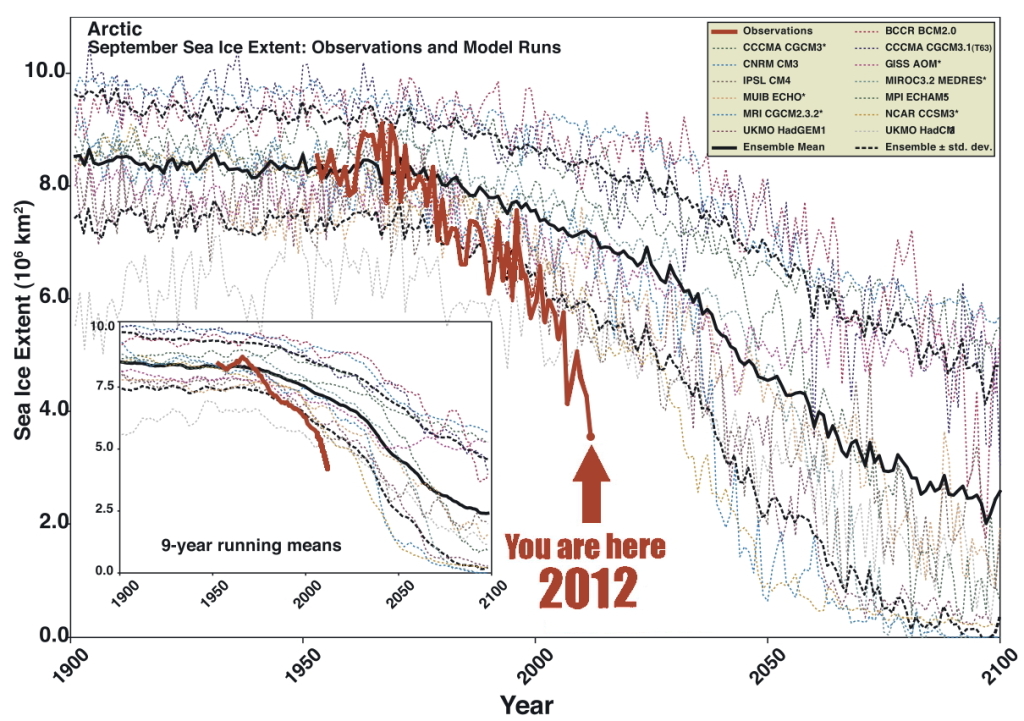
Climate news: Arctic seafloor methane release is double previous estimates, and why that matters This is a ticking time bomb. Article has a great graphic (shown below) which contrasts the projections of loss of Artic sea ice with what actually is happening – underlining that the facts on the ground are outrunning the computer models. Methane has more than an order of magnitude more global warming impact that carbon dioxide, per equivalent mass.

ArcticSeaIce

Dahr Jamail | Former NASA Chief Scientist: “We’re Effectively Taking a Sledgehammer to the Climate System”

I think the sea level rise is the most concerning. Not because it’s the biggest threat, although it is an enormous threat, but because it is the most irrefutable outcome of the ice loss. We can debate about what the loss of sea ice would mean for ocean circulation. We can debate what a warming Arctic means for global and regional climate. But there’s no question what an added meter or two of sea level rise coming from the Greenland ice sheet would mean for coastal regions. It’s very straightforward.

Machine Learning

EG

Computer simulating 13-year-old boy becomes first to pass Turing test A milestone – “Eugene Goostman” fooled more than a third of the Royal Society testers into thinking they were texting with a human being, during a series of five minute keyboard conversations.

The Milky Way Project: Leveraging Citizen Science and Machine Learning to Detect Interstellar Bubbles Combines Big Data and crowdsourcing.

LInks – late May

US and Global Economic Prospects

Goldman’s Hatzius: Rationale for Economic Acceleration Is Intact

We currently estimate that real GDP fell -0.7% (annualized) in the first quarter, versus a December consensus estimate of +2½%. On the face of it, this is a large disappointment. It raises the question whether 2014 will be yet another year when initially high hopes for growth are ultimately dashed.

 Today we therefore ask whether our forecast that 2014-2015 will show a meaningful pickup in growth relative to the first four years of the recovery is still on track. Our answer, broadly, is yes. Although the weak first quarter is likely to hold down real GDP for 2014 as a whole, the underlying trends in economic activity are still pointing to significant improvement….

 The basic rationale for our acceleration forecast of late 2013 was twofold—(1) an end to the fiscal drag that had weighed on growth so heavily in 2013 and (2) a positive impulse from the private sector following the completion of the balance sheet adjustments specifically among US households. Both of these points remain intact.

Economy and Housing Market Projected to Grow in 2015

Despite many beginning-of-the-year predictions about spring growth in the housing market falling flat, and despite a still chugging economy that changes its mind quarter-to-quarter, economists at the National Association of Realtors and other industry groups expect an uptick in the economy and housing market through next year.

The key to the NAR’s optimism, as expressed by the organization’s chief economist, Lawrence Yun, earlier this week, is a hefty pent-up demand for houses coupled with expectations of job growth—which itself has been more feeble than anticipated. “When you look at the jobs-to-population ratio, the current period is weaker than it was from the late 1990s through 2007,” Yun said. “This explains why Main Street America does not fully feel the recovery.”

Yun’s comments echo those in a report released Thursday by Fitch Ratings and Oxford Analytica that looks at the unusual pattern of recovery the U.S. is facing in the wake of its latest major recession. However, although the U.S. GDP and overall economy have occasionally fluctuated quarter-to-quarter these past few years, Yun said that there are no fresh signs of recession for Q2, which could grow about 3 percent.

Report: San Francisco has worse income inequality than Rwanda

If San Francisco was a country, it would rank as the 20th most unequal nation on Earth, according to the World Bank’s measurements.

Googlebus

Climate Change

When Will Coastal Property Values Crash And Will Climate Science Deniers Be The Only Buyers?

sea

How Much Will It Cost to Solve Climate Change?

Switching from fossil fuels to low-carbon sources of energy will cost $44 trillion between now and 2050, according to a report released this week by the International Energy Agency.

Natural Gas and Fracking

How The Russia-China Gas Deal Hurts U.S. Liquid Natural Gas Industry

This could dampen the demand – and ultimately the price for – LNG from the United States. East Asia represents the most prized market for producers of LNG. That’s because it is home to the top three importers of LNG in the world: Japan, South Korea and China. Together, the three countries account for more than half of LNG demand worldwide. As a result, prices for LNG are as much as four to five times higher in Asia compared to what natural gas is sold for in the United States.

The Russia-China deal may change that.

If LNG prices in Asia come down from their recent highs, the most expensive LNG projects may no longer be profitable. That could force out several of the U.S. LNG projects waiting for U.S. Department of Energy approval. As of April, DOE had approved seven LNG terminals, but many more are waiting for permits.

LNG terminals in the United States will also not be the least expensive producers. The construction of several liquefaction facilities in Australia is way ahead of competitors in the U.S., and the country plans on nearly quadrupling its LNG capacity by 2017. More supplies and lower-than-expected demand from China could bring down prices over the next several years.

Write-down of two-thirds of US shale oil explodes fracking mythThis is big!

Next month, the US Energy Information Administration (EIA) will publish a new estimate of US shale deposits set to deal a death-blow to industry hype about a new golden era of US energy independence by fracking unconventional oil and gas.

EIA officials told the Los Angeles Times that previous estimates of recoverable oil in the Monterey shale reserves in California of about 15.4 billion barrels were vastly overstated. The revised estimate, they said, will slash this amount by 96% to a puny 600 million barrels of oil.

The Monterey formation, previously believed to contain more than double the amount of oil estimated at the Bakken shale in North Dakota, and five times larger than the Eagle Ford shale in South Texas, was slated to add up to 2.8 million jobs by 2020 and boost government tax revenues by $24.6 billion a year.

China

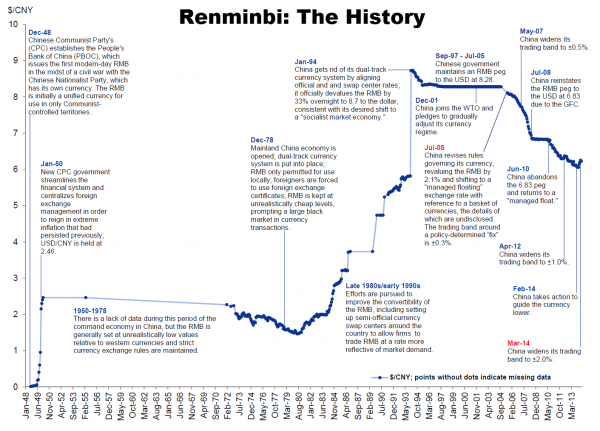
The Annotated History Of The World’s Next Reserve Currency

yuanhistory

Goldman: Prepare for Chinese property bust

…With demand poised to slow given a tepid economic backdrop, weaker household affordability, rising mortgage rates and developer cash flow weakness, we believe current construction capacity of the domestic property industry may be excessive. We estimate an inventory adjustment cycle of two years for developers, driving 10%-15% price cuts in most cities with 15% volume contraction from 2013 levels in 2014E-15E. We also expect M&A activities to take place actively, favoring developers with strong balance sheet and cash flow discipline.

China’s Shadow Banking Sector Valued At 80% of GDP

The China Banking Regulatory Commission has shed light on the country’s opaque shadow banking sector. It was as large as 33 trillion yuan ($5.29 trillion) in mid-2013 and equivalent to 80% of last year’s GDP, according to Yan Qingmin, a vice chairman of the commission.

In a Tuesday WeChat blog sent by the Chong Yang Institute for Financial Studies, Renmin University, Yan wrote that his calculation is based on shadow lending activities from asset management businesses to trust companies, a definition he said was very broad.  Yan said the rapid expansion of the sector, which was equivalent to 53% of GDP in 2012, entailed risks of some parts of the shadow banking business, but not necessarily the Chinese economy.

Yan’s estimation is notably higher than that of the Chinese Academy of Social Sciences. The government think tank said on May 9 that the sector has reached 27 trillion yuan ($4.4 trillion in 2013) and is equivalent to nearly one fifth of the domestic banking sector’s total assets.

Massive, Curvaceous Buildings Designed to Imitate a Mountain Forest

Chinamassive

Information Technology (IT)

I am an IT generalist. Am I doomed to low pay forever? Interesting comments and suggestions to this question on a Forum maintained by The Register.

I’m an IT generalist. I know a bit of everything – I can behave appropriately up to Cxx level both internally and with clients, and I’m happy to crawl under a desk to plug in network cables. I know a little bit about how nearly everything works – enough to fill in the gaps quickly: I didn’t know any C# a year ago, but 2 days into a project using it I could see the offshore guys were writing absolute rubbish. I can talk to DB folks about their DBs; network guys about their switches and wireless networks; programmers about their code and architects about their designs. Don’t get me wrong, I can do as well as talk, programming, design, architecture – but I would never claim to be the equal of a specialist (although some of the work I have seen from the soi-disant specialists makes me wonder whether I’m missing a trick).

My principle skill, if there is one – is problem resolution, from nitty gritty tech details (performance and functionality) to handling tricky internal politics to detoxify projects and get them moving again.

How on earth do I sell this to an employer as a full-timer or contractor? Am I doomed to a low income role whilst the specialists command the big day rates? Or should I give up on IT altogether

Crowdfunding is brutal… even when it works

China bans Windows 8

China has banned government use of Windows 8, Microsoft Corp’s latest operating system, a blow to a US technology company that has long struggled with sales in the country.

The Central Government Procurement Center issued the ban on installing Windows 8 on Chinese government computers as part of a notice on the use of energy-saving products, posted on its website last week.

Data Analytics

Statistics of election irregularities – good forensic data analytics.