Category Archives: many predictors

Primer on Method – Some Perspectives from 2014

As Hal Varian writes in his popular Big Data: New Tricks for Econometrics the wealth of data now available to researchers demands new techniques of analysis.

In particular, often there is the problem of “many predictors.” In classic regression, the number of observations is assumed to exceed the number of explanatory variables. This obviously is challenged in the Big Data context.

Variable selection procedures are one tactic in this situation.

Readers may want to consult the post Selecting Predictors. It has my list of methods, as follows:

  1. Forward Selection. Begin with no candidate variables in the model. Select the variable that boosts some goodness-of-fit or predictive metric the most. Traditionally, this has been R-Squared for an in-sample fit. At each step, select the candidate variable that increases the metric the most. Stop adding variables when none of the remaining variables are significant. Note that once a variable enters the model, it cannot be deleted.
  2. Backward Selection. This starts with the superset of potential predictors and eliminates variables which have the lowest score by some metric – traditionally, the t-statistic.
  3. Stepwise regression. This combines backward and forward selection of regressors.
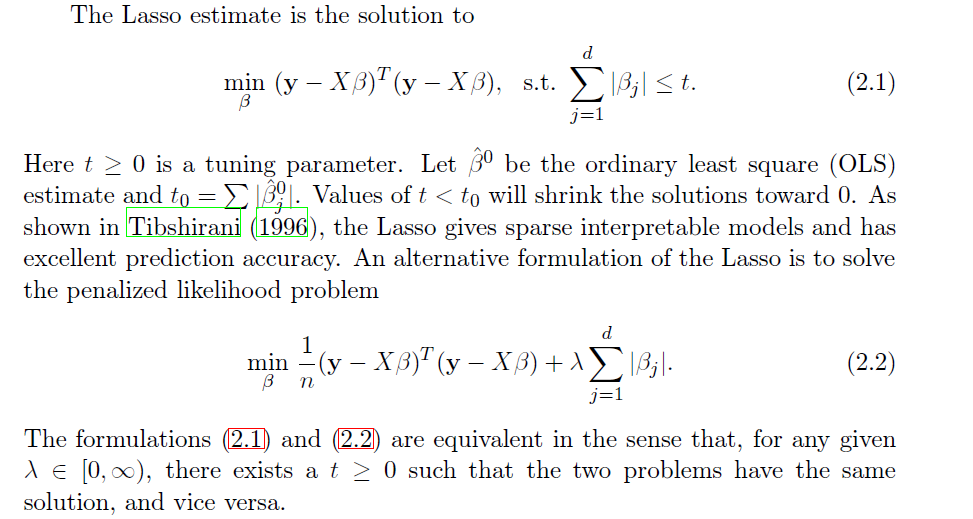
  4. Regularization and Selection by means of the LASSO. Here is the classic article and here is a post in this blog on the LASSO.
  5. Information criteria applied to all possible regressions – pick the best specification by applying the Aikaike Information Criterion (AIC) or Bayesian Information Criterion (BIC) to all possible combinations of regressors. Clearly, this is only possible with a limited number of potential predictors.
  6. Cross-validation or other out-of-sample criteria applied to all possible regressions– Typically, the error metrics on the out-of-sample data cuts are averaged, and the lowest average error model is selected out of all possible combinations of predictors.
  7. Dimension reduction or data shrinkage with principal components. This is a many predictors formulation, whereby it is possible to reduce a large number of predictors to a few principal components which explain most of the variation in the data matrix.
  8. Dimension reduction or data shrinkage with partial least squares. This is similar to the PC approach, but employs a reduction to information from both the set of potential predictors and the dependent or target variable.

Some more supporting posts are found here, usually with spreadsheet-based “toy” examples:

Three Pass Regression Filter, Partial Least Squares and Principal Components, Complete Subset Regressions, Variable Selection Procedures – the Lasso, Kernel Ridge Regression – A Toy Example, Dimension Reduction With Principal Components, bootstrapping, exponential smoothing, Estimation and Variable Selection with Ridge Regression and the LASSO

Plus one of the nicest infographics on machine learning – a related subject – is developed by the Australian blog Machine Learning Mastery.

MachineLearning

Dimension Reduction With Principal Components

The method of principal components regression has achieved new prominence in machine learning, data reduction, and forecasting over the last decade.

It’s highly relevant in the era of Big Data, because it facilitates analyzing “fat” or wide databases. Fat databases have more predictors than observations. So you might have ten years of monthly data on sales, but 1000 potential predictors, meaning your database would be 120 by 1001 – obeying here the convention of stating row depth first and the number of columns second.

After a brief discussion of these Big Data applications and some elements of principal components, I illustrate dimension reduction with a violent crime database from the UC Irvine Machine Learning Repository.

Dynamic Factor Models

In terms of forecasting, a lot of research over the past decade has focused on “many predictors” and reducing the dimensionality of “fat” databases. Key names are James Stock and Mark Watson (see also) and Bai.

Stock and Watson have a white paper that has been updated several times, which can be found in PDF format at this link

stock watson generalized shrinkage June _2012.pdf

They write in the June 2012 update,

We find that, for most macroeconomic time series, among linear estimators the DFM forecasts make efficient use of the information in the many predictors by using only a small number of estimated factors. These series include measures of real economic activity and some other central macroeconomic series, including some interest rates and monetary variables. For these series, the shrinkage methods with estimated parameters fail to provide mean squared error improvements over the DFM. For a small number of series, the shrinkage forecasts improve upon DFM forecasts, at least at some horizons and by some measures, and for these few series, the DFM might not be an adequate approximation. Finally, none of the methods considered here help much for series that are notoriously difficult to forecast, such as exchange rates, stock prices, or price inflation.

Here DFM refers to dynamic factor models, essentially principal components models which utilize PC’s for lagged data.

Note also that this type of autoregressive or classical time series approach does not work well, in Stock and Watson’s judgment, for “series that are notoriously difficult to forecast, such as exchange rates, stock prices, or price inflation.”

Presumably, these series are closer to being random walks in some configuration.

Intermediate Level Concepts

Essentially, you can take any bundle of data and compute the principal components. If you mean-center and (in most cases) standardize the data, the principal components divide up the variance of this data, based on the size of their associated eigenvalues. The associated eigenvectors can be used to transform the data into an equivalent and same size set of orthogonal vectors. Really, the principal components operate to change the basis of the data, transforming it into an equivalent representation, but one in which all the variables have zero correlation with each other.

The Wikipaedia article on principal components is useful, but there is no getting around the fact that principal components can only really be understood with matrix algebra.

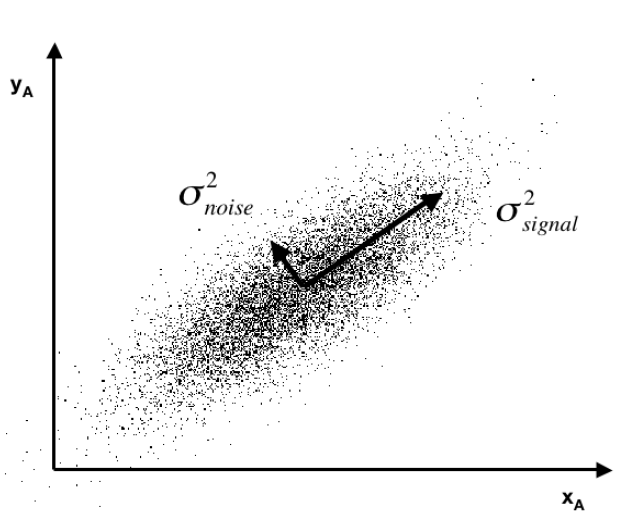
Often you see a diagram, such as the one below, showing a cloud of points distributed around a line passing through the origin of a coordinate system, but at an acute angle to those coordinates.

pcpic

This illustrates dimensionality reduction with principal components. If we express all these points in terms of this rotated set of coordinates, one of these coordinates – the signal – captures most of the variation in the data. Projections of the datapoints onto the second principal component, therefore, account for much less variance.

Principal component regression characteristically specifies only the first few principal components in the regression equation, knowing that, typically, these explain the largest portion of the variance in the data.

An Application to Crime Data

Looking for some non-macroeconomic data to illustrate principal components (PC) regression, I found the Communities and Crime Data Set in the University of California at Irving Machine Learning Repository.

The data do not illustrate “many predictors” in the sense of more predictors than observations.

Here, the crime and other data comprise 128 variables, including a violent crime variable, which are collated for 1994 cities. That is, there are more observations than predictors.

The variables included in the dataset involve the community, such as the percent of the population considered urban, and the median family income, and involving law enforcement, such as per capita number of police officers, and percent of officers assigned to drug units. The per capita violent crimes variable was calculated using population and the sum of crime variables considered violent crimes in the United States: murder, rape, robbery, and assault.

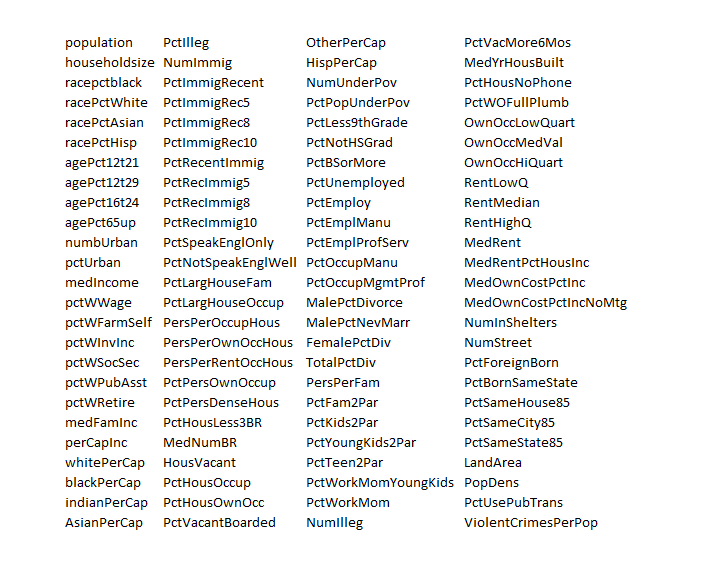
I standardize the data, dropping variables with a lot of missing values. That leaves me 100 variables, including the violent crime metric.

This table gives you a flavor of the variables included – you have to interpret the abbreviations

crime

I developed a comparison of OLS regression with principal components regression, finding that principal component regression can outperform OLS in out-of-sample predictions of violent crimes per capita.

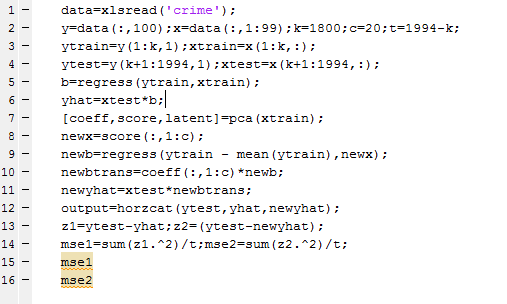
The Matlab program to carry out this analysis is as follows:

Matalbp

So I used a training set of 1800 cities, and developed OLS and PC regressions to predict violent crime per capita in the remaining 194 cities.  I calculate the  principal components (coeff) from a training set (xtrain) comprised of the first 1800 cities. Then, I select the first twenty pc’s  and translate them back to weightings on all 99 variables for application to the test set (xtest). I also calculate OLS regression coefficients on xtrain.

The mean square prediction error (mse1) of the OLS regression was 0.35 and the mean square prediction error (mse2) of the PC regression was 0.34 – really a marginal difference but large enough to make the point.

What’s really interesting is that I had to use the first twenty (20) principal components to achieve this improvement. Thus, this violent crime database has a quite diverse characteristic, compared with many socioeconomic datasets I have seen, where, as noted above, the first few principal components explain most of the variation in the data.

This method – PC regression – is especially good when there are predictors which are closely correlated (“multicollinearity”) as often is the case with market research surveys of consumer attitudes and income and wealth variables.

The bottom line here is that principal compoments can facilitate data reduction or regression regularization. Quite often, this can improve the prediction capabilities of a regression, when compared with an OLS regression using all the variables. The PC regression assigns higher weights to the most important predictors, in effect performing a kind of variable selection – although the coefficients or pc’s may not zero out variables per se.

I am continuing to work on this data with an eye to implementing k-fold cross-validation as a way of estimating the optimal number of principal components which should be used in the PC regressions.

Medical/Health Predictive Analytics – Logistic Regression

The case for assessing health risk with logistic regression is made by authors of a 2009 study, which is also a sort of model example for Big Data in diagnostic medicine.

As the variables that help predict breast cancer increase in number, physicians must rely on subjective impressions based on their experience to make decisions. Using a quantitative modeling technique such as logistic regression to predict the risk of breast cancer may help radiologists manage the large amount of information available, make better decisions, detect more cancers at early stages, and reduce unnecessary biopsies

This study – A Logistic Regression Model Based on the National Mammography Database Format to Aid Breast Cancer Diagnosis  – pulled together 62,219 consecutive mammography records from 48,744 studies in 18,270 patients reported using the Breast Imaging Reporting and Data System (BI-RADS) lexicon and the National Mammography Database format between April 5, 1999 and February 9, 2004.

The combination of medical judgment and an algorithmic diagnostic tool based on extensive medical records is, in the best sense, the future of medical diagnosis and treatment.

And logistic regression has one big thing going for it – a lot of logistic regressions have been performed to identify risk factors for various diseases or for mortality from a particular ailment.

A logistic regression, of course, maps a zero/one or categorical variable onto a set of explanatory variables.

This is not to say that there are not going to be speedbumps along the way. Interestingly, these are data science speedbumps, what some would call statistical modeling issues.

Picking the Right Variables, Validating the Logistic Regression

The problems of picking the correct explanatory variables for a logistic regression and model validation are linked.

The problem of picking the right predictors for a logistic regression is parallel to the problem of picking regressors in, say, an ordinary least squares (OLS) regression with one or two complications. You need to try various specifications (sets of explanatory variables) and utilize a raft of diagnostics to evaluate the different models. Cross-validation, utilized in the breast cancer research mentioned above, is probably better than in-sample tests. And, in addition, you need to be wary of some of the weird features of logistic regression.

A survey of medical research from a few years back highlights the fact that a lot of studies shortcut some of the essential steps in validation.

A Short Primer on Logistic Regression

I want to say a few words about how the odds-ratio is the key to what logistic regression is all about.

Logistic regression, for example, does not “map” a predictive relationship onto a discrete, categorical index, typically a binary, zero/one variable, in the same way ordinary least squares (OLS) regression maps a predictive relationship onto dependent variables. In fact, one of the first things one tends to read, when you broach the subject of logistic regression, is that, if you try to “map” a binary, 0/1 variable onto a linear relationship β01x12x2 with OLS regression, you are going to come up against the problem that the predictive relationship will almost always “predict” outside the [0,1] interval.

Instead, in logistic regression we have a kind of background relationship which relates an odds-ratio to a linear predictive relationship, as in,

ln(p/(1-p)) = β01x12x2

Here p is a probability or proportion and the xi are explanatory variables. The function ln() is the natural logarithm to the base e (a transcendental number), rather than the logarithm to the base 10.

The parameters of this logistic model are β0, β1, and β2.

This odds ratio is really primary and from the logarithm of the odds ratio we can derive the underlying probability p. This probability p, in turn, governs the mix of values of an indicator variable Z which can be either zero or 1, in the standard case (there being a generalization to multiple discrete categories, too).

Thus, the index variable Z can encapsulate discrete conditions such as hospital admissions, having a heart attack, or dying – generally, occurrences and non-occurrences of something.

Chinesemathteacher

It’s exactly analogous to flipping coins, say, 100 times. There is a probability of getting a heads on a flip, usually 0.50. The distribution of the number of heads in 100 flips is a binomial, where the probability of getting say 60 heads and 40 tails is the combination of 100 things taken 60 at a time, multiplied into (0.5)60*(0.5)40. The combination of 100 things taken 60 at a time equals 60!/(60!40!) where the exclamation mark indicates “factorial.”

Similarly, the probability of getting 60 occurrences of the index Z=1 in a sample of 100 observations is (p)60*(1-p)40multiplied by 60!/(60!40!).

The parameters βi in a logistic regression are estimated by means of maximum likelihood (ML).  Among other things, this can mean the optimal estimates of the beta parameters – the parameter values which maximize the likelihood function – must be estimated by numerical analysis, there being no closed form solutions for the optimal values of β0, β1, and β2.

In addition, interpretation of the results is intricate, there being no real consensus on the best metrics to test or validate models.

SAS and SPSS as well as software packages with smaller market shares of the predictive analytics space, offer algorithms, whereby you can plug in data and pull out parameter estimates, along with suggested metrics for statistical significance and goodness of fit.

There also are logistic regression packages in R.

But you can do a logistic regression, if the data are not extensive, with an Excel spreadsheet.

This can be instructive, since, if you set it up from the standpoint of the odds-ratio, you can see that only certain data configurations are suitable. These configurations – I refer to the values which the explanatory variables xi can take, as well as the associated values of the βi – must be capable of being generated by the underlying probability model. Some data configurations are virtually impossible, while others are inconsistent.

This is a point I find lacking in discussions about logistic regression, which tend to note simply that sometimes the maximum likelihood techniques do not converge, but explode to infinity, etc.

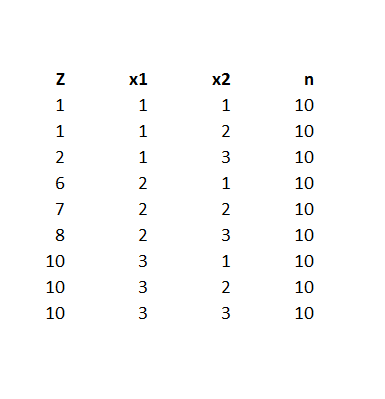
Here is a spreadsheet example, where the predicting equation has three parameters and I determine the underlying predictor equation to be,

ln(p/(1-p))=-6+3x1+.05x2

and we have the data-
logisticregmodel

Notice the explanatory variables x1 and x2 also are categorical, or at least, discrete, and I have organized the data into bins, based on the possible combinations of the values of the explanatory variables – where the number of cases in each of these combinations or populations is given to equal 10 cases. A similar setup can be created if the explanatory variables are continuous, by partitioning their ranges and sorting out the combination of ranges in however many explanatory variables there are, associating the sum of occurrences associated with these combinations. The purpose of looking at the data this way, of course, is to make sense of an odds-ratio.

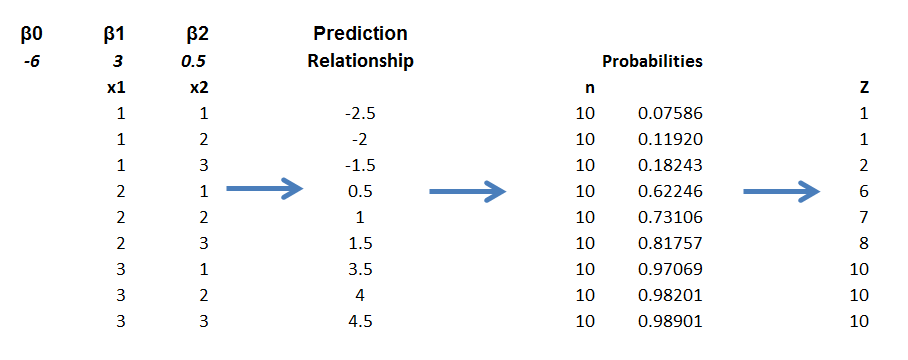
The predictor equation above in the odds ratio can be manipulated into a form which explicitly indicates the probability of occurrence of something or of Z=1. Thus,

p= eβ0+β1×1+β2×2/(1+ eβ0+β1×1+β2×2)

where this transformation takes advantage of the principle that elny = y.

So with this equation for p, I can calculate the probabilities associated with each of the combinations in the data rows of the spreadsheet. Then, given the probability of that configuration, I calculate the expected value of Z=1 by the formula 10p. Thus, the mean of a binomial variable with probability p is np, where n is the number of trials. This sequence is illustrated below (click to enlarge).
sequence

Picking the “success rates” for each of the combinations to equal the expected value of the occurrences, given 10 “trials,” produces a highly consistent set of data.

Along these lines, the most valuable source I have discovered for ML with logistic regression is a paper by Scott
Czepiel – Maximum Likelihood Estimation of Logistic Regression Models: Theory and Implementation
.

I can readily implement Czepiel’s log likelihood function in his Equation (9) with an Excel spreadsheet and Solver.

It’s also possible to see what can go wrong with this setup.

For example, the standard deviation of a binomial process with probability p and n trials is np(1-p). If we then simulate the possible “occurrences” for each of the nine combinations, some will be closer to the estimate of np used in the above spreadsheet, others will be more distant. Peforming such simulations, however, highlights that some numbers of occurrences for some combinations will simply never happen, or are well nigh impossible, based on the laws of chance.

Of course, this depends on the values of the parameters selected, too – but it’s easy to see that, whatever values selected for the parameters, some low probability combinations will be highly unlikely to produce a high number for successes. This results in a nonconvergent ML process, so some parameters simply may not be able to be estimated.

This means basically that logistic regression is less flexible in some sense than OLS regression, where it is almost always possible to find values for the parameters which map onto the dependent variable.

What This Means

Logistic regression, thus, is not the exact analogue of OLS regression, but has nuances of its own. This has not prohibited its wide application in medical risk assessment (and I am looking for a survey article which really shows the extent of its application across different medical fields).

There also are more and more reports of the successful integration of medical diagnostic systems, based in some way on logistic regression analysis, in informing medical practices.

But the march of data science is relentless. Just when doctors got a handle on logistic regression, we have a raft of new techniques, such as random forests and splines.

Header image courtesy of: National Kidney & Urologic Diseases Information Clearinghouse (NKUDIC)

Credit Spreads As Predictors of Real-Time Economic Activity

Several distinguished macroeconomic researchers, including Ben Bernanke, highlight the predictive power of the “paper-bill” spread.

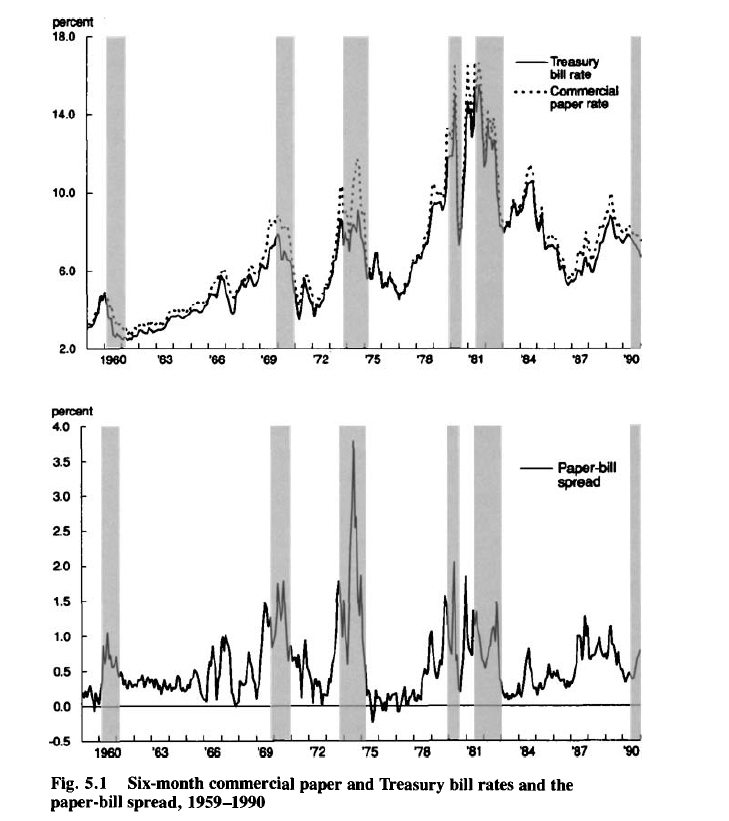
The following graphs, from a 1993 article by Benjamin M. Friedman and Kenneth N. Kuttner, show the promise of credit spreads in forecasting recessions – indicated by the shaded blocks in the charts.

CPTBspread

Credit spreads, of course, are the differences in yields between various corporate debt instruments and government securities of comparable maturity.

The classic credit spread illustrated above is the difference between six-month commercial paper rates and 6 month Treasury bill rates.

Recent Research

More recent research underlines the importance of building up credit spreads from metrics relating to individual corporate bonds , rather than a mishmash of bonds with different duration, credit risk and other characteristics.

Credit Spreads as Predictors of Real-Time Economic Activity: A Bayesian Model-Averaging Approach is key research in this regard.

The authors first note that,

the “paper-bill” spread—the difference between yields on nonfinancial commercial paper and comparable-maturity Treasury bills—had substantial forecasting power for economic activity during the 1970s and the 1980s, but its predictive ability vanished in the subsequent decade

They then acknowledge that credit spreads based on indexes of speculative-grade or “junk” corporate bonds work fairly well for the 1990s, but their performance is uneven.

Accordingly, Faust, Gilchrist, Wright, and Zakrajsek (GYZ) write that

In part to address these problems, GYZ constructed 20 monthly credit spread indexes for different maturity and credit risk categories using secondary market prices of individual senior unsecured corporate bonds.. [measuring]..the underlying credit risk by the issuer’s expected default frequency (EDF™), a market-based default-risk indicator calculated by Moody’s/KMV that is more timely that the issuer’s credit rating]

Their findings indicate that these credit spread indexes have substantial predictive power, at both short- and longer-term horizons, for the growth of payroll employment and industrial production. Moreover, they significantly outperform the predictive ability of the standard default-risk indicators, a result that suggests that using “cleaner” measures of credit spreads may, indeed, lead to more accurate forecasts of economic activity.

Their research applies credit spreads constructed from the ground up, as it were, to out-of-sample forecasts of

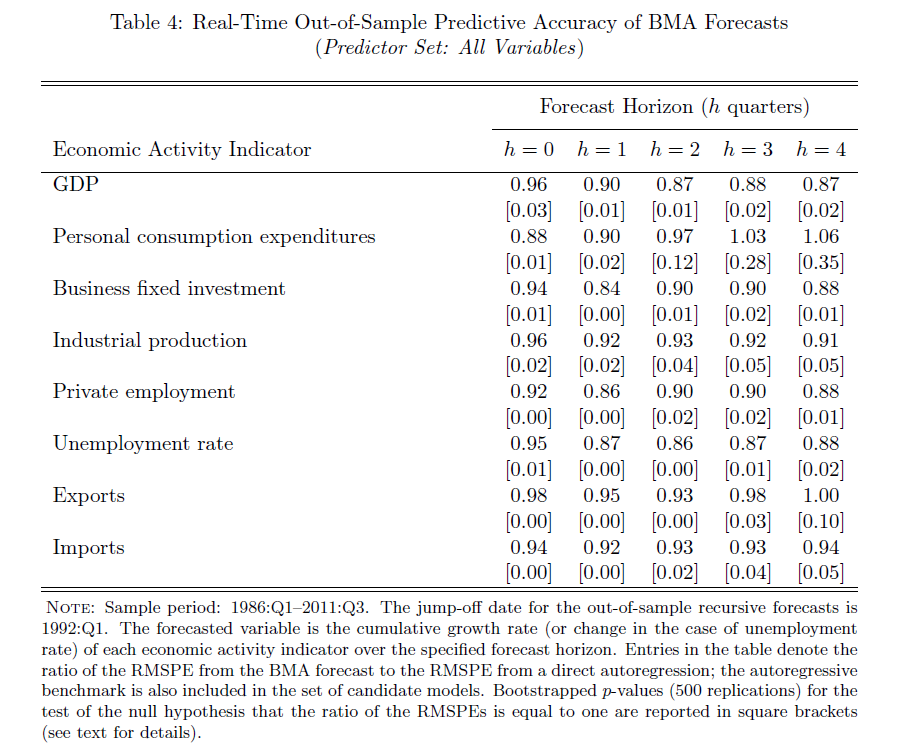
…real economic activity, as measured by real GDP, real personal consumption expenditures (PCE), real business fixed investment, industrial production, private payroll employment, the civilian unemployment rate, real exports, and real imports over the period from 1986:Q1 to 2011:Q3. All of these series are in quarter-over-quarter growth rates (actually 400 times log first differences), except for the unemployment rate, which is simply in first differences

The results are forecasts which significantly beat univariate (autoregressive) model forecass, as shown in the following table.

Cspreadresults

Here BMA is an abbreviation for Bayesian Model Averaging, the author’s method of incorporating these calculated credit spreads in predictive relationships.

Additional research validates the usefulness of credit spreads so constructed for predicting macroeconomic dynamics in several European economies –

We find that credit spreads and excess bond premiums, when used alongside monetary policy tightness indicators and leading indicators of economic performance, are highly significant for predicting the growth in the index of industrial production, employment growth, the unemployment rate and real GDP growth at horizons ranging from one quarter to two years ahead. These results are confirmed for individual countries in the euroarea and for the United Kingdom, and are robust to different measures of the credit spread. It is the unpredictable part associated with the excess bond premium that has greater influence on real activity compared to the predictable part of the credit spread. The implications of our results are that careful selection of the bonds used to construct the credit spreads, excluding those with embedded options and or illiquid secondary markets, delivers a robust indicator of financial market tightness that is distinct from tightness due to monetary policy measures or leading indicators of economic activity.

The Situation Today

A Morgan Stanley Credit Report for fixed income, released March 21, 2014, notes that

Spreads in both IG and HY are at the lowest levels we have seen since 2007, roughly 110bp for IG and 415bp for HY. A question we are commonly asked is how much tighter can spreads go in this cycle

So this is definitely something to watch. 

Three Pass Regression Filter – New Data Reduction Method

Malcolm Gladwell’s 10,000 hour rule (for cognitive mastery) is sort of an inspiration for me. I picked forecasting as my field for “cognitive mastery,” as dubious as that might be. When I am directly engaged in an assignment, at some point or other, I feel the need for immersion in the data and in estimations of all types. This blog, on the other hand, represents an effort to survey and, to some extent, get control of new “tools” – at least in a first pass. Then, when I have problems at hand, I can try some of these new techniques.

Ok, so these remarks preface what you might call the humility of my approach to new methods currently being innovated. I am not putting myself on a level with the innovators, for example. At the same time, it’s important to retain perspective and not drop a critical stance.

The Working Paper and Article in the Journal of Finance

Probably one of the most widely-cited recent working papers is Kelly and Pruitt’s three pass regression filter (3PRF). The authors, shown above, are with the University of Chicago, Booth School of Business and the Federal Reserve Board of Governors, respectively, and judging from the extensive revisions to the 2011 version, they had a bit of trouble getting this one out of the skunk works.

Recently, however, Kelly and Pruit published an important article in the prestigious Journal of Finance called Market Expectations in the Cross-Section of Present Values. This article applies a version of the three pass regression filter to show that returns and cash flow growth for the aggregate U.S. stock market are highly and robustly predictable.

I learned of a published application of the 3PRF from Francis X. Dieblod’s blog, No Hesitations, where Diebold – one of the most published authorities on forecasting – writes

Recent interesting work, moreover, extends PLS in powerful ways, as with the Kelly-Pruitt three-pass regression filter and its amazing apparent success in predicting aggregate equity returns.

What is the 3PRF?

The working paper from the Booth School of Business cited at a couple of points above describes what might be cast as a generalization of partial least squares (PLS). Certainly, the focus in the 3PRF and PLS is on using latent variables to predict some target.

I’m not sure, though, whether 3PRF is, in fact, more of a heuristic, rather than an algorithm.

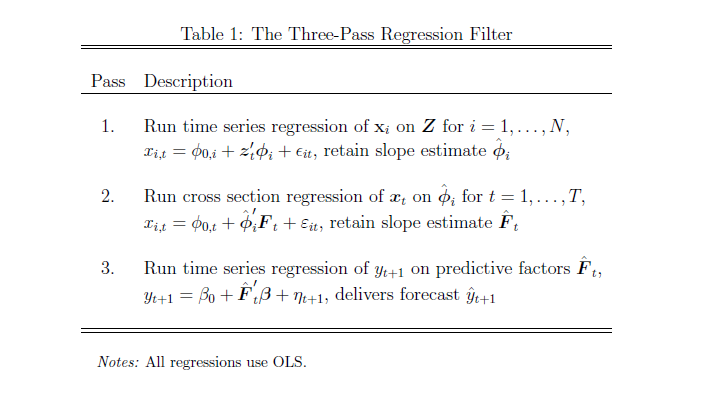
What I mean is that the three pass regression filter involves a procedure, described below.

(click to enlarge).

3PRFprocedure

Here’s the basic idea –

Suppose you have a large number of potential regressors xi ε X, i=1,..,N. In fact, it may be impossible to calculate an OLS regression, since N > T the number of observations or time periods.

Furthermore, you have proxies zj ε  Z, I = 1,..,L – where L is significantly less than the number of observations T. These proxies could be the first several principal components of the data matrix, or underlying drivers which theory proposes for the situation. The authors even suggest an automatic procedure for generating proxies in the paper.

And, finally, there is the target variable yt which is a column vector with T observations.

Latent factors in a matrix F drive both the proxies in Z and the predictors in X. Based on macroeconomic research into dynamic factors, there might be only a few of these latent factors – just as typically only a few principal components account for the bulk of variation in a data matrix.

Now here is a key point – as Kelly and Pruitt present the 3PRF, it is a leading indicator approach when applied to forecasting macroeconomic variables such as GDP, inflation, or the like. Thus, the time index for yt ranges from 2,3,…T+1, while the time indices of all X and Z variables and the factors range from 1,2,..T. This means really that all the x and z variables are potentially leading indicators, since they map conditions from an earlier time onto values of a target variable at a subsequent time.

What Table 1 above tells us to do is –

  1. Run an ordinary least square (OLS) regression of the xi      in X onto the zj in X, where T ranges from 1 to T and there are      N variables in X and L << T variables in Z. So, in the example      discussed below, we concoct a spreadsheet example with 3 variables in Z,      or three proxies, and 10 predictor variables xi in X (I could      have used 50, but I wanted to see whether the method worked with lower      dimensionality). The example assumes 40 periods, so t = 1,…,40. There will      be 40 different sets of coefficients of the zj as a result of      estimating these regressions with 40 matched constant terms.
  2. OK, then we take this stack of estimates of      coefficients of the zj and their associated constants and map      them onto the cross sectional slices of X for t = 1,..,T. This means that,      at each period t, the values of the cross-section. xi,t, are      taken as the dependent variable, and the independent variables are the 40      sets of coefficients (plus constant) estimated in the previous step for      period t become the predictors.
  3. Finally, we extract the estimate of the factor loadings      which results, and use these in a regression with target variable as the      dependent variable.

This is tricky, and I have questions about the symbolism in Kelly and Pruitt’s papers, but the procedure they describe does work. There is some Matlab code here alongside the reference to this paper in Professor Kelly’s research.

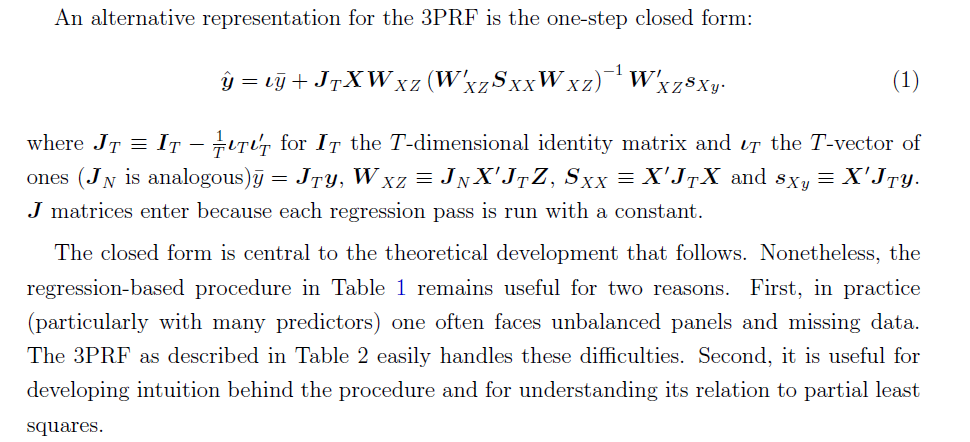
At the same time, all this can be short-circuited (if you have adequate data without a lot of missing values, apparently) by a single humungous formula –

3PRFformula

Here, the source is the 2012 paper.

Spreadsheet Implementation

Spreadsheets help me understand the structure of the underlying data and the order of calculation, even if, for the most part, I work with toy examples.

So recently, I’ve been working through the 3PRF with a small spreadsheet.

Generating the factors:I generated the factors as two columns of random variables (=rand()) in Excel. I gave the factors different magnitudes by multiplying by different constants.

Generating the proxies Z and predictors X. Kelly and Pruitt call for the predictors to be variance standardized, so I generated 40 observations on ten sets of xi by selecting ten different coefficients to multiply into the two factors, and in each case I added a normal error term with mean zero and standard deviation 1. In Excel, this is the formula =norminv(rand(),0,1).

Basically, I did the same drill for the three zj — I created 40 observations for z1, z2, and z3 by multiplying three different sets of coefficients into the two factors and added a normal error term with zero mean and variance equal to 1.

Then, finally, I created yt by multiplying randomly selected coefficients times the factors.

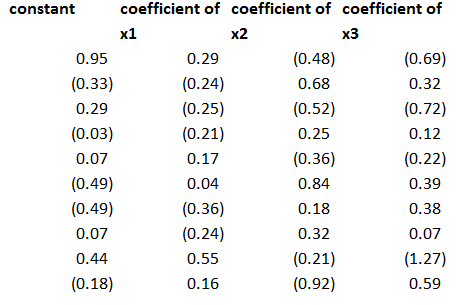
After generating the data, the first pass regression is easy. You just develop a regression with each predictor xi as the dependent variable and the three proxies as the independent variables, case-by-case, across the time series for each. This gives you a bunch of regression coefficients which, in turn, become the explanatory variables in the cross-sectional regressions of the second step.

The regression coefficients I calculated for the three proxies, including a constant term, were as follows – where the 1st row indicates the regression for x1 and so forth.

coeff

This second step is a little tricky, but you just take all the values of the predictor variables for a particular period and designate these as the dependent variables, with the constant and coefficients estimated in the previous step as the independent variables. Note, the number of predictors pairs up exactly with the number of rows in the above coefficient matrix.

This then gives you the factor loadings for the third step, where you can actually predict yt (really yt+1 in the 3PRF setup). The only wrinkle is you don’t use the constant terms estimated in the second step, on the grounds that these reflect “idiosyncratic” effects, according to the 2011 revision of the paper.

Note the authors describe this as a time series approach, but do not indicate how to get around some of the classic pitfalls of regression in a time series context. Obviously, first differencing might be necessary for nonstationary time series like GDP, and other data massaging might be in order.

Bottom line – this worked well in my first implementation.

To forecast, I just used the last regression for yt+1 and then added ten more cases, calculating new values for the target variable with the new values of the factors. I used the new values of the predictors to update the second step estimate of factor loadings, and applied the last third pass regression to these values.

Here are the forecast errors for these ten out-of-sample cases.

3PRFforecasterror

Not bad for a first implementation.

 Why Is Three Pass Regression Important?

3PRF is a fairly “clean” solution to an important problem, relating to the issue of “many predictors” in macroeconomics and other business research.

Noting that if the predictors number near or more than the number of observations, the standard ordinary least squares (OLS) forecaster is known to be poorly behaved or nonexistent, the authors write,

How, then, does one effectively use vast predictive information? A solution well known in the economics literature views the data as generated from a model in which latent factors drive the systematic variation of both the forecast target, y, and the matrix of predictors, X. In this setting, the best prediction of y is infeasible since the factors are unobserved. As a result, a factor estimation step is required. The literature’s benchmark method extracts factors that are significant drivers of variation in X and then uses these to forecast y. Our procedure springs from the idea that the factors that are relevant to y may be a strict subset of all the factors driving X. Our method, called the three-pass regression filter (3PRF), selectively identifies only the subset of factors that influence the forecast target while discarding factors that are irrelevant for the target but that may be pervasive among predictors. The 3PRF has the advantage of being expressed in closed form and virtually instantaneous to compute.

So, there are several advantages, such as (1) the solution can be expressed in closed form (in fact as one complicated but easily computable matrix expression), and (2) there is no need to employ maximum likelihood estimation.

Furthermore, 3PRF may outperform other approaches, such as principal components regression or partial least squares.

The paper illustrates the forecasting performance of 3PRF with real-world examples (as well as simulations). The first relates to forecasts of macroeconomic variables using data such as from the Mark Watson database mentioned previously in this blog. The second application relates to predicting asset prices, based on a factor model that ties individual assets’ price-dividend ratios to aggregate stock market fluctuations in order to uncover investors’ discount rates and dividend growth expectations.

Partial Least Squares and Principal Components

I’ve run across outstanding summaries of “partial least squares” (PLS) research recently – for example Rosipal and Kramer’s Overview and Recent Advances in Partial Least Squares and the 2010 Handbook of Partial Least Squares.

Partial least squares (PLS) evolved somewhat independently from related statistical techniques, owing to what you might call family connections. The technique was first developed by Swedish statistician Herman Wold and his son, Svante Wold, who applied the method in particular to chemometrics. Rosipal and Kramer suggest that the success of PLS in chemometrics resulted in a lot of applications in other scientific areas including bioinformatics, food research, medicine, [and] pharmacology..

Someday, I want to look into “path modeling” with PLS, but for now, let’s focus on the comparison between PLS regression and principal component (PC) regression. This post develops a comparison with Matlab code and macroeconomics data from Mark Watson’s website at Princeton.

The Basic Idea Behind PC and PLS Regression

Principal component and partial least squares regression share a couple of features.

Both, for example, offer an approach or solution to the problem of “many predictors” and multicollinearity. Also, with both methods, computation is not transparent, in contrast to ordinary least squares (OLS). Both PC and PLS regression are based on iterative or looping algorithms to extract either the principal components or underlying PLS factors and factor loadings.

PC Regression

The first step in PC regression is to calculate the principal components of the data matrix X. This is a set of orthogonal (which is to say completely uncorrelated) vectors which are weighted sums of the predictor variables in X.

This is an iterative process involving transformation of the variance-covariance or correlation matrix to extract the eigenvalues and eigenvectors.

Then, the data matrix X is multiplied by the eigenvectors to obtain the new basis for the data – an orthogonal basis. Typically, the first few (the largest) eigenvalues – which explain the largest proportion of variance in X – and their associated eigenvectors are used to produce one or more principal components which are regressed onto Y. This involves a dimensionality reduction, as well as elimination of potential problems of multicollinearity.

PLS Regression

The basic idea behind PLS regression, on the other hand, is to identify latent factors which explain the variation in both Y and X, then use these factors, which typically are substantially fewer in number than k, to predict Y values.

Clearly, just as in PC regression, the acid test of the model is how it performs on out-of-sample data.

The reason why PLS regression often outperforms PC regression, thus, is that factors which explain the most variation in the data matrix may not, at the same time, explain the most variation in Y. It’s as simple as that.

Matlab example

I grabbed some data from Mark Watson’s website at Princeton — from the links to a recent paper called Generalized Shrinkage Methods for Forecasting Using Many Predictors (with James H. Stock), Journal of Business and Economic Statistics, 30:4 (2012), 481-493.Download Paper (.pdf). Download Supplement (.pdf), Download Data and Replication Files (.zip). The data include the following variables, all expressed as year-over-year (yoy) growth rates: The first variable – real GDP – is taken as the forecasting target. The time periods of all other variables are lagged one period (1 quarter) behind the quarterly values of this target variable.

macrolist

Matlab makes calculation of both principal component and partial least squares regressions easy.

The command to extract principal components is

[coeff, score, latent]=princomp(X)

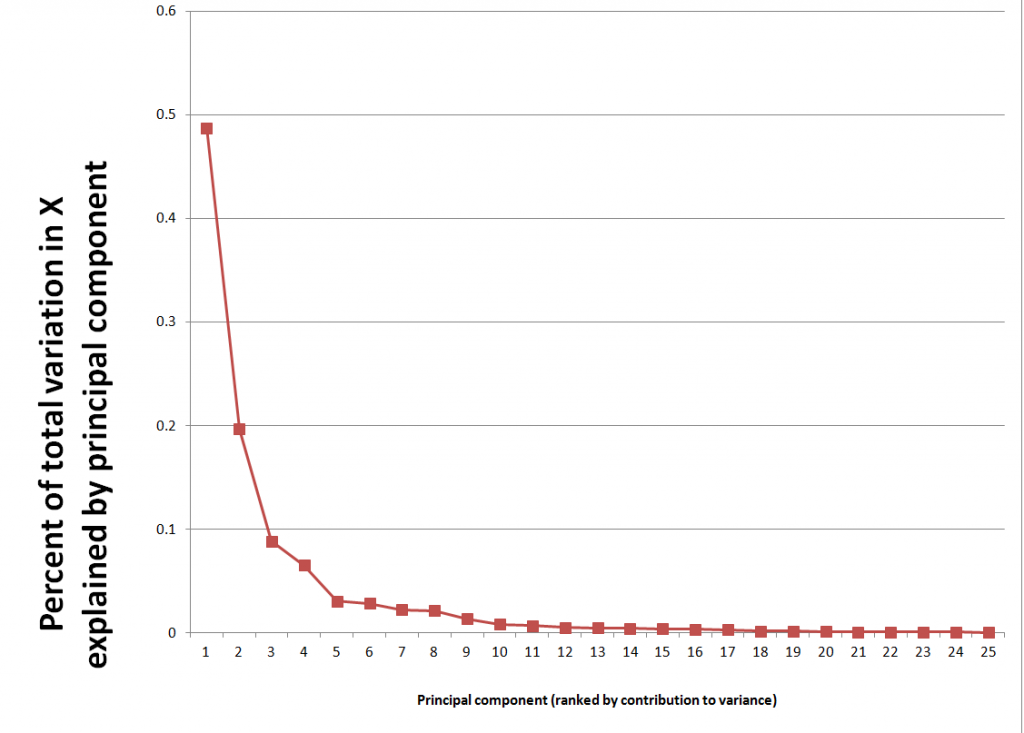
Here X the data matrix, and the entities in the square brackets are vectors or matrices produced by the algorithm. It’s possible to compute a principal components regression with the contents of the matrix score. Generally, the first several principal components are selected for the regression, based on the importance of a component or its associated eigenvalue in latent. The following scree chart illustrates the contribution of the first few principal components to explaining the variance in X.

Screechart

The relevant command for regression in Matlab is

b=regress(Y,score(:,1:6))

where b is the column vector of estimated coefficients and the first six principal components are used in place of the X predictor variables.

The Matlab command for a partial least square regresssion is

[XL,YL,XS,YS,beta] = plsregress(X,Y,ncomp)

where ncomp is the number of latent variables of components to be utilized in the regression. There are issues of interpreting the matrices and vectors in the square brackets, but I used this code –

data=xlsread(‘stock.xls’); X=data(1:47,2:79); y = data(2:48,1);

[XL,yl,XS,YS,beta] = plsregress(X,y,10); yfit = [ones(size(X,1),1) X]*beta;

lookPLS=[y yfit]; ZZ=data(48:50,2:79);newy=data(49:51,1);

new=[ones(3,1) ZZ]*beta; out=[newy new];

The bottom line is to test the estimates of the response coefficients on out-of-sample data.

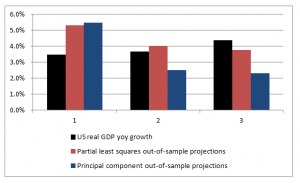
The following chart shows that PLS outperforms PC, although the predictions of both are not spectacularly accurate.

plspccomp

Commentary

There are nuances to what I have done which help explain the dominance of PLS in this situation, as well as the weakly predictive capabilities of both approaches.

First, the target variable is quarterly year-over-year growth of real US GDP. The predictor set X contains 78 other macroeconomic variables, all expressed in terms of yoy (year-over-year) percent changes.

Again, note that the time period of all the variables or observations in X are lagged one quarter from the values in Y, or the values or yoy quarterly percent growth of real US GDP.

This means that we are looking for a real, live leading indicator. Furthermore, there are plausibly common factors in the Y series shared with at least some of the X variables. For example, the percent changes of a block of variables contained in real GDP are included in X, and by inspection move very similarly with the target variable.

Other Example Applications

There are at least a couple of interesting applied papers in the Handbook of Partial Least Squares – a downloadable book in the Springer Handbooks of Computational Statistics. See –

Chapter 20 A PLS Model to Study Brand Preference: An Application to the Mobile Phone Market

Chapter 22 Modeling the Impact of Corporate Reputation on Customer Satisfaction and Loyalty Using Partial Least Squares

Another macroeconomics application from the New York Fed –

“Revisiting Useful Approaches to Data-Rich Macroeconomic Forecasting”

http://www.newyorkfed.org/research/staff_reports/sr327.pdf

Finally, the software company XLStat has a nice, short video on partial least squares regression applied to a marketing example.

Variable Selection Procedures – The LASSO

The LASSO (Least Absolute Shrinkage and Selection Operator) is a method of automatic variable selection which can be used to select predictors X* of a target variable Y from a larger set of potential or candidate predictors X.

Developed in 1996 by Tibshirani, the LASSO formulates curve fitting as a quadratic programming problem, where the objective function penalizes the absolute size of the regression coefficients, based on the value of a tuning parameter λ. In doing so, the LASSO can drive the coefficients of irrelevant variables to zero, thus performing automatic variable selection.

This post features a toy example illustrating tactics in variable selection with the lasso. The post also dicusses the issue of consistency – how we know from a large sample perspective that we are honing in on the true set of predictors when we apply the LASSO.

My take is a two-step approach is often best. The first step is to use the LASSO to identify a subset of potential predictors which are likely to include the best predictors. Then, implement stepwise regression or other standard variable selection procedures to select the final specification, since there is a presumption that the LASSO “over-selects” (Suggested at the end of On Model Selection Consistency of Lasso).

Toy Example

The LASSO penalizes the absolute size of the regression coefficients, based on the value of a tuning parameter λ. When there are many possible predictors, many of which actually exert zero to little influence on a target variable, the lasso can be especially useful in variable selection.

For example, generate a batch of random variables in a 100 by 15 array – representing 100 observations on 15 potential explanatory variables. Mean-center each column. Then, determine coefficient values for these 15 explanatory variables, allowing several to have zero contribution to the dependent variable. Calculate the value of the dependent variable y for each of these 100 cases, adding in a normally distributed error term.

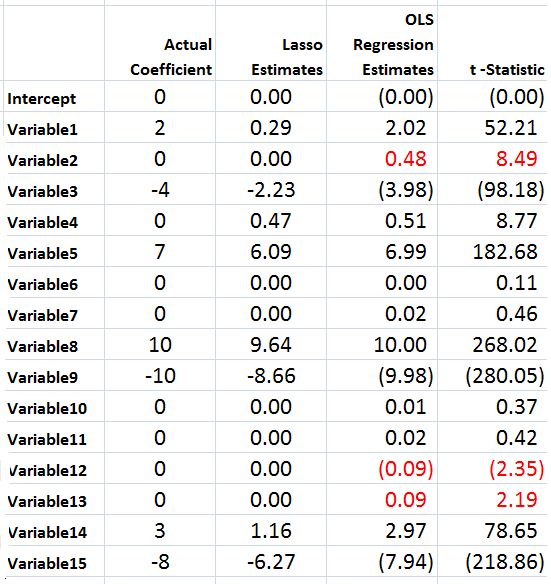
The following Table illustrates something of the power of the lasso.

LassoSS

Using the Matlab lasso procedure and a lambda value of 0.3, seven of the eight zero coefficients are correctly identified. The OLS regression estimate, on the other hand, indicates that three of the zero coefficients are nonzero at a level of 95 percent statistical significance or more (magnitude of the t-statistic > 2).

Of course, the lasso also shrinks the value of the nonzero coefficients. Like ridge regression, then, the lasso introduces bias to parameter estimates, and, indeed, for large enough values of lambda drives all coefficient to zero.

Note OLS can become impossible, when the number of predictors in X* is greater than the number of observations in Y and X. The LASSO, however, has no problem dealing with many predictors.

Real World Examples

For a recent application of the lasso, see the Dallas Federal Reserve occasional paper Hedge Fund Dynamic Market Stability. Note that the lasso is used to identify the key drivers, and other estimation techniques are employed to hone in on the parameter estimates.

For an application of the LASSO to logistic regression in genetics and molecular biology, see Lasso Logistic Regression, GSoft and the Cyclic Coordinate Descent Algorithm, Application to Gene Expression Data. As the title suggests, this illustrates the use of the lasso in logistic regression, frequently utilized in biomedical applications.

Formal Statement of the Problem Solved by the LASSO

The objective function in the lasso involves minimizing the residual sum of squares, the same entity figuring in ordinary least squares (OLS) regression, subject to a bound on the sum of the absolute value of the coefficients. The following clarifies this in notation, spelling out the objective function.

LassoDerivation

LassoDerivation2

The computation of the lasso solutions is a quadratic programming problem, tackled by standard numerical analysis algorithms. For an analytical discussion of the lasso and other regression shrinkage methods, see the outstanding free textbook The Elements of Statistical Learning by Hastie, Tibshirani, and Friedman.

The Issue of Consistency

The consistency of an estimator or procedure concerns its large sample characteristics. We know the LASSO produces biased parameter estimates, so the relevant consistency is whether the LASSO correctly predicts which variables from a larger set are in fact the predictors.

In other words, when can the LASSO select the “true model?”

Now in the past, this literature is extraordinarily opaque, involving something called the Irrepresentable Condition, which can be glossed as –

almost necessary and sufficient for Lasso to select the true model both in the classical fixed p setting and in the large p setting as the sample size n gets large…This Irrepresentable Condition, which depends mainly on the covariance of the predictor variables, states that Lasso selects the true model consistently if and (almost) only if the predictors that are not in the true model are “irrepresentable” (in a sense to be clarified) by predictors that are in the true model.

Fortunately a ray of light has burst through with Assumptionless Consistency of the Lasso by Chatterjee. Apparently, the LASSO selects the true model almost always – with minimal side assumptions – providing we are satisfied with the prediction error criterion – the mean square prediction error – employed in Tibshirani’s original paper.

Finally, cross-validation is typically used to select the tuning parameter λ, and is another example of this procedure highlighted by Varian’s recent paper.

Predicting the Hurricane Season

I’ve been focusing recently on climate change and extreme weather events, such as hurricanes and tornados. This focus is interesting in its own right, offering significant challenges to data analysis and predictive analytics, and I also see strong parallels to economic forecasting.

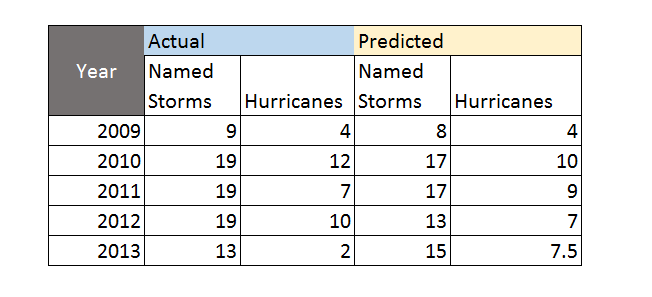
The Florida State University Center for Ocean-Atmospheric Prediction Studies (COAPS) garnered good press 2009-2012, for its accurate calls on the number of hurricanes and named tropical storms in the North Atlantic. Last year was another story, however, and it’s interesting to explore why 2013 was so unusual – there being only two (2) hurricanes and no major hurricanes over the whole season.

Here’s the track record for COAPS, since it launched its new service.

Hurricaneforecastaccuracy

The forecast for 2013 was a major embarrassment, inasmuch as the Press Release at the beginning of June 2013 predicted an “above-average season.”

Tim LaRow, associate research scientist at COAPS, and his colleagues released their fifth annual Atlantic hurricane season forecast today. Hurricane season begins June 1 and runs through Nov. 30.

This year’s forecast calls for a 70 percent probability of 12 to 17 named storms with five to 10 of the storms developing into hurricanes. The mean forecast is 15 named storms, eight of them hurricanes, and an average accumulated cyclone energy (a measure of the strength and duration of storms accumulated during the season) of 135.

“The forecast mean numbers are identical to the observed 1995 to 2010 average named storms and hurricanes and reflect the ongoing period of heightened tropical activity in the North Atlantic,” LaRow said.

The COAPS forecast is slightly less than the official National Oceanic and Atmospheric Administration (NOAA) forecast that predicts a 70 percent probability of 13 to 20 named storms with seven to 11 of those developing into hurricanes this season…

What Happened?

Hurricane forecaster Gary Bell is quoted as saying,

“A combination of conditions acted to offset several climate patterns that historically have produced active hurricane seasons,” said Gerry Bell, Ph.D., lead seasonal hurricane forecaster at NOAA’s Climate Prediction Center, a division of the National Weather Service. “As a result, we did not see the large numbers of hurricanes that typically accompany these climate patterns.”

More informatively,

Forecasters say that three main features loom large for the inactivity: large areas of sinking air, frequent plumes of dry, dusty air coming off the Sahara Desert, and above-average wind shear. None of those features were part of their initial calculations in making seasonal projections. Researchers are now looking into whether they can be predicted in advance like other variables, such as El Niño and La Niña events.

I think it’s interesting NOAA stuck to its “above-normal season” forecast as late as August 2013, narrowing the numbers only a little. At the same time, neutral conditions with respect to la Nina and el Nino in the Pacific were acknowledged as influencing the forecasts. The upshot – the 2013 hurricane season in the North Atlantic was the 7th quietest in 70 years.

Risk Behaviors and Extreme Events

Apparently, it’s been more than 8 years since a category 3 hurricane hit the mainland of the US. This is chilling, inasmuch as Sandy, which caused near-record damage on the East Coast, was only a category 1 when it made landfall in New Jersey in 2012.

Many studies highlight a “ratchet pattern” in risk behaviors following extreme weather, such as a flood or hurricane. Initially, after the devastation, people engage in lots of protective, pre-emptive behavior. Typically, flood insurance coverage shoots up, only to gradually fall off, when further flooding has not been seen for a decade or more.

Similarly, after a volcanic eruption, in Indonesia, for example, and destruction of fields and villages by lava flows or ash – people take some time before they re-claim those areas. After long enough, these events can give rise to rich soils, supporting high crop yields. So since the volcano has not erupted for, say, decades or a century, people move back and build even more intensively than before.

This suggests parallels with economic crisis and its impacts, and measures taken to make sure “it never happens again.”

I also see parallels between weather and economic forecasting.

Maybe there is a chaotic element in economic dynamics, just as there almost assuredly is in weather phenomena.

Certainly, the curse of dimension in forecasting models translates well from weather to economic forecasting. Indeed, a major review of macroeconomic forecasting, especially of its ability to predict recessions, concludes that economic models are always “fighting the last war,” in the sense that new factors seem to emerge and take control during every major economic crises. Things do not repeat themselves exactly. So, if the “true” recession forecasting model has legitimately 100 drivers or explanatory variables, it takes a long historic record to sort out the separate influences of these – and the underlying technological basis of the economy is changing all the time.

What’s the Lift of Your Churn Model? – Predictive Analytics and Big Data

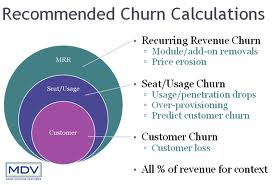
Churn analysis is a staple of predictive analytics and big data. The idea is to identify attributes of customers who are likely leave a mobile phone plan or other subscription service, or, more generally, switch who they do business with. Knowing which customers are likely to “churn” can inform customer retention plans. Such customers, for example, may be contacted in targeted call or mailing campaigns with offers of special benefits or discounts.

Lift is a concept in churn analysis. The lift of a target group identified by churn analysis reflects the higher proportion of customers who actually drop the service or give someone else their business, when compared with the population of customers as a whole. If, typically, 2 percent of customers drop the service per month, and, within the group identified as “churners,” 8 percent drop the service, the “lift” is 4.

In interesting research, originally published in the Harvard Business Review, Gregory Piatetsky-Shapiro questions the efficacy of big data applied to churn analysis – based on an estimation of costs and benefits.

We looked at some 30 different churn-modeling efforts in banking and telecom, and surprisingly, although the efforts used different data and different modeling algorithms, they had very similar lift curves. The lists of top 1% likely defectors had a typical lift of around 9-11. Lists of top 10% defectors all had a lift of about 3-4. Very similar lift curves have been reported in other work. (See here and here.) All this suggests a limiting factor to prediction accuracy for consumer behavior such as churn.

Backtracking through earlier research by Piatetsky-Shapiro and his co-researchers, there is this nugget,

For targeted marketing campaigns, a good model lift at T, where T is the target rate in the overall population, is usually sqrt(1/T) +/- 20%.

So, if the likely “churners” are 5 percent of the customer group, a reasonable expectation of the lift that can be obtained from churn analysis is 4.47. This means probably no more than 25 percent of the target group identified by the churn analysis will, in fact, do business elsewhere in the defined period.

This is a very applied type of result, based on review of 30 or more studies.

But the point Piatetsky-Shapiro make is that big data probably can’t push these lift numbers much higher, because of the inherent randomness in the behavior of consumers. And small gains to existing methods simply do not meet a cost/benefit criterion.

Some Israeli researchers may in fact best these numbers with a completely different approach based on social network analysis. Their initial working hypothesis was that social influence on churn is highly dominant in relatively tight social groups. Their approach is clearly telecommunications-based, since they analyzed patterns of calling between customers, identifying networks of callers who had more frequent communications.

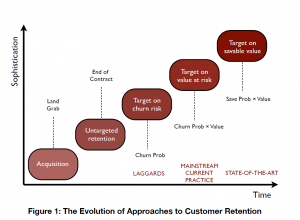
Still, there is a good argument for an evolution from standard churn analysis to predictive analytics that uncovers the value-at-risk in the customer base, or even the value that can be saved by customer retention programs. Customers who have trouble paying their bill, for example, might well be romanced less strongly by customer retention efforts, than premium customers.

evolution

Along these lines, I enjoyed reading the Stochastic Solutions piece on who can be saved and who will be driven away by retention activity, which is responsible for the above graphic.

It has been repeatedly demonstrated that the very act of trying to ‘save’ some customers provokes them to leave. This is not hard to understand, for a key targeting criterion is usually estimated churn probability, and this is highly correlated with customer dissatisfaction. Often, it is mainly lethargy that is preventing a dissatisfied customer from actually leaving. Interventions designed with the express purpose of reducing customer loss can provide an opportunity for such dissatisfaction to crystallise, provoking or bringing forward customer departures that might otherwise have been avoided, or at least delayed. This is especially true when intrusive contact mechanisms, such as outbound calling, are employed. Retention programmes can be made more effective and more profitable by switching the emphasis from customers with a high probability of leaving to those likely to react positively to retention activity.

This is a terrific point. Furthermore,

..many customers are antagonised by what they feel to be intrusive contact mechanisms; indeed, we assert without fear of contradiction that only a small proportion of customers are thrilled, on hearing their phone ring, to discover that the caller is their operator. In some cases, particularly for customers who are already unhappy, such perceived intrusions may act not merely as a catalyst but as a constituent cause of churn.

Bottom-line, this is among the most interesting applications of predictive analytics.

Logistic regression is a favorite in analyzing churn data, although techniques range from neural networks to regression trees.