Category Archives: real estate forecasts

Links – late August 2014

Economics Articles, Some Theoretical, Some Applied

Who’s afraid of inflation? Not Fed Chair Janet Yellen At Jackson Hole, Yellen speech on labor market conditions states that 2 percent inflation is not a hard ceiling for the Fed.

Economist’s View notes a new paper which argues that deflation is simply unnecessary, because the conditions for a “helicopter drop” of money (Milton Friedman’s metaphor) are widely met.

Three conditions must be satisfied for helicopter money always to boost aggregate demand. First, there must be benefits from holding fiat base money other than its pecuniary rate of return. Second, fiat base money is irredeemable – viewed as an asset by the holder but not as a liability by the issuer. Third, the price of money is positive. Given these three conditions, there always exists – even in a permanent liquidity trap – a combined monetary and fiscal policy action that boosts private demand – in principle without limit. Deflation, ‘lowflation’ and secular stagnation are therefore unnecessary. They are policy choices.

Stiglitz: Austerity ‘Dismal Failure,’ New Approach Needed

US housing market loses momentum

Fannie Mae economists have downgraded their expectations for the U.S. housing market in the second half of this year, even though they are more optimistic about the prospects for overall economic growth.

How Detroit’s Water Crisis Is Part Of A Much Bigger Problem

“Have we truly become a society to where we’ll go and build wells and stuff in third world countries but we’ll say to hell with our own right here up under our nose, our next door neighbors, the children that our children play with?”

Economic harassment and the Ferguson crisis

According to .. [ArchCity Defenders] recent report .. the Ferguson court is a “chronic offender” in legal and economic harassment of its residents….. the municipality collects some $2.6 million a year in fines and court fees, typically from small-scale infractions like traffic violations…the second-largest source of income for that small, fiscally-strapped municipality….

And racial profiling appears to be the rule. In Ferguson, “86% of vehicle stops involved a black motorist, although blacks make up just 67% of the population,” the report states. “After being stopped in Ferguson, blacks are almost twice as likely as whites to be searched (12.1% vs. 7.9%) and twice as likely to be arrested.” But those searches result in the discovery of contraband at a much lower rate than searches of whites.

Once the process begins, the system begins to resemble the no-exit debtors’ prisons of yore. “Clients reported being jailed for the inability to pay fines, losing jobs and housing as a result of the incarceration, being refused access to the Courts if they were with their children or other family members….

“By disproportionately stopping, charging, and fining the poor and minorities, by closing the Courts to the public, and by incarcerating people for the failure to pay fines, these policies unintentionally push the poor further into poverty, prevent the homeless from accessing the housing, treatment, and jobs they so desperately need to regain stability in their lives, and violate the Constitution.” And they increase suspicion and disrespect for the system.

… the Ferguson court processed the equivalent of three warrants and $312 in fines per household in 2013.

Science

Astronauts find living organisms clinging to the International Space Station, and aren’t sure how they got there

international-space-station-complete-640x408

A Mathematical Proof That The Universe Could Have Formed Spontaneously From Nothing

What caused the Big Bang itself? For many years, cosmologists have relied on the idea that the universe formed spontaneously, that the Big Bang was the result of quantum fluctuations in which the Universe came into existence from nothing.

1_INtAsuxJF7cMqoCBmesz-w

Big Data Trends In 2014 (infographic – click to enlarge)

Aureus-analytics-infographic-option-2

The Interest Elasticity of Housing Demand

What we really want to know, in terms of real estate market projections, is the current or effective interest elasticity of home sales.

So, given that the US Federal Reserve has embarked on the “taper,” we know long term interest rates will rise (and have since the end of 2012).

What, then, is the likely impact of moving the 30 year fixed mortgage rate from around 4 percent back to its historic level of six percent or higher?

What is an Interest Elasticity?

Recall that the concept of a demand elasticity here is the percentage change in demand – this case housing sales, divided by the percentage change in the mortgage interest rate.

Typically, thus, the interest elasticity of housing demand is a negative number, indicating that higher interest rates result in lower housing demand, other things being equal.

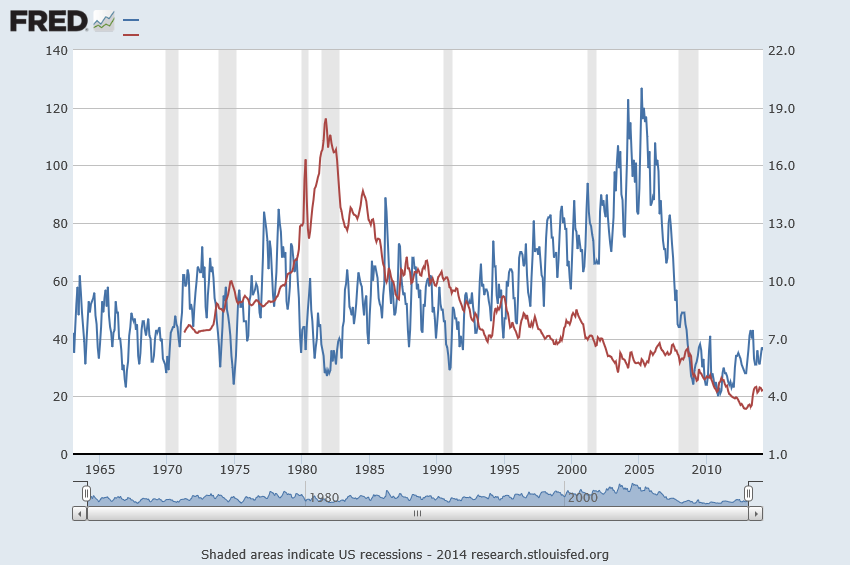
This “other things being equal” (ceteris paribus) is the hooker, of course, as is suggested by the following chart from FRED.

30mortsale

Here the red line is the 30 year fixed mortgage rate (right vertical axis) and the blue line is housing sales (left vertical axis).

A Rough and Ready Interest Rate Elasticity

Now the thing that jumps out at you when you glance over these two curves is the way housing sales (the blue line) drops when the 30 year fixed mortgage rate went through the roof in about 1982, reaching a peak of nearly 20 percent.

After the rates came down again in about 1985, an approximately 20 year period of declining mortgage interest rates ensued – certainly with bobbles and blips in this trend.

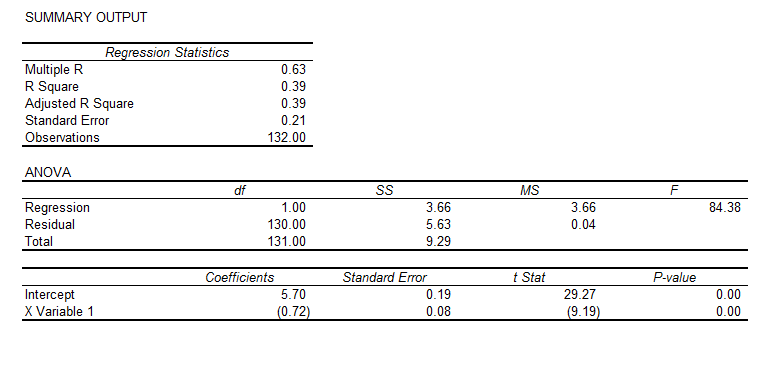
Now suppose we take just the period 1975-85, and calculate a simple interest rate elasticity. This involves getting the raw numbers behind these lines on the chart, and taking log transformations of them. We calculate the regression,

interestelasticityregThis corresponds to the equation,

ln(sales)=   5.7   –   0.72*ln(r)

where the t-statistics of the constant term and coefficient of the log of the interest rate r are highly significant, statistically.

This equation implies that the interest elasticity of housing sales in this period is -0.72. So a 10 percent increase in the 30-year fixed mortgage rate is associated with an about 7 percent reduction in housing sales, other things being equal.

In the spirit of heroic generalization, let’s test this elasticity by looking at the reduction in the mortgage rate after 1985 to 2005, and compare this percent change with the change in the housing sales over this period.

So at the beginning of 1986, the mortgage rate was 10.8 and sales were running 55,000 per month. At the end of 2005, sales had risen to 87, 000 per month and the 30 year mortgage rate for December was 6.27.

So the mortgage interest rates fell by 53 percent and housing sales rose 45 percent – calculating these percentage changes over the average base of the interest rates and house sales. Applying a -0.72 price elasticity to the (negative) percent change in interest rates suggests an increase in housing sales of 38 percent.

That’s quite remarkable, considering other factors operative in this period, such as consistent population growth.

OK, so looking ahead, if the 30 year fixed mortgage rate rises 33 percent to around 6 percent, housing sales could be expected to drop around 20-25 percent.

Interestingly, recent research conducted at the Wharton School and the Board of Governors of the Federal Reserve suggests that,

The relationship between the mortgage interest rate and a household’s demand for mortgage debt has important implications for a host of public policy questions. In this paper, we use detailed data on over 2.7 million mortgages to provide novel estimates of the interest rate elasticity of mortgage demand. Our empirical strategy exploits a discrete jump in interest rates generated by the conforming loan limit|the maximum loan size eligible for securitization by Fannie Mae and Freddie Mac. This discontinuity creates a large notch” in the intertemporal budget constraint of prospective mortgage borrowers, allowing us to identify the causal link between interest rates and mortgage demand by measuring the extent to which loan amounts bunch at the conforming limit. Under our preferred specifications, we estimate that 1 percentage point increase in the rate on a 30-year fixed-rate mortgage reduces first mortgage demand by between 2 and 3 percent. We also present evidence that about one third of the response is driven by borrowers who take out second mortgages while leaving their total mortgage balance unchanged. Accounting for these borrowers suggests a reduction in total mortgage debt of between 1.5 and 2 percent per percentage point increase in the interest rate. Using these estimates, we predict the changes in mortgage demand implied by past and proposed future increases to the guarantee fees charged by Fannie and Freddie. We conclude that these increases would directly reduce the dollar volume of new mortgage originations by well under 1 percent.

So a 33 percent increase in the 30 year fixed mortgage rate, according to this analysis, would reduce mortgage demand by well under 33 percent. So how about 20-25 percent?

I offer this “take-off” as an example of an exploratory analysis. Thus, the elasticity estimate developed with data from the period of greatest change in rates provides a ballpark estimate of the change in sales over a longer period of downward trending interest rates. This supports a forward projection, which, at a first order approximation seem consistent with estimates from a completely different line of analysis.

All this suggests a more comprehensive analysis might be warranted, taking into account population growth, inflation, and, possibly, other factors.

The marvels of applied economics in a forecasting context.

Lead picture courtesy of the University of Maryland Department of Economics.

Forecasting Housing Markets – 3

Maybe I jumped to conclusions yesterday. Maybe, in fact, a retrospective analysis of the collapse in US housing prices in the recent 2008-2010 recession has been accomplished – but by major metropolitan area.

The Yarui Li and David Leatham paper Forecasting Housing Prices: Dynamic Factor Model versus LBVAR Model focuses on out-of-sample forecasts for house price indices for 42 metropolitan areas. Forecast models are built with data from 1980:01 to 2007:12. These models – dynamic factor and Large-scale Bayesian Vector Autoregressive (LBVAR) models – are used to generate forecasts of the one- to twelve- months ahead price growth 2008:01 to 2010:12.

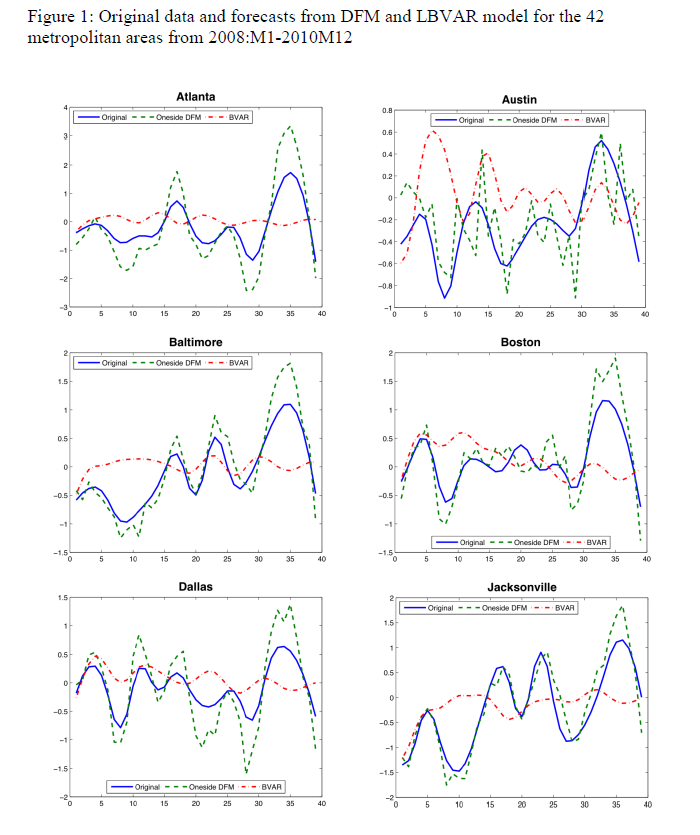
Judging from the graphics and other information, the dynamic factor model (DFM) produces impressive results.

For example, here are out-of-sample forecasts of the monthly growth of housing prices (click to enlarge).

DFMhousing

The house price indices for the 42 metropolitan areas are from the Office of Federal Housing Enterprise Oversight (OFEO). The data for macroeconomic indicators in the dynamic factor and VAR models are from the DRI/McGraw Hill Basic Economics Database provided by IHS Global Insight.

I have seen forecasting models using Internet search activity which purportedly capture turning points in housing price series, but this is something different.

The claim here is that calculating dynamic or generalized principal components of some 141 macroeconomic time series can lead to forecasting models which accurately capture fluctuations in cumulative growth rates of metropolitan house price indices over a forecasting horizon of up to 12 months.

That’s pretty startling, and I for one would like to see further output of such models by city.

But where is the publication of the final paper? The PDF file linked above was presented at the Agricultural & Applied Economics Association’s 2011 Annual Meeting in Pittsburgh, Pennsylvania, July, 2011. A search under both authors does not turn up a final publication in a refereed journal, but does indicate there is great interest in this research. The presentation paper thus is available from quite a number of different sources which obligingly archive it.

Yarui

Currently, the lead author, Yarui Li, Is a Decision Tech Analyst at JPMorgan Chase, according to LinkedIn, having received her PhD from Texas A&M University in 2013. The second author is Professor at Texas A&M, most recently publishing on VAR models applied to business failure in the US.

Dynamic Principal Components

It may be that dynamic principal components are the new ingredient accounting for an uncanny capability to identify turning points in these dynamic factor model forecasts.

The key research is associated with Forni and others, who originally documented dynamic factor models in the Review of Economics and Statistics in 2000. Subsequently, there have been two further publications by Forni on this topic:

Do financial variables help forecasting inflation and real activity in the euro area?

The Generalized Dynamic Factor Model, One Sided Estimation and Forecasting

Forni and associates present this method of dynamic prinicipal componets as an alternative to the Stock and Watson factor models based on many predictors – an alternative with superior forecasting performance.

Run-of-the-mill standard principal components are, according to Li and Leatham, based on contemporaneous covariances only. So they fail to exploit the potentially crucial information contained in the leading-lagging relations between the elements of the panel.

By contrast, the Forni dynamic component approach is used in this housing price study to

obtain estimates of common and idiosyncratic variance-covariance matrices at all leads and lags as inverse Fourier transforms of the corresponding estimated spectral density matrices, and thus overcome(s)[ing] the limitation of static PCA.

There is no question but that any further discussion of this technique must go into high mathematical dudgeon, so I leave that to another time, when I have had an opportunity to make computations of my own.

However, I will say that my explorations with forecasting principal components last year have led to me to wonder whether, in fact, it may be possible to pull out some turning points from factor models based on large panels of macroeconomic data.

Forecasting Housing Markets – 2

I am interested in business forecasting “stories.” For example, the glitch in Google’s flu forecasting program.

In real estate forecasting, the obvious thing is whether quantitative forecasting models can (or, better yet, did) forecast the collapse in housing prices and starts in the recent 2008-2010 recession (see graphics from the previous post).

There are several ways of going at this.

Who Saw The Housing Bubble Coming?

One is to look back to see whether anyone saw the bursting of the housing bubble coming and what forecasting models they were consulting.

That’s entertaining. Some people, like Ron Paul, and Nouriel Roubini, were prescient.

Roubini earned the soubriquet Dr. Doom for an early prediction of housing market collapse, as reported by the New York Times:

On Sept. 7, 2006, Nouriel Roubini, an economics professor at New York University, stood before an audience of economists at the International Monetary Fund and announced that a crisis was brewing. In the coming months and years, he warned, the United States was likely to face a once-in-a-lifetime housing bust, an oil shock, sharply declining consumer confidence and, ultimately, a deep recession. He laid out a bleak sequence of events: homeowners defaulting on mortgages, trillions of dollars of mortgage-backed securities unraveling worldwide and the global financial system shuddering to a halt. These developments, he went on, could cripple or destroy hedge funds, investment banks and other major financial institutions like Fannie Mae and Freddie Mac.

NR

Roubini was spot-on, of course, even though, at the time, jokes circulated such as “even a broken clock is right twice a day.” And my guess is his forecasting model, so to speak, is presented in Crisis Economics: A Crash Course in the Future of Finance, his 2010 book with Stephen Mihm. It is less a model than whole database of tendencies, institutional facts, areas in which Roubini correctly identifies moral hazard.

I think Ron Paul, whose projections of collapse came earlier (2003), was operating from some type of libertarian economic model.  So Paul testified before House Financial Services Committee on Fannie Mae and Freddy Mac, that –

Ironically, by transferring the risk of a widespread mortgage default, the government increases the likelihood of a painful crash in the housing market,” Paul predicted. “This is because the special privileges granted to Fannie and Freddie have distorted the housing market by allowing them to attract capital they could not attract under pure market conditions. As a result, capital is diverted from its most productive use into housing. This reduces the efficacy of the entire market and thus reduces the standard of living of all Americans.

On the other hand, there is Ben Bernanke, who in a CNBC interview in 2005 said:

7/1/05 – Interview on CNBC 

INTERVIEWER: Ben, there’s been a lot of talk about a housing bubble, particularly, you know [inaudible] from all sorts of places. Can you give us your view as to whether or not there is a housing bubble out there?

BERNANKE: Well, unquestionably, housing prices are up quite a bit; I think it’s important to note that fundamentals are also very strong. We’ve got a growing economy, jobs, incomes. We’ve got very low mortgage rates. We’ve got demographics supporting housing growth. We’ve got restricted supply in some places. So it’s certainly understandable that prices would go up some. I don’t know whether prices are exactly where they should be, but I think it’s fair to say that much of what’s happened is supported by the strength of the economy.

Bernanke was backed by one of the most far-reaching economic data collection and analysis operations in the United States, since he was in 2005 a member of the Board of Governors of the Federal Reserve System and Chairman of the President’s Council of Economic Advisors.

So that’s kind of how it is. Outsiders, like Roubini and perhaps Paul, make the correct call, but highly respected and well-placed insiders like Bernanke simply cannot interpret the data at their fingertips to suggest that a massive bubble was underway.

I think it is interesting currently that Roubini, in March, promoted the idea that Yellen Is Creating another huge Bubble in the Economy

But What Are the Quantitative Models For Forecasting the Housing Market?

In a long article in the New York Times in 2009, How Did Economists Get It So Wrong?, Paul Krugman lays the problem at the feet of the efficient market hypothesis –

When it comes to the all-too-human problem of recessions and depressions, economists need to abandon the neat but wrong solution of assuming that everyone is rational and markets work perfectly.

Along these lines, it is interesting that the Zillow home value forecast methodology builds on research which, in one set of models, assumes serial correlation and mean reversion to a long-term price trend.

Zillow

Key research in housing market dynamics includes Case and Shiller (1989) and Capozza et al (2004), who show that the housing market is not efficient and house prices exhibit strong serial correlation and mean reversion, where large market swings are usually followed by reversals to the unobserved fundamental price levels.

Based on the estimated model parameters, Capozza et al are able to reveal the housing market characteristics where serial correlation, mean reversion, and oscillatory, convergent, or divergent trends can be derived from the model parameters.

Here is an abstract from critical research underlying this approach done in 2004.

An Anatomy of Price Dynamics in Illiquid Markets: Analysis and Evidence from Local Housing Markets

This research analyzes the dynamic properties of the difference equation that arises when markets exhibit serial correlation and mean reversion. We identify the correlation and reversion parameters for which prices will overshoot equilibrium (“cycles”) and/or diverge permanently from equilibrium. We then estimate the serial correlation and mean reversion coefficients from a large panel data set of 62 metro areas from 1979 to 1995 conditional on a set of economic variables that proxy for information costs, supply costs and expectations. Serial correlation is higher in metro areas with higher real incomes, population growth and real construction costs. Mean reversion is greater in large metro areas and faster growing cities with lower construction costs. The average fitted values for mean reversion and serial correlation lie in the convergent oscillatory region, but specific observations fall in both the damped and oscillatory regions and in both the convergent and divergent regions. Thus, the dynamic properties of housing markets are specific to the given time and location being considered.

The article is not available for free download so far as I can determine. But it is based on earler research, dating back to the later 1990’s in the pdf The Dynamic Structure of Housing Markets.

The more recent Housing Market Dynamics: Evidence of Mean Reversion and Downward Rigidity by Fannie Mae researchers, lists a lot of relevant research on the serial correlation of housing prices, which is usually locality-dependent.

In fact, the Zillow forecasts are based on ensemble methods, combining univariate and multivariate models – a sign of modernity in the era of Big Data.

So far, though, I have not found a truly retrospective study of the housing market collapse, based on quantitative models. Perhaps that is because only the Roubini approach works with such complex global market phenomena.

We are left, thus, with solid theoretical foundations, validated by multiple housing databases over different time periods, that suggests that people invest in housing based on momentum factors – and that this fairly obvious observation can be shown statistically, too.

Real Estate Forecasts – 1

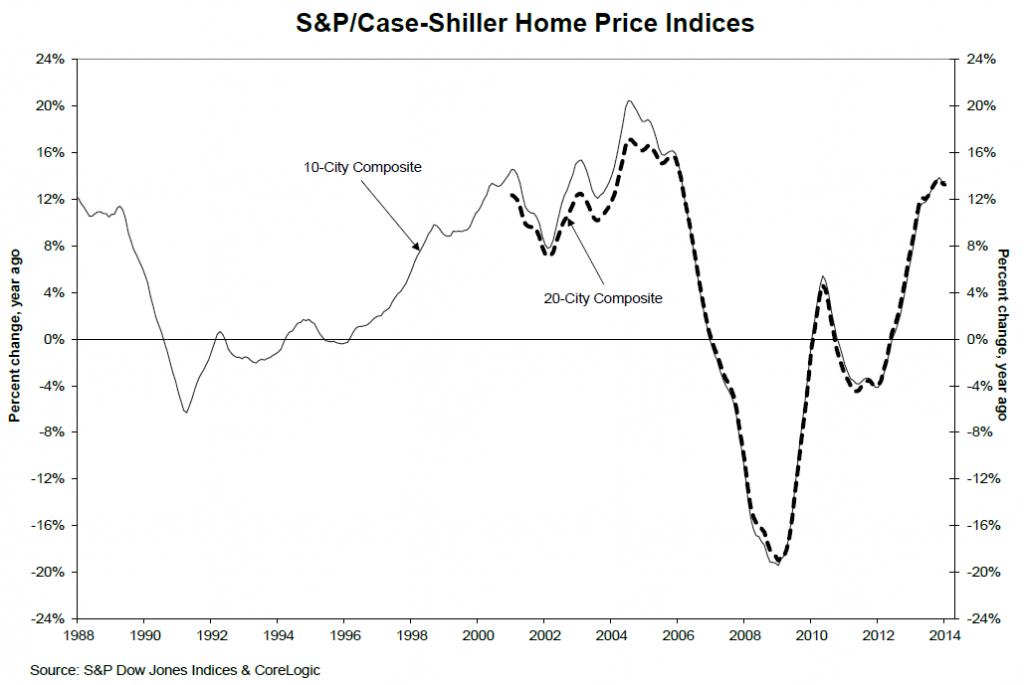
Nationally, housing prices peaked in 2014, as the following Case-Shiller chart shows.

CS2014

The Case Shiller home price indices have been the gold standard and the focus of many forecasting efforts. A key feature is reliance on the “repeat sales method.” This uses data on properties that have sold at least twice to capture the appreciated value of each specific sales unit, holding quality constant.

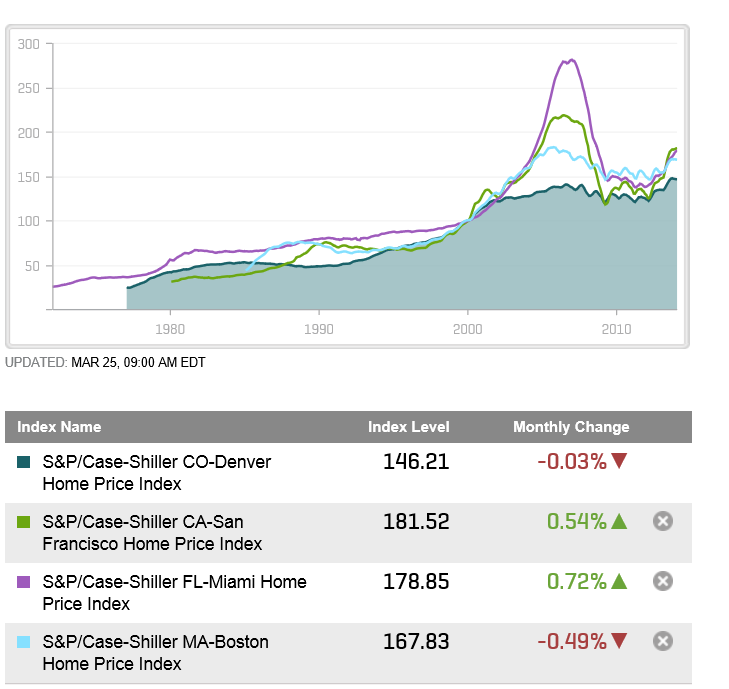
The following chart shows Case-Shiller (C-S) house indexes for four MSA’s (metropolitan statistical areas) – Denver, San Francisco, Miami, and Boston.

CScities

The price “bubble” was more dramatic in some cities than others.

Forecasting Housing Prices and Housing Starts

The challenge to predictive modeling is more or less the same – how to account for a curve which initially rises, and then falls (in some cases dramatically), “stabilizes” and begins to climb again, although with increased volatility, again as long term interest rates rise. 

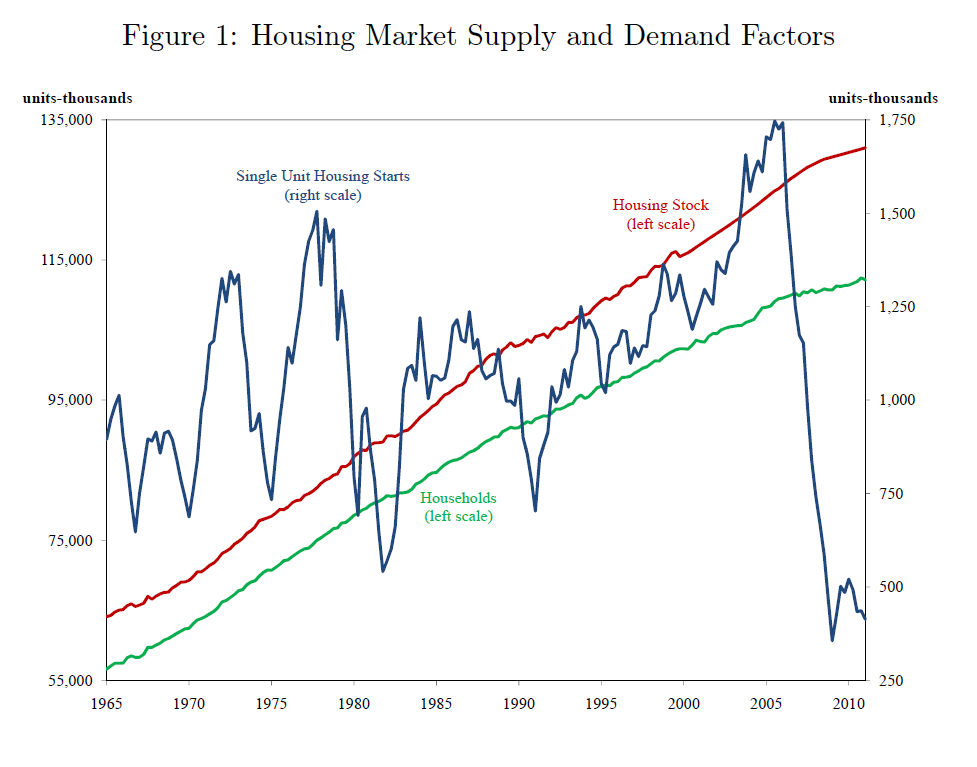
Volatility is a feature of housing starts, also, when compared with growth in households and the housing stock, as highlighted in the following graphic taken from an econometric analysis by San Francisco Federal Reserve analysts.

SandDfactorshousingThe fluctuations in housing starts track with drivers such as employment, energy prices, prices of construction materials, and real mortgage rates, but the short term forecasting models, including variables such as current listings and even Internet search activity, are promising.

Companies operating in this space include CoreLogic, Zillow and Moody’s Analytics. The sweet spot in all these services is to disaggregate housing price forecasts more local levels – the county level, for example.

Finally, in this survey of resources, one of the best housing and real estate blogs is Calculated Risk.

I’d like to post more on these predictive efforts, their statistical rationale, and their performance.

Also, the Federal Reserve “taper” of Quantitative Easing (QE) currently underway is impacting long term interest rates and mortgage rates.

The key question is whether the US housing market can withstand return to “normal” interest rate conditions in the next one to two years, and how that will play out.