Tag Archives: Big Data

Forecasting Shale Oil/Gas Decline Rates

Forecasting and data analytics increasingly are recognized as valued partners in nonconventional oil and gas production.

Fracking and US Oil/Gas Production

“Video Friday” here presented a YouTube with Brian Ellis – a Michigan University engineer – discussing hydraulic fracturing and horizontal drilling (“fracking”).

USannualoilprod

Fracking produced the hockey stick at the end of this series.

These new technologies also are responsible for a bonanza of natural gas, so much that it often has nowhere to go – given the limited pipeline infrastructure and LNG processing facilities.

shalegasprod

Rapid Decline Curves for Fracking Oil and Gas

In contrast to conventional wells, hydraulic fracturing and horizontal drilling (“fracking”) produces oil and gas wells with rapid decline curves.

Here’s an illustration from the Penn State Department of Energy and Mineral Engineering site,

Pennstatedeclinecurve

The two legends at the bottom refer to EUR’s– estimated ultimate recovery times (click to enlarge).

Conventional oil fields typically have decline rates on the order of 5 percent per year.

Shale oil and gas wells, on the other hand, may produce 50 percent or more of their total EUR in their first year of operation.

There are physical science fundamentals behind this, explained, for example, in

Decline and depletion rates of oil production: a comprehensive investigation

You can talk, for example, of shale production being characterized by a Transient Flow Period followed by Boundary Dominated Flow (BDF).

And these rapid decline rates have received a lot of recent attention in the media:

Could The ‘Shale Oil Miracle’ Be Just A Pipe Dream?

Wells That Fizzle Are a ‘Potential Show Stopper’ for the Shale Boom

Is the U.S. Shale Boom Going Bust?

Forecasting and Data Analytics

One forecasting problem in this context, therefore, is simply to take histories from wells and forecast their EUR’s.

Increasingly, software solutions are applying automatic fitting methods to well data to derive decline curves and other shale oil and gas field parameters.

Here is an interesting product called Value Navigator.

This whole subject is developing rapidly, and huge changes in the US industry are expected, if oil and gas prices continue below $60 a barrel and $4 MMBtu.

The forecasting problem may shift from well and oil field optimization to evaluation of the wider consequences of recent funding of the shale oil and gas boom. But, again, the analytics are available to do this, to a large extent, and I want to post up some of what I have discovered in this regard.

Links – mid-September

After highlighting billionaires by state, I focus on data analytics and marketing, and then IT in these links. Enjoy!

The Wealthiest Individual In Every State [Map]

wealthyindividuals

Data Analytics and Marketing

A Predictive Analytics Primer

Has your company, for example, developed a customer lifetime value (CLTV) measure? That’s using predictive analytics to determine how much a customer will buy from the company over time. Do you have a “next best offer” or product recommendation capability? That’s an analytical prediction of the product or service that your customer is most likely to buy next. Have you made a forecast of next quarter’s sales? Used digital marketing models to determine what ad to place on what publisher’s site? All of these are forms of predictive analytics.

Making sense of Google Analytics audience data

Earlier this year, Google added Demographics and Interest reports to the Audience section of Google Analytics (GA). Now not only can you see how many people are visiting your site, but how old they are, whether they’re male or female, what their interests are, and what they’re in the market for.

Data Visualization, Big Data, and the Quest for Better Decisions – a Synopsis

Simon uses Netflix as a prime example of a company that gets data and its use “to promote experimentation, discovery, and data-informed decision-making among its people.”….

They know a lot about their customers.

For example, the company knows how many people binge-watched the entire season four of Breaking Bad the day before season five came out (50,000 people). The company therefore can extrapolate viewing patterns for its original content produced to appeal to Breaking Bad fans. Moreover, Netflix markets the same show differently to different customers based on whether their viewing history suggests they like the director or one of the stars….

The crux of their analytics is the visualization of “what each streaming customer watches, when, and on what devices, but also at what points shows are paused and resumed (or not) and even the color schemes of the marketing graphics to which individuals respond.”

How to Market Test a New Idea

Formulate a hypothesis to be tested. Determine specific objectives for the test. Make a prediction, even if it is just a wild guess, as to what should happen. Then execute in a way that enables you to accurately measure your prediction…Then involve a dispassionate outsider in the process, ideally one who has learned through experience how to handle decisions with imperfect information…..Avoid considering an idea in isolation. In the absence of choice, you will almost always be able to develop a compelling argument about why to proceed with an innovation project. So instead of asking whether you should invest in a specific project, ask if you are more excited about investing in Project X versus other alternatives in your innovation portfolio…And finally, ensure there is some kind of constraint forcing a decision.

Information Technology (IT)

5 Reasons why Wireless Charging Never Caught on

Charger Bundling, Limited handsets, Time, Portability, and Standardisation – interesting case study topic for IT

Why Jimmy the Robot Means New Opportunities for IT

While Jimmy was created initially for kids, the platform is actually already evolving to be a training platform for everyone. There are two versions: one at $1,600, which really is more focused on kids, and one at $16,000, for folks like us who need a more industrial-grade solution. The Apple I wasn’t just for kids and neither is Jimmy. Consider at least monitoring this effort, if not embracing it, so when robots go vertical you have the skills to ride this wave and not be hit by it.

jimmy-the-robot

Beyond the Reality Distortion Field: A Sober Look at Apple Pay

.. Apple Pay could potentially kick-start the mobile payment business the way the iPod and iTunes launched mobile music 13 years ago. Once again, Apple is leveraging its powerful brand image to bring disparate companies together all in the name of consumer convenience.

From Dr. 4Ward How To Influence And Persuade (click to enlarge)

influence

Links – Labor Day Weekend

Tech

Amazon’s Cloud Is So Pervasive, Even Apple Uses It

Your iCloud storage is apparently on Amazon.

Amazon’s Cloud Is The Fastest Growing Software Business In History

AWS

AWS is Amazon Web Services. The author discounts Google growth, since it is primarily a result of selling advertising. 

How Microsoft and Apple’s Ads Define Their Strategy

Microsoft approaches the market from the top down, while Apple goes after the market from the bottom up.

Mathematical Predictions for the iPhone 6

Can you predict features of the iPhone6 scheduled to be released September 6?

iphoneplot

Predictive Analytics

Comparison of statistical software

Good links for R, Matlab, SAS, Stata, and SPSS.

Types and Uses of Predictive Analytics, What they are and Where You Can Put Them to Work

Gartner says that predictive analytics is a mature technology yet only one company in eight is currently utilizing this ability to predict the future of sales, finance, production, and virtually every other area of the enterprise. What is the promise of predictive analytics and what exactly are they [types and uses of predictive analytics]? Good highlighting of main uses of predictive analytics in companies.

The Four Traps of Predictive Analytics

Magical thinking/ Starting at the Top/ Building Cottages, not Factories/ Seeking Purified Data. Good discussion. This short article in the Sloan Management Review is spot on, in my opinion. The way to develop good predictive analytics is to pick an area, indeed, pick the “low-handing fruit.” Develop workable applications, use them, improve them, broaden the scope. The “throw everything including the kitchen sink” approach of some early Big Data deployments is almost bound to fail. Flashy, trendy, but, in the final analysis, using “exhaust data” to come up with obscure customer metrics probably will not cut in the longer run.

Economic Issues

The Secular Stagnation Controversy

– discusses the e-book Secular Stagnation: Facts, Causes and Cures. The blogger Timothy Taylor points out that “secular” here has no relationship to lacking a religious context, but refers to the idea that market economies, or, if you like, capitalist economies, can experience long periods (decade or more) of desultory economic growth. Check the e-book for Larry Summer’s latest take on the secular stagnation hypothesis.

Here’s how much aid the US wants to send foreign countries in 2015, and why (INFOGRAPHIC

foreignaid

Links – late August 2014

Economics Articles, Some Theoretical, Some Applied

Who’s afraid of inflation? Not Fed Chair Janet Yellen At Jackson Hole, Yellen speech on labor market conditions states that 2 percent inflation is not a hard ceiling for the Fed.

Economist’s View notes a new paper which argues that deflation is simply unnecessary, because the conditions for a “helicopter drop” of money (Milton Friedman’s metaphor) are widely met.

Three conditions must be satisfied for helicopter money always to boost aggregate demand. First, there must be benefits from holding fiat base money other than its pecuniary rate of return. Second, fiat base money is irredeemable – viewed as an asset by the holder but not as a liability by the issuer. Third, the price of money is positive. Given these three conditions, there always exists – even in a permanent liquidity trap – a combined monetary and fiscal policy action that boosts private demand – in principle without limit. Deflation, ‘lowflation’ and secular stagnation are therefore unnecessary. They are policy choices.

Stiglitz: Austerity ‘Dismal Failure,’ New Approach Needed

US housing market loses momentum

Fannie Mae economists have downgraded their expectations for the U.S. housing market in the second half of this year, even though they are more optimistic about the prospects for overall economic growth.

How Detroit’s Water Crisis Is Part Of A Much Bigger Problem

“Have we truly become a society to where we’ll go and build wells and stuff in third world countries but we’ll say to hell with our own right here up under our nose, our next door neighbors, the children that our children play with?”

Economic harassment and the Ferguson crisis

According to .. [ArchCity Defenders] recent report .. the Ferguson court is a “chronic offender” in legal and economic harassment of its residents….. the municipality collects some $2.6 million a year in fines and court fees, typically from small-scale infractions like traffic violations…the second-largest source of income for that small, fiscally-strapped municipality….

And racial profiling appears to be the rule. In Ferguson, “86% of vehicle stops involved a black motorist, although blacks make up just 67% of the population,” the report states. “After being stopped in Ferguson, blacks are almost twice as likely as whites to be searched (12.1% vs. 7.9%) and twice as likely to be arrested.” But those searches result in the discovery of contraband at a much lower rate than searches of whites.

Once the process begins, the system begins to resemble the no-exit debtors’ prisons of yore. “Clients reported being jailed for the inability to pay fines, losing jobs and housing as a result of the incarceration, being refused access to the Courts if they were with their children or other family members….

“By disproportionately stopping, charging, and fining the poor and minorities, by closing the Courts to the public, and by incarcerating people for the failure to pay fines, these policies unintentionally push the poor further into poverty, prevent the homeless from accessing the housing, treatment, and jobs they so desperately need to regain stability in their lives, and violate the Constitution.” And they increase suspicion and disrespect for the system.

… the Ferguson court processed the equivalent of three warrants and $312 in fines per household in 2013.

Science

Astronauts find living organisms clinging to the International Space Station, and aren’t sure how they got there

international-space-station-complete-640x408

A Mathematical Proof That The Universe Could Have Formed Spontaneously From Nothing

What caused the Big Bang itself? For many years, cosmologists have relied on the idea that the universe formed spontaneously, that the Big Bang was the result of quantum fluctuations in which the Universe came into existence from nothing.

1_INtAsuxJF7cMqoCBmesz-w

Big Data Trends In 2014 (infographic – click to enlarge)

Aureus-analytics-infographic-option-2

e-commerce and Forecasting

The Census Bureau announced numbers from its latest e-commerce survey August 15.

The basic pattern continues. US retail e-commerce sales increased about 16 percent on a year-over-year basis from the second quarter of 2013. By comparison, total retail sales for the second quarter 2014 increased just short of 5 percent on a year-over-year basis.

 ecommercepercent

As with other government statistics relating to IT (information technology), one can quarrel with the numbers (they may, for example, be low), but there is impressive growth no matter how you cut it.

Some of the top e-retailers from the standpoint of clicks and sales numbers are listed in Panagiotelis et al. Note these are sample data, from comScore with the totals for each company or site representing a small fraction of their actual 2007 online sales.

eretailers

Forecasting Issues

Forecasting issues related to e-commerce run the gamut.

Website optimization and target marketing raise questions such as the profitability of “stickiness” to e-commerce retailers. There are advanced methods to tease out nonlinear, nonnormal multivariate relationships between, say, duration and page views and the decision to purchase – such as copulas previously applied in financial risk assessment and health studies.

Mobile e-commerce is a rapidly growing area with special platform and communications characteristics all its own.

Then, there are the pros and cons of expanding tax collection for online sales.

All in all, Darrell Rigby’s article in the Harvard Business Review – The Future of Shopping – is hard to beat. Traditional retailers generally have to move to a multi-channel model, supplementing brick-and-mortar stores with online services.

I plan several posts on these questions and issues, and am open for your questions.

Top graphic by DIGISECRETS

First peek at “Revolutions” exhibit at Computer History Museum with Woz

I think Steve Wozniack is a kind of hero – from what I understand still connected with helping young people and in this video, giving some “straight from the horses mouth” commentary on the history of computing. 

And I am making plans to return to pattern on this blog.

That is, I will be focusing on issues tagged a couple of posts ago – namely geopolitical risks (ebola, unfolding warfare at several locations), the emerging financial bubble, and 21st century data analysis and forecasting techniques.

But, I think perhaps a little like Woz, I am a technological utopian at heart. If we could develop technologies which would allow younger people around the globe some type of “hands on” potential – maybe a little like the old computer systems which these technical leaders, now mostly all billionaires, had access to – if we could find these new technologies, I think we could knit the world together once again. Of course, this idea devolves when the “hands on” potential is occasioned by weapons – and the image of the child soldiers in Africa comes to mind.

I like the part in the video where Woz describes using a nonstandard card punch machine to get his card deck in order at Berkeley – the part where he draws a lesson about learning to do what works, not what the symbols indicate.

When the Going Gets Tough, the Tough Get Going

Great phrase, but what does it mean? Well, maybe it has something to do with the fact that a lot of economic and political news seem to be entering kind of “end game.” But, it’s now the “lazy days of summer,” and there is a temptation to sit back and just watch it whiz by.

What are the options?

One is to go more analytical. I’ve recently updated my knowledge base on some esoteric topics –mathematically and analytically interesting – such as kernel ridge regression and dynamic principal components. I’ve previously mentioned these, and there are more instances of analysis to consider. What about them? Are they worth the enormous complexity and computational detail?

Another is to embrace the humming, buzzing confusion and consider “geopolitical risk.” The theme might be the price of oil and impacts, perhaps, of continuing and higher oil prices.

Or the proliferation of open warfare.

Rarely in recent decades have we seen outright armed conflict in Europe, as appears to be on-going in the Ukraine.

And I cannot make much sense of developments in the Mid-East, with some shadowy group called Isis scooping up vast amounts of battlefield armaments abandoned by collapsing Iraqi units.

Or how to understand Israeli bombardment of UN schools in Gaza, and continuing attacks on Israel with drones by Hamas. What is the extent and impact of increasing geopolitical risk?

There also is the issue of plague – most immediately ebola in Africa. A few days ago, I spent the better part of a day in the Boston Airport, and, to pass the time, read the latest Dan Brown book about a diabolical scheme to release an aerosol epidemic of sorts. In any case, ebola is in a way a token of a range of threats that stand just outside the likely. For example, there is the problem of the evolution of immune strains of bacteria, with widespread prescription and use.

There also is the ever-bloating financial bubble that has emerged in the US and elsewhere, as a result of various tactics of central and other banks in reaction to the Great Recession, and behavior of investors.

Finally, there are longer range scientific and technological possibilities. From my standpoint, we are making a hash of things generally. But efforts at political reform, by themselves, usually fall short, unless paralleled by fundamental new possibilities in production or human organization. And the promise of radical innovation for the betterment of things has never seemed brighter.

I will be exploring some of these topics and options in coming posts this week and in coming weeks.

And I think by now I have discovered a personal truth through writing – one that resonates with other experiences of mine professionally and personally. And that is sometimes it is just when the way to going further seems hard to make out that concentration of thought and energies may lead to new insight.

Links early August 2014

Economy/Business

Economists React to July’s Jobs Report: ‘Not Weak, But…’

U.S. nonfarm employers added 209,000 jobs in July, slightly below forecasts and slower than earlier gains, while the unemployment rate ticked up to 6.2% from June. But employers have now added 200,000 or more jobs in six consecutive months for the first time since 1997.

The most important charts to see before the huge July jobs report – interesting to see what analysts were looking at just before the jobs announcement.

Despite sharp selloff, too early to worry about a correction

Venture Capital: Deals Beyond the Valley

7 Most Expensive Luxury Cars

BMW

Base price $136,000.

Contango And Backwardation Strategy For VIX ETFs Here you go!

Climate/Weather

Horrid California Drought Gets Worse Has a map showing drought conditions at intervals since 2011, dramatic.

IT

Amazon’s Cloud Is Growing So Fast It’s Scaring Shareholders

Amazon has pulled off a pretty amazing trick over the past decade. It’s invented and then built a nearly $5 billion cloud computing business catering to fickle software developers and put the rest of the technology industry on the defensive. Big enterprise software companies such as IBM and HP and even Google are playing catchup, even as they acknowledge that cloud computing is the tech industry’s future.

But what kind of a future is that to be? Yesterday Amazon said that while its cloud business grew by 90 percent last year, it was significantly less profitable. Amazon’s AWS cloud business makes up the majority of a balance sheet item it labels as “other” (along with its credit card and advertising revenue) and that revenue from that line of business grew by 38 percent. Last quarter, revenue grew by 60 percent. In other words, Amazon is piling on customers faster than it’s adding dollars to its bottom line.

The Current Threat

Infographic: Ebola By the Numbers

ebola

Data Science

Statistical inference in massive data sets Interesting and applicable procedure illustrated with Internet traffic numbers.

Seasonal Adjustment – A Swirl of Controversies

My reading on procedures followed by the Bureau of Labor Statistics (BLS) and the Bureau of Economic Analysis (BLS) suggests some key US macroeconomic data series are in a profound state of disarray. Never-ending budget cuts to these “non-essential” agencies, since probably the time of Bill Clinton, have taken their toll.

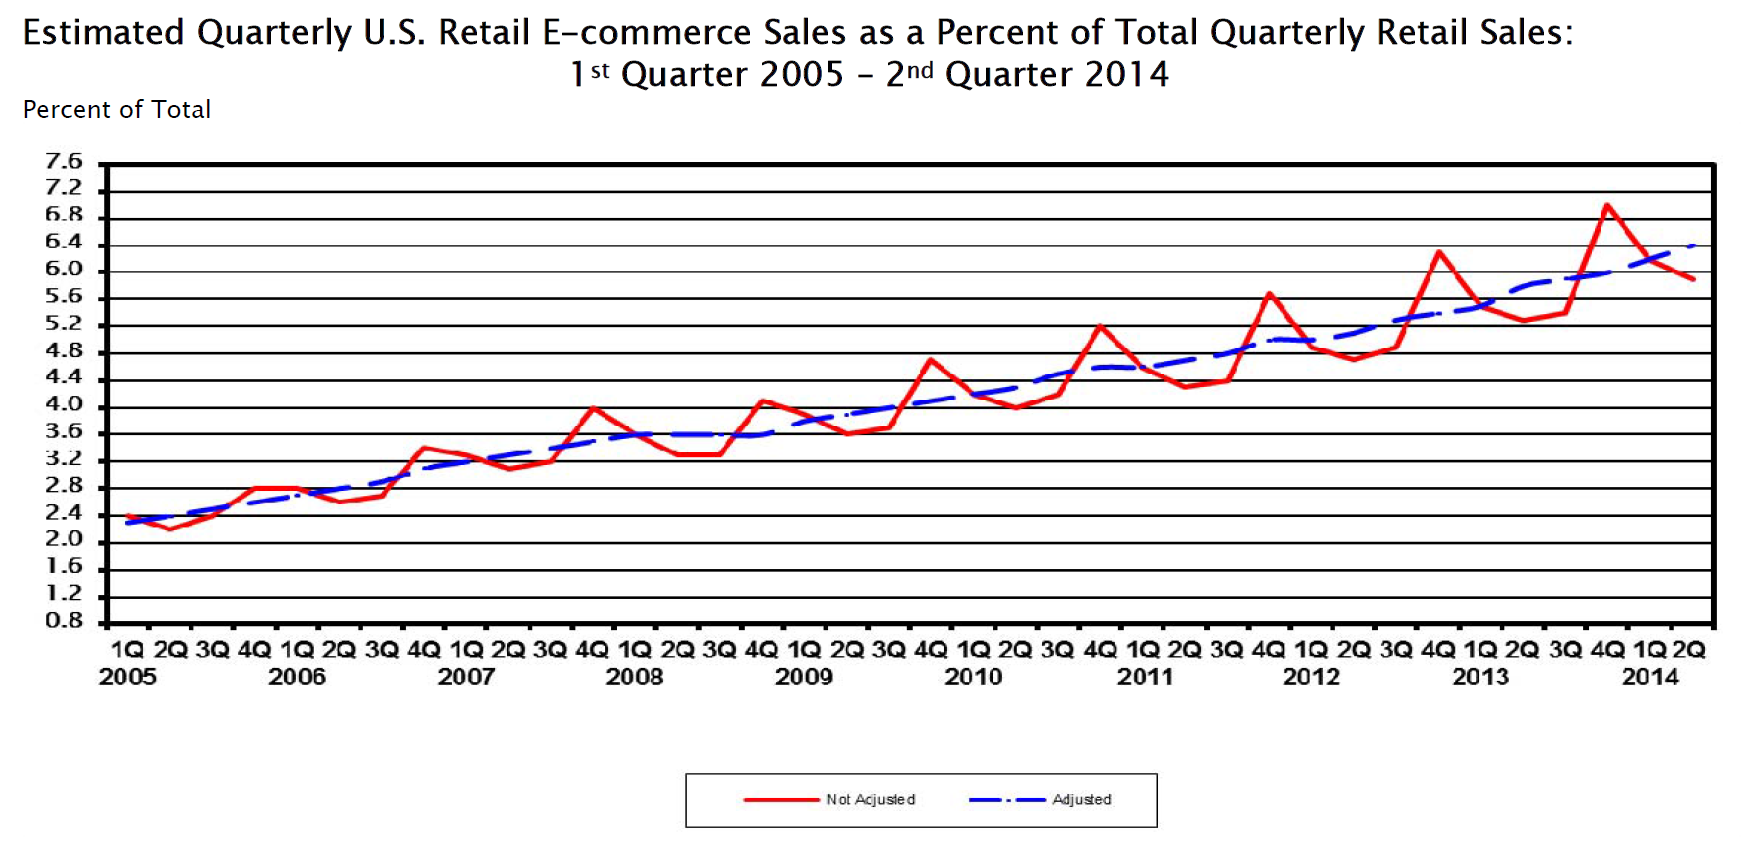
For example, for some years now it has been impossible for independent analysts to verify or replicate real GDP and many other numbers issued by the BEA, since, only SA (seasonally adjusted) series are released, originally supposedly as an “economy measure.” Since estimates of real GDP growth by quarter are charged with political significance in an Election Year, this is a potential problem. And the problem is immediate, since the media naturally will interpret a weak 2nd quarter growth – less than, say, 2.9 percent – as a sign the economy has slipped into recession.

Evidence of Political Pressure on Government Statistical Agencies

John Williams has some fame with his site Shadow Government Statistics. But apart from extreme stances from time to time (“hyperinflation”), he does document the politicization of the BLS Consumer Price Index (CPI).

In a recent white paper called No. 515—PUBLIC COMMENT ON INFLATION MEASUREMENT AND THE CHAINED-CPI (C-CPI), Williams cites Katharine Abraham, former commissioner of the Bureau of Labor Statistics, when she notes,

“Back in the early winter of 1995, Federal Reserve Board Chairman Alan Greenspan testified before the Congress that he thought the CPI substantially overstated the rate of growth in the cost of living. His testimony generated a considerable amount of discussion. Soon afterwards, Speaker of the House Newt Gingrich, at a town meeting in Kennesaw, Georgia, was asked about the CPI and responded by saying, ‘We have a handful of bureaucrats who, all professional economists agree, have an error in their calculations. If they can’t get it right in the next 30 days or so, we zero them out, we transfer the responsibility to either the Federal Reserve or the Treasury and tell them to get it right.’”[v]

Abraham is quoted in newspaper articles as remembering sitting in Republican House Speaker Newt Gingrich’s office:

“ ‘He said to me, If you could see your way clear to doing these things, we might have more money for BLS programs.’ ” [vi]

The “things” in question were to move to quality adjustments for the basket of commodities used to calculate the CPI. The analogue today, of course, is the chained-CPI measure which many suggest is being promoted to slow cost-of-living adjustments in Social Security payments.

Of course, the “real” part in real GDP is linked with the CPI inflation outlook though a process supervised by the BEA.

Seasonal Adjustment Procedures for GDP

Here is a short video by Johnathan H. Wright, a young economist whose Unseasonal Seasonals? is featured in a recent issue of the Brookings Papers on Economic Activity.

Wright’s research is interesting to forecasters, because he concludes that algorithms for seasonally adjusting GDP should be selected based on their predictive performance.

Wright favors state-space models, rather than the moving-average techniques associated with the X-12 seasonal filters that date back to the 1980’s and even the 1960’s.

Given BLS methods of seasonal adjustment, seasonal and cyclical elements are confounded in the SA nonfarm payrolls series, due to sharp drops in employment concentrated in the November 2008 to March 2009 time window.

The upshot – initially this effect pushed reported seasonally adjusted nonfarm payrolls up in the first half of the year and down in the second half of the year, by slightly more than 100,000 in both cases…

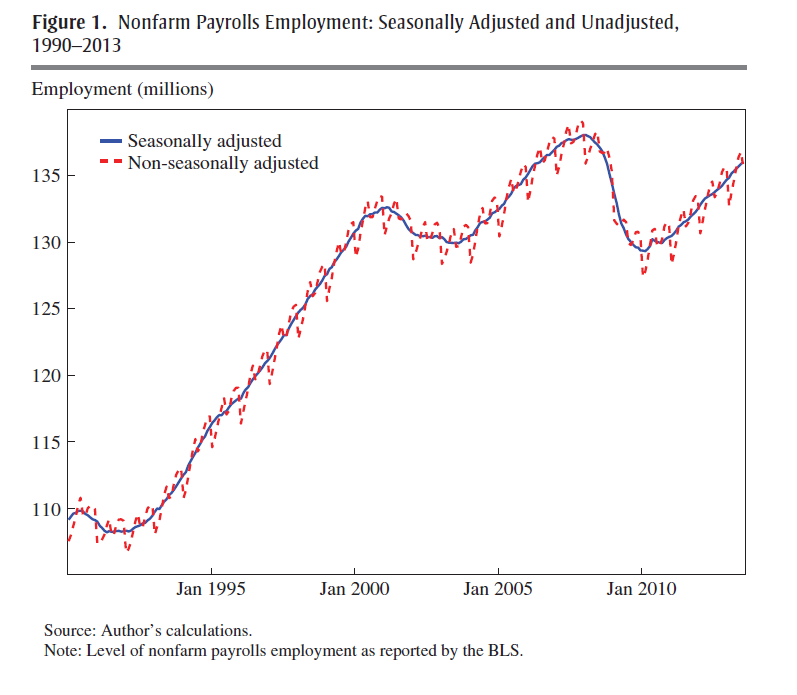
One of his prime exhibits compares SA and NSA nonfarm payrolls, showing that,

The regular within-year variation in employment is comparable in magnitude to the effects of the 1990–1991 and 2001 recessions. In monthly change, the average absolute difference between the SA and NSA number is 660,000, which dwarfs the normal month-over-month variation in the SA data.

SEASnonseas

The basic procedure for this data and most releases since 2008-2009 follows what Wright calls the X-12 process.

The X-12 process focuses on certain types of centered moving averages with a fixed weights, based on distance from the central value.

A critical part of the X-12 process involves estimating the seasonal factors by taking weighted moving averages of data in the same period of different years. This is done by taking a symmetric n-term moving average of m-term averages, which is referred to as an n × m seasonal filter. For example, for n = m = 3, the weights are 1/3 on the year in question, 2/9 on the years before and after, and 1/9 on the two years before and after.16 The filter can be a 3 × 1, 3 × 3, 3 × 5, 3 × 9, 3 × 15, or stable filter. The stable filter averages the data in the same period of all available years. The default settings of the X-12…involve using a 3 × 3, 3 × 5, or 3 × 9 seasonal filter, depending on [various criteria]

Obviously, a problem arises at the beginning and at the end of the time series data. A work-around is to use an ARIMA model to extend the time series back and forward in time sufficiently to calculate these centered moving averages.

Wright shows these arbitrary weights and time windows lead to volatile seasonal adjustments, and that, predictively, the BEA and BLS would be better served with a state-space model based on the Kalman filter.

Loopy seasonal adjustment leads to controversy that airs on the web – such as this piece by Zero Hedge from 2012 which highlights the “ficititious” aspect of seasonal adjustments of highly tangible series, such as the number of persons employed –

What is very notable is that in January, absent BLS smoothing calculation, which are nowhere in the labor force, but solely in the mind of a few BLS employees, the real economy lost 2,689,000 jobs, while net of the adjustment, it actually gained 243,000 jobs: a delta of 2,932,000 jobs based solely on statistical assumptions in an excel spreadsheet!

To their credit, Census now documents an X-13ARIMA-SEATS Seasonal Adjustment Program with software incorporating elements of the SEATS procedure originally developed at the Bank of Spain and influenced by the state space models of Andrew Harvey.

Maybe Wright is getting some traction.

What Is The Point of Seasonal Adjustment?

You can’t beat the characterization, apparently from the German Bundesbank, of the purpose and objective of “seasonal adjustment.”

..seasonal adjustment transforms the world we live in into a world where no seasonal and working-day effects occur. In a seasonally adjusted world the temperature is exactly the same in winter as in the summer, there are no holidays, Christmas is abolished, people work every day in the week with the same intensity (no break over the weekend)..

I guess the notion is that, again, if we seasonally adjust and see a change in direction of a time series, why then it probably is a change in trend, rather than from special uses of a certain period.

But I think most of the professional forecasting community is beyond just taking their cue from a single number. It would be better to have the raw or not seasonally adjusted (NSA) series available with every press release, so analysts can apply their own models.

Video Friday – Quantum Computing

I’m instituting Video Friday. It’s the end of the work week, and videos introduce novelty and pleasant change in communications.

And we can keep focusing on matters related to forecasting applications and data analytics, or more generally on algorithmic guides to action.

Today I’m focusing on D-Wave and quantum computing. This could well could take up several Friday’s, with cool videos on underlying principles and panel discussions with analysts from D-Wave, Google and NASA. We’ll see. Probably, I will treat it as a theme, returning to it from time to time.

A couple of introductory comments.

First of all, David Wineland won a Nobel Prize in physics in 2012 for his work with quantum computing. I’ve heard him speak, and know members of his family. Wineland did his work at the NIST Laboratories in Boulder, the location for Eric Cornell’s work which was awarded a Nobel Prize in 2001.

I mention this because understanding quantum computing is more or less like trying to understand quantum physics, and, there, I think engineering has a role to play.

The basic concept is to exploit quantum superimposition, or perhaps quantum entanglement, as a kind of parallel processor. The qubit, or quantum bit, is unlike the bit of classical computing. A qubit can be both 0 and 1 simultaneously, until it’s quantum wave equation is collapsed or dispersed by measurement. Accordingly, the argument goes, qubits scale as powers of 2, and a mere 500 qubits could more than encode all atoms in the universe. Thus, quantum computers may really shine at problems where you have to search through all different combinations of things.

But while I can write the quantum wave equation of Schrodinger, I don’t really understand it in any basic sense. It refers to a probability wave, whatever that is.

Feynman, whose lectures (and tapes or CD’s) on physics I proudly own, says it is pointless to try to “understand” quantum weirdness. You have to be content with being able to predict outcomes of quantum experiments with the apparatus of the theory. The theory is highly predictive and quite successful, in that regard.

So I think D-Wave is really onto something. They are approaching the problem of developing a quantum computer technologically.

Here is a piece of fluff Google and others put together about their purchase of a D-Wave computer and what’s involved with quantum computing.

OK, so now here is Eric Ladizinsky in a talk from April of this year on Evolving Scalable Quantum Computers. I can see why Eric gets support from DARPA and Bezos, a range indeed. You really get the “ah ha” effect listening to him. For example, I have never before heard a coherent explanation of how the quantum weirdness typical for small particles gets dispersed with macroscopic scale objects, like us. But this explanation, which is mathematically based on the wave equation, is essential to the D-Wave technology.

It takes more than an hour to listen to this video, but, maybe bookmark it if you pass on from a full viewing, since I assure you that this is probably the most substantive discussion I have yet found on this topic.

But is D-Wave’s machine a quantum computer?

Well, they keep raising money.

D-Wave Systems raises $30M to keep commercializing its quantum computer

But this infuriates some in the academic community, I suspect, who distrust the announcement of scientific discovery by the Press Release.

There is a brilliant article recently in Wired on D-Wave, which touches on a recent challenge to its computational prowess (See Is D-Wave’s quantum computer actually a quantum computer?)

The Wired article gives Geordie Rose, a D-Wave founder, space to rebut at which point these excellent comments can be found:

Rose’s response to the new tests: “It’s total bullshit.”

D-Wave, he says, is a scrappy startup pushing a radical new computer, crafted from nothing by a handful of folks in Canada. From this point of view, Troyer had the edge. Sure, he was using standard Intel machines and classical software, but those benefited from decades’ and trillions of dollars’ worth of investment. The D-Wave acquitted itself admirably just by keeping pace. Troyer “had the best algorithm ever developed by a team of the top scientists in the world, finely tuned to compete on what this processor does, running on the fastest processors that humans have ever been able to build,” Rose says. And the D-Wave “is now competitive with those things, which is a remarkable step.”

But what about the speed issues? “Calibration errors,” he says. Programming a problem into the D-Wave is a manual process, tuning each qubit to the right level on the problem-solving landscape. If you don’t set those dials precisely right, “you might be specifying the wrong problem on the chip,” Rose says. As for noise, he admits it’s still an issue, but the next chip—the 1,000-qubit version codenamed Washington, coming out this fall—will reduce noise yet more. His team plans to replace the niobium loops with aluminum to reduce oxide buildup….

Or here’s another way to look at it…. Maybe the real problem with people trying to assess D-Wave is that they’re asking the wrong questions. Maybe his machine needs harder problems.

On its face, this sounds crazy. If plain old Intels are beating the D-Wave, why would the D-Wave win if the problems got tougher? Because the tests Troyer threw at the machine were random. On a tiny subset of those problems, the D-Wave system did better. Rose thinks the key will be zooming in on those success stories and figuring out what sets them apart—what advantage D-Wave had in those cases over the classical machine…. Helmut Katzgraber, a quantum scientist at Texas A&M, cowrote a paper in April bolstering Rose’s point of view. Katzgraber argued that the optimization problems everyone was tossing at the D-Wave were, indeed, too simple. The Intel machines could easily keep pace..

In one sense, this sounds like a classic case of moving the goalposts…. But D-Wave’s customers believe this is, in fact, what they need to do. They’re testing and retesting the machine to figure out what it’s good at. At Lockheed Martin, Greg Tallant has found that some problems run faster on the D-Wave and some don’t. At Google, Neven has run over 500,000 problems on his D-Wave and finds the same....

..it may be that quantum computing arrives in a slower, sideways fashion: as a set of devices used rarely, in the odd places where the problems we have are spoken in their curious language. Quantum computing won’t run on your phone—but maybe some quantum process of Google’s will be key in training the phone to recognize your vocal quirks and make voice recognition better. Maybe it’ll finally teach computers to recognize faces or luggage. Or maybe, like the integrated circuit before it, no one will figure out the best-use cases until they have hardware that works reliably. It’s a more modest way to look at this long-heralded thunderbolt of a technology. But this may be how the quantum era begins: not with a bang, but a glimmer.