Tag Archives: forecasting research

An Update on Bitcoin

Fairly hum-drum days of articles on testing for unit roots in time series led to discovery of an extraordinary new forecasting approach – using the future to predict the present.

Since virtually the only empirical application of the new technique is predicting bubbles in Bitcoin values, I include some of the recent news about Bitcoins at the end of the post.

Noncausal Autoregressive Models

I think you have to describe the forecasting approach recently considered by Lanne and Saikkonen, as well as Hencic, Gouriéroux and others, as “exciting,” even “sexy” in a Saturday Night Live sort of way.

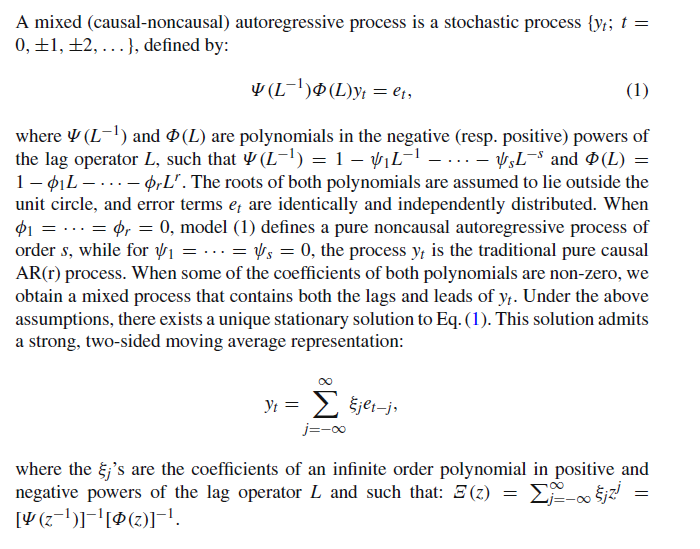
Here is a brief description from a 2015 article in the Econometrics of Risk called Noncausal Autoregressive Model in Application to Bitcoin/USD Exchange Rates

noncausal

I’ve always been a little behind the curve on lag operators, but basically Ψ(L-1) is a function of the standard lagged operators, while Φ(L) is a second function of offsets to future time periods.

To give an example, consider,

yt = k1yt-1+s1yt+1 + et

where subscripts t indicate time period.

In other words, the current value of the variable y is related to its immediately past value, and also to its future value, with an error term e being included.

This is what I mean by the future being used to predict the present.

Ordinarily in forecasting, one would consider such models rather fruitless. After all, you are trying to forecast y for period t+1, so how can you include this variable in the drivers for the forecasting setup?

But the surprising thing is that it is possible to estimate a relationship like this on historic data, and then take the estimated parameters and develop simulations which lead to predictions at the event horizon, of, say, the next period’s value of y.

This is explained in the paragraph following the one cited above –

noncausal2

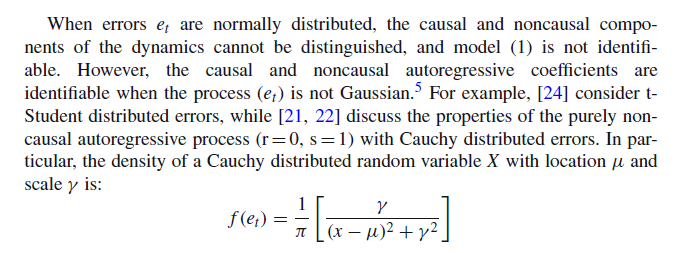
In other words, because et in equation (1) can have infinite variance, it is definitely not normally distributed, or distributed according to a Gaussian probability distribution.

This is fascinating, since many financial time series are associated with nonGaussian error generating processes – distributions with fat tails that often are platykurtotic.

I recommend the Hencic and Gouriéroux article as a good read, as well as interesting analytics.

The authors proposed that a stationary time series is overlaid by explosive speculative periods, and that something can be abstracted in common from the structure of these speculative excesses.

Mt. Gox, of course, mentioned in this article, was raided in 2013 by Japanese authorities, after losses of more than $465 million from Bitcoin holders.

Now, two years later, the financial industry is showing increasing interest in the underlying Bitcoin technology and Bitcoin prices are on the rise once again.

bitcoin

Anyway, the bottom line is that I really, really like a forecast methodology based on recognition that data come from nonGaussian processes, and am intrigued by the fact that the ability to forecast with noncausal AR models depends on the error process being nonGaussian.

One Month Forecast of SPY ETF Price Level – Extreme Value Prediction Algorithm (EVPA)

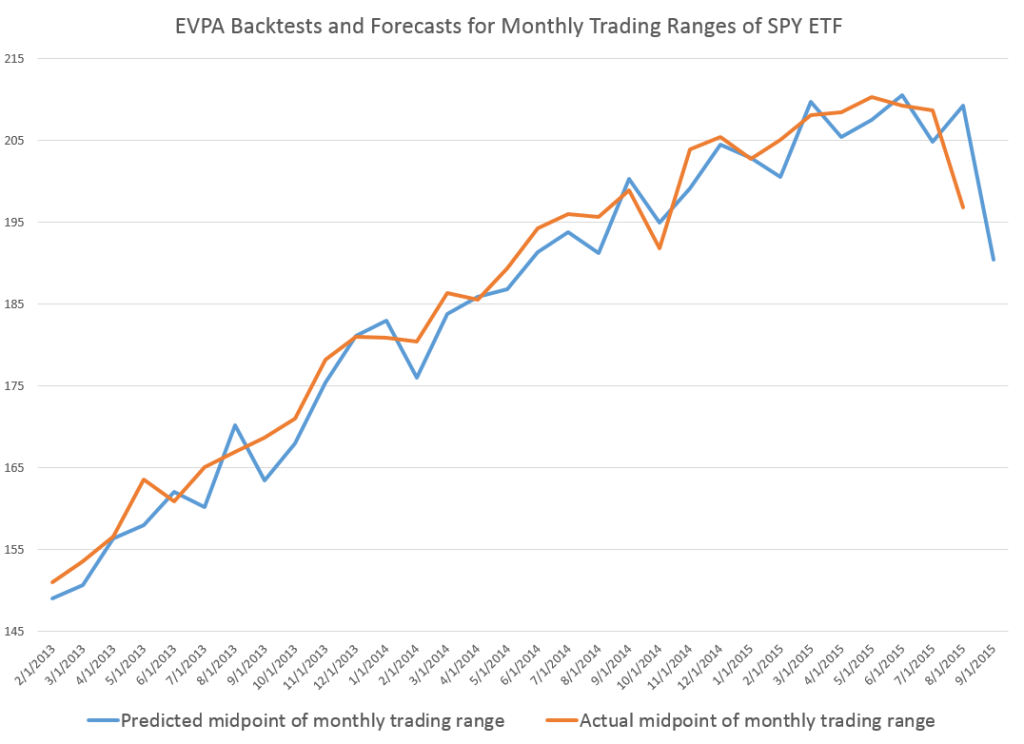
Here is a chart showing backtests and a prediction for the midpoints of the monthly trading ranges of the SPY exchange traded fund.

MonthSPY

The orange line traces out the sequence of actual monthly midpoints of the price range – the average of the high and low price for the month.

The blue line charts the backtests going back to 2013 and a forecast for September 2015 – which is the right-most endpoint of the blue line. The predicted September midpoint is $190.43.

The predictions come from the EVPA, an algorithm backtested to 1994 for the SPY. Since 1994, the forecast accuracy, measured by the MAPE or mean absolute percent error, is 2.4 percent. This significantly improves on a No Change model, one of the alternative forecast benchmarks for this series, and the OOS R2 of the forecast of the midpoint of the monthly trading range is a solid 0.33.

Just from eyeballing the graph above, it seems like there are systematic errors to the downside in the forecasts.

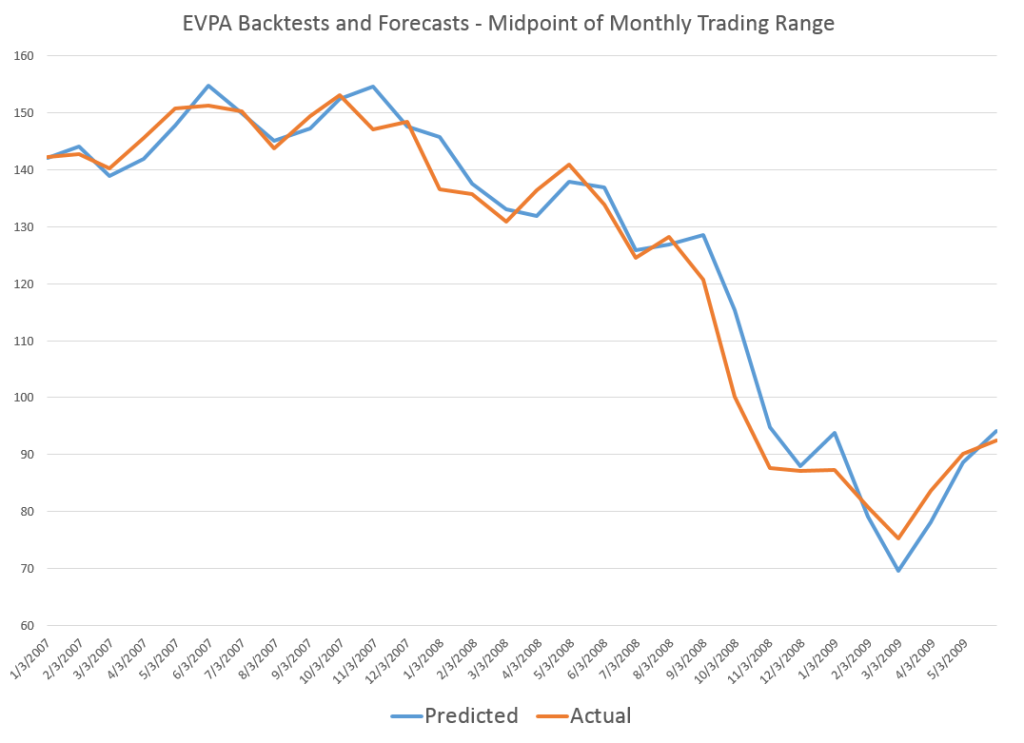
However, the reverse appears to happen, when the SPY prices are falling over a longer period of time.

2008SPYMonth

I would suggest, therefore, that the prediction of about $190 for September is probably going to be higher than the actual number.

Now – disclaimer. This discussion is provided for scientific and entertainment purposes only. We assume no responsibility for any trading actions taken, based on this information. The stock market, particularly now, is volatile. There are lots of balls in the air – China, potential Fed actions on interest rates, more companies missing profit expectations, and so forth – so literally anything may happen.

The EVPA is purely probabilistic. It is right more often than wrong. Its metrics are better than those of alternative forecast models in the cases I have studied. But, withal, it still is a gamble to act on its predictions.

But the performance of the EVPA is remarkable, and I believe further improvements are within reach.

Back to the Drawing Board

Well, not exactly, since I never left it.

But the US and other markets opened higher today, after round-the-clock negotiations on the Greek debt.

I notice that Jeff Miller of Dash of Insight frequently writes stuff like, We would all like to know the direction of the market in advance. Good luck with that! Second best is planning what to look for and how to react.

Running the EVPA with this morning’s pop up in the opening price of the SPY, I get a predicted high for the day of 210.17 and a predicted low of 207.5. The predicted low for the day will be spot-on, if the current actual low for the trading range holds.

I can think of any number of arguments to the point that the stock market is basically not predictable, because unanticipated events constantly make an impact on prices. I think it would even be possible to invoke Goedel’s Theorem – you know, the one that uses meta-mathematics to show that every axiomatic system of complexity greater than a group is essentially incomplete. There are always new truths.

On the other hand, backtesting the EVPA – extreme value prediction algorithm – is opening up new vistas. I’m appreciative of helpful comments of and discussions with professionals in the finance and stock market investing field.

I strain every resource to develop backtests which are out-of-sample (OOS), and recently have found a way to predict closing prices with resources from the EVPA.

MOnthlyROISPYevpa

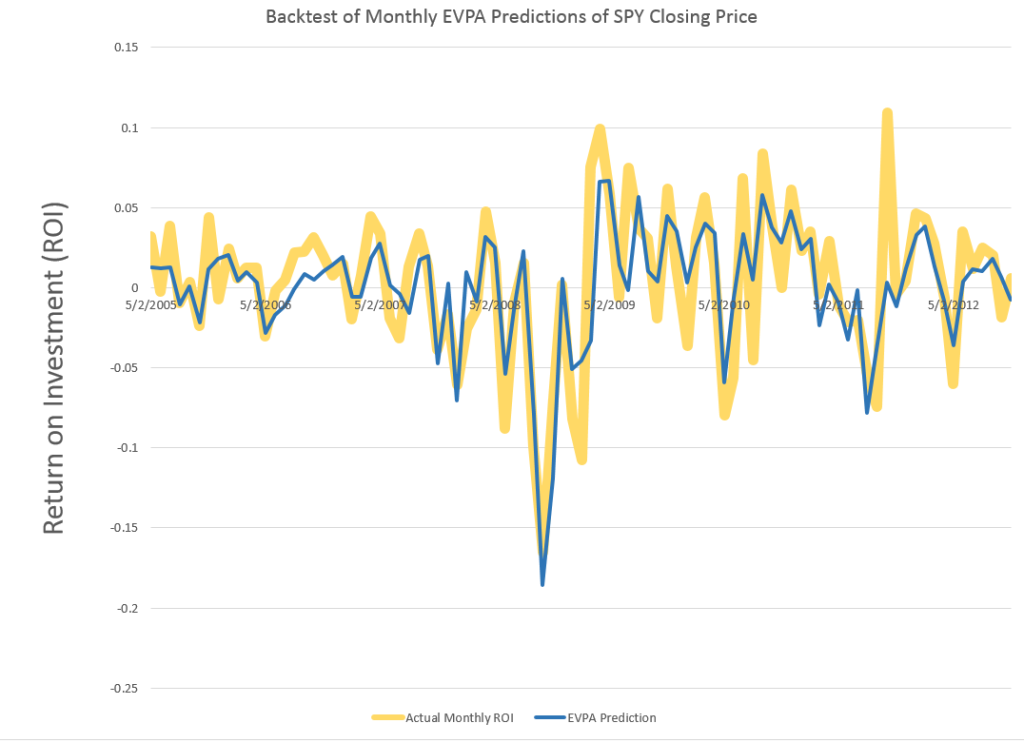
Great chart. The wider gold lines are the actual monthly ROI for the SPY, based on monthly closing prices. The blue line shows the OOS prediction of these closing prices, based on EVPA metrics. As you can see, the blue line predictions flat out miss or under-predict some developments in the closing prices. At the same time, in other cases, the EVPA predictions show uncanny accuracy, particularly in some of the big dips down.

Recognize this is something new. Rather than, say, predicting developments likely over a range of trading days – the high and low of a month, the  chart above shows predictions for stock prices at specific times, at the closing bell of the market the last trading day of each month.

I calculate the OOS R2 at 0.63 for the above series, which I understand is better than can be achieved with an autoregressive model for the closing prices and associated ROI’s.

I’ve also developed spreadsheets showing profits, after broker fees and short term capital gains taxes, from trading based on forecasts of the EVPA.

But, in addition to guidance for my personal trading, I’m interested in following out the implications of how much the historic prices predict about the prices to come.

Failures of Forecasting in the Greek Crisis

The resounding “No” vote today (Sunday, July 5) by Greeks vis a vis new austerity proposals of the European Commission and European Central Bank (ECB) is pivotal. The immediate task at hand this week is how to avoid or manage financial contagion and whether and how to prop up the Greek banking system to avoid complete collapse of the Greek economy.

Greekvote

Thousands celebrate Greece’s ‘No’ vote despite uncertainty ahead

Greece or, more formally, the Hellenic Republic, is a nation of about 11 million – maybe 2 percent of the population of the European Union (about 500 million). The country has a significance out of proportion to its size as an icon of many of the ideas of western civilization – such as “democracy” and “philosophy.”

But, if we can abstract momentarily from the human suffering involved, Greek developments have everything to do with practical and technical issues in forecasting and economic policy. Indeed, with real failures of applied macroeconomic forecasting since 2010.

Fiscal Multipliers

What is the percent reduction in GDP growth that is likely to be associated with reductions in government spending? This type of question is handled in the macroeconomic forecasting workshops – at the International Monetary Fund (IMF), the ECB, German, French, Italian, and US government agencies, and so forth – through basically simple operations with fiscal multipliers.

The Greek government had been spending beyond its means for years, both before joining the EU in 2001 and after systematically masking these facts with misleading and, in some cases, patently false accounting.

Then, to quote the New York Times,

Greece became the epicenter of Europe’s debt crisis after Wall Street imploded in 2008. With global financial markets still reeling, Greece announced in October 2009 that it had been understating its deficit figures for years, raising alarms about the soundness of Greek finances. Suddenly, Greece was shut out from borrowing in the financial markets. By the spring of 2010, it was veering toward bankruptcy, which threatened to set off a new financial crisis. To avert calamity, the so-called troika — the International Monetary Fund, the European Central Bank and the European Commission — issued the first of two international bailouts for Greece, which would eventually total more than 240 billion euros, or about $264 billion at today’s exchange rates. The bailouts came with conditions. Lenders imposed harsh austerity terms, requiring deep budget cuts and steep tax increases. They also required Greece to overhaul its economy by streamlining the government, ending tax evasion and making Greece an easier place to do business.

The money was supposed to buy Greece time to stabilize its finances and quell market fears that the euro union itself could break up. While it has helped, Greece’s economic problems haven’t gone away. The economy has shrunk by a quarter in five years, and unemployment is above 25 percent.

In short, the austerity policies imposed by the “Troika” – the ECB, the European Commission, and the IMF – proved counter-productive. Designed to release funds to repay creditors by reducing government deficits, insistence on sharp reductions in Greek spending while the nation was still reeling from the global financial crisis led to even sharper reductions in Greek production and output – and thus tax revenues declined faster than spending.

Or, to put this in more technical language, policy analysts made assumptions about fiscal multipliers which simply were not borne out by actual developments. They assumed fiscal multipliers on the order of 0.5, when, in fact, recent meta-studies suggest they can be significantly greater than 1 in magnitude and that multipliers for direct transfer payments under strapped economic conditions grow by multiples of their value under normal circumstances.

Problems with fiscal multipliers used in estimating policy impacts were recognized some time ago – see for example Growth Forecast Errors and Fiscal Multipliers the IMF Working Paper authored by Oliver Blanchard in 2013.

Also, Simon Wren-Lewis, from Oxford University, highlights the IMF recognition that they “got the multipliers wrong” in his post How a Greek drama became a global tragedy from mid-2013.

However, at the negotiating table with the Greeks, and especially with their new, Left-wing government, the niceties of amending assumptions about fiscal multipliers were lost on the hard bargaining that has taken place.

Again, Wren-Lewis is interesting in his Greece and the political capture of the IMF. The creditors were allowed to demand more and sterner austerity measures, as well as fulfillment of past demands which now seem institutionally impossible – prior to any debt restructuring.

IMF Calls for 50 Billion in New Loans and Debt Restructuring for Greece

Just before to the Greek vote, on July 2, the IMF released a “Preliminary Draft Debt Sustainability Analysis.”

This clearly states Greek debt is not sustainable, given the institutional realities in Greece and deterioration of Greek economic and financial indicators, and calls for immediate debt restructuring, as well as additional funds ($50 billion) to shore up the Greek banks and economy.

There is a report that Europeans tried to block IMF debt report on Greece, viewing it as too supportive of the Greek government position and a “NO” vote on today’s referendum.

The IMF document considers that,

If grace periods and maturities on existing European loans are doubled and if new financing is provided for the next few years on similar concessional terms, debt can be deemed to be sustainable with high probability. Underpinning this assessment is the following: (i) more plausible assumptions—given persistent underperformance—than in the past reviews for the primary surplus targets, growth rates, privatization proceeds, and interest rates, all of which reduce the downside risk embedded in previous analyses. This still leads to gross financing needs under the baseline not only below 15 percent of GDP but at the same levels as at the last review; and (ii) delivery of debt relief that to date have been promises but are assumed to materialize in this analysis.

Some may view this analysis from a presumed moral high ground – fixating on the fact that Greeks proved tricky about garnering debt and profligate in spending in the previous decade.

But, unless decision-makers are intent upon simply punishing Greece, at risk of triggering financial crisis, it seems in the best interests of everyone to consider how best to proceed from this point forward.

And the idea of cutting spending and increasing taxes during an economic downturn and its continuing aftermath should be put to rest as another crackpot idea whose time has passed.

Out-Of-Sample R2 Values for PVAR Models

Out-of-sample (OOS) R2 is a good metric to apply to test whether your predictive relationship has out-of-sample predictability. Checking this for the version of the proximity variable model which is publically documented, I find OOS R2 of 0.63 for forecasts of daily high prices.

In other words, 63 percent of the variation of the daily growth in high prices for the S&P 500 is explained by four variables, documented in Predictability of the Daily High and Low of the S&P 500 Index.

This is a really high figure for any kind of predictive relationship involving security prices, so I thought I would put the data out there for anyone interested to check.

OOS R2

This metric is often found in connection with efforts to predict daily or other rates of return on securities, and is commonly defined as

OOSR2

See, for example, Campbell and Thompson.

The white paper linked above and downloadable from University of Munich archives shows –

Ratios involving the current period opening price and the high or low price of the previous period are significant predictors of the current period high or low price for many stocks and stock indexes. This is illustrated with daily trading data from the S&P 500 index. Regressions specifying these “proximity variables” have higher explanatory and predictive power than benchmark autoregressive and “no change” models. This is shown with out-of-sample comparisons of MAPE, MSE, and the proportion of time models predict the correct direction or sign of change of daily high and low stock prices. In addition, predictive models incorporating these proximity variables show time varying effects over the study period, 2000 to February 2015. This time variation looks to be more than random and probably relates to investor risk preferences and changes in the general climate of investment risk.

I wanted to provide interested readers with a spreadsheet containing the basic data and computations of this model, which I call the “proximity variable” model. The idea is that the key variables are ratios of nearby values.

And this is sort of an experiment, since I have not previously put up a spreadsheet for downloading on this blog. And please note the spreadsheet data linked below is somewhat different than the original data for the white paper, chiefly by having more recent observations. This does change the parameter estimates for the whole sample, since the paper shows we are in the realm of time-varying coefficients.

So here goes. Check out this link. PVARresponse

Of course, no spreadsheet is totally self-explanatory, so a few words.

First, the price data (open, high, low, etc) for the S&P 500 come from Yahoo Finance, although the original paper used other sources, too.

Secondly, the data matrix for the regressions is highlighted in light blue. The first few rows of this data matrix include the formulas with later rows being converted to numbers, to reduce the size of the file.

If you look in column K below about row 1720, you will find out-of-sample regression forecasts, created by using data from the immediately preceding trading day and before and current day opening price ratios.

There are 35 cases, I believe, in which the high of the day and the opening price are the same. These can easily be eliminated in calculating any metrics, and, doing so, in fact increases the OOS R2.

I’m sympathetic with readers who develop a passion to “show this guy to be all wrong.” I’ve been there, and it may help to focus on computational matters.

However, there is just no question but this approach is novel, and beats both No Change forecasts and a first order autoregressive forecasts (see the white paper) by a considerable amount.

I personally think these ratios are closely watched by some in the community of traders, and that other price signals motivating trades are variously linked with these variables.

My current research goes further than outlined in the white paper – a lot further. At this point, I am tempted to suggest we are looking at a new paradigm in predictability of stock prices. I project “waves of predictability” will be discovered in the movement of ensembles of security prices. These might be visualized like the wave at a football game, if you will. But the basic point is that I reckon we can show how early predictions of these prices changes are self-confirming to a degree, so emerging signs of the changes being forecast in fact intensify the phenomena being predicted.

Think big.

Keep the comments coming.

Stock Market Price Predictability, Random Walks, and Market Efficiency

Can stock market prices be predicted? Can they be predicted with enough strength to make profits?

The current wisdom may be that market predictability is like craps. That is, you might win (correctly predict) for a while, maybe walking away with nice winnings, if you are lucky. But over the long haul, the casino is the winner.

This seems close to the view in Andrew P. Lo and Craig MacKinlay’s A NonRandom Walk Down Wall Street (NRW), a foil to Burton Malkiel’s A Random Walk Down Wall Street, perhaps.

Lo and MacKinlay (L&M) collect articles from the 1980’s and 1990’s – originally published in the “very best journals” – in a 2014 compilation with interesting intoductions and discussions.

Their work more or less conclusively demonstrates that US stock market prices are not, for identified historic periods, random walks.

The opposite idea – that stock prices are basically random walks – has a long history, “recently” traceable to the likes of Paul Samuelson, as well as Burton Malkiel. Supposedly, any profit opportunity in a deeply traded market will be quickly exploited, leaving price movements largely random.

The ringer for me in this whole argument is the autocorrelation (AC) coefficient.

The first order autocorrelation coefficient of a random walk is 1, but metrics derived from stock price series have positive first order autocorrelations less than 1 over daily or weekly data. In fact, L&M were amazed to discover the first order autocorrelation coefficient of weekly stock returns, based on CRSP data, was 30 percent and statistically highly significant. In terms of technical approach, a key part of their analysis involves derivation of asymptotic limits for distributions and confidence intervals, based on assumptions which encompass nonconstant (heteroskedastic) error processes.

Finding this strong autocorrelation was somewhat incidental to their initial attack on the issue of the randomness, which is based on variance ratios.

L&M were really surprised to discover significant AC in stock market returns, and, indeed, several of their articles explore ways they could be wrong, or things could be different than what they appear to be.

All this is more than purely theoretical, as Morgan Stanley and D.P. Shaw’s development of “high frequency equity trading strategies” shows. These strategies exploit this autocorrelation or time dependency through “statistical arbitrage.” By now, though, according to the authors, this is a thin-margin business, because of the “proliferation of hedge funds engaged in these activities.”

Well, there are some great, geeky lines for cocktail party banter, such as “rational expectations equilibrium prices need not even form a martingale sequence, of which the random walk is special case.”

By itself, the “efficient market hypothesis” (EFM) is rather nebulous, and additional contextualization is necessary to “test” the concept. This means testing several joint hypotheses. Accordingly, negative results can simply be attributed to failure of one or more collateral assumptions. This builds a protective barrier around the EFM, allowing it to retain its character as an article of faith among many economists.

AWL

Andrew W. Lo is a Professor of Finance at MIT and Director of the Laboratory for Financial Engineering. His site through MIT lists other recent publications, and I would like to draw readers’ attention to two:

Can Financial Engineering Cure Cancer?

Reading About the Financial Crisis: A Twenty-One-Book Review

Thoughts on Stock Market Forecasting

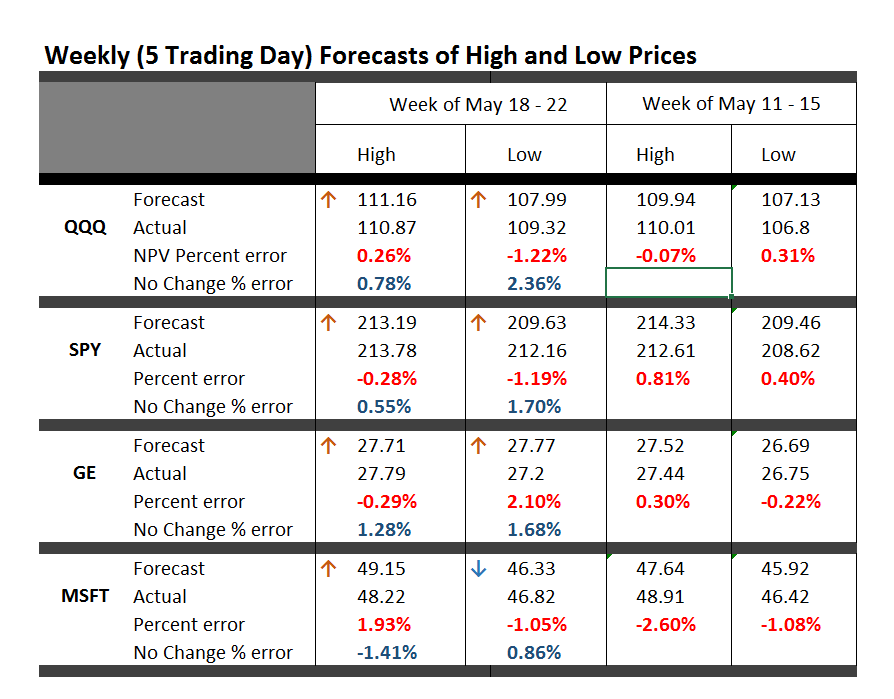
Here is an update on the forecasts from last Monday – forecasts of the high and low of SPY, QQQ, GE, and MSFT.

This table is easy to read, even though it is a little” busy”.

TableMay22

One key is to look at the numbers highlighted in red and blue (click to enlarge).

These are the errors from the week’s forecast based on the NPV algorithm (explained further below) and a No Change forecast.

So if you tried to forecast the high for the week to come, based on nothing more than the high achieved last week – you would be using a No Change model. This is a benchmark in many forecasting discussions, since it is optimal (subject to some qualifications) for a random walk. Of course, the idea stock prices are a random walk came into favor several decades ago, and now gradually is being rejected of modified, based on findings such as those above.

The NPV forecasts are more accurate for this last week than No Change projections 62.5 percent of the time, or in 5 out of the 8 forecasts in the table for the week of May 18-22. Furthermore, in all three cases in which the No Change forecasts were better, the NPV forecast error was roughly comparable in absolute size. On the other hand, there were big relative differences in the absolute size of errors in the situations in which the NPV forecasts proved more accurate, for what that is worth.

The NPV algorithm, by the way, deploys various price ratios (nearby prices) and their transformations as predictors. Originally, the approach focused on ratios of the opening price in a period and the high or low prices in the previous period. The word “new” indicates a generalization has been made from this original specification.

Ridge Regression

I have been struggling with Visual Basic and various matrix programming code for ridge regression with the NPV specifications.

Using cross validation of the λ parameter, ridge regression can improve forecast accuracy on the order of 5 to 10 percent. For forecasts of the low prices, this brings forecast errors closer to acceptable error ranges.

Having shown this, however, I am now obligated to deploy ridge regression in several of the forecasts I provide for a week or perhaps a month ahead.

This requires additional programming to be convenient and transparent to validation.

So, I plan to work on that this coming week, delaying other tables with weekly or maybe monthly forecasts for a week or so.

I will post further during the coming week, however, on the work of Andrew Lo (MIT Financial Engineering Center) and high frequency data sources in business forecasts.

Probable Basis of Success of NPV Forecasts

Suppose you are an observer of a market in which securities are traded. Initially, tests show strong evidence stock prices in this market follow random walk processes.

Then, someone comes along with a theory that certain price ratios provide a guide to when stock prices will move higher.

Furthermore, by accident, that configuration of price ratios occurs and is associated with higher prices at some date, or maybe a couple dates in succession.

Subsequently, whenever price ratios fall into this configuration, traders pile into a stock, anticipating its price will rise during the next trading day or trading period.

Question – isn’t this entirely plausible, and would it not be an example of a self-confirming prediction?

I have a draft paper pulling together evidence for this, and have shared some findings in previous posts. For example, take a look at the weird mirror symmetry of the forecast errors for the high and low.

And, I suspect, the absence or ambivalence of this underlying dynamic is why closing prices are harder to predict than period high or low prices of a stock. If I tell you the closing price will be higher, you do not necessarily buy the stock. Instead, you might sell it, since the next morning opening prices could jump down. Or there are other possibilities.

Of course, there are all kinds of systems traders employ to decide whether to buy or sell a stock, so you have to cast your net pretty widely to capture effects of the main methods.

Long Term Versus Short Term

I am getting mixed results about extending the NPV approach to longer forecast horizons – like a quarter or a year or more.

Essentially, it looks to me as if the No Change model becomes harder and harder to beat over longer forecast horizons – although there may be long run persistence in returns or other features that I see  other researchers (such as Andrew Lo) have noted.

Global Population in 2100

Probabilistic and Bayesian methods suggest global population will reach about 11 billion by 2100. Stabilization, zero population growth, or population declines are not likely to occur in this century.

These projections come from an article in Foresight, which styles itself the International Journal of Applied Forecasting.

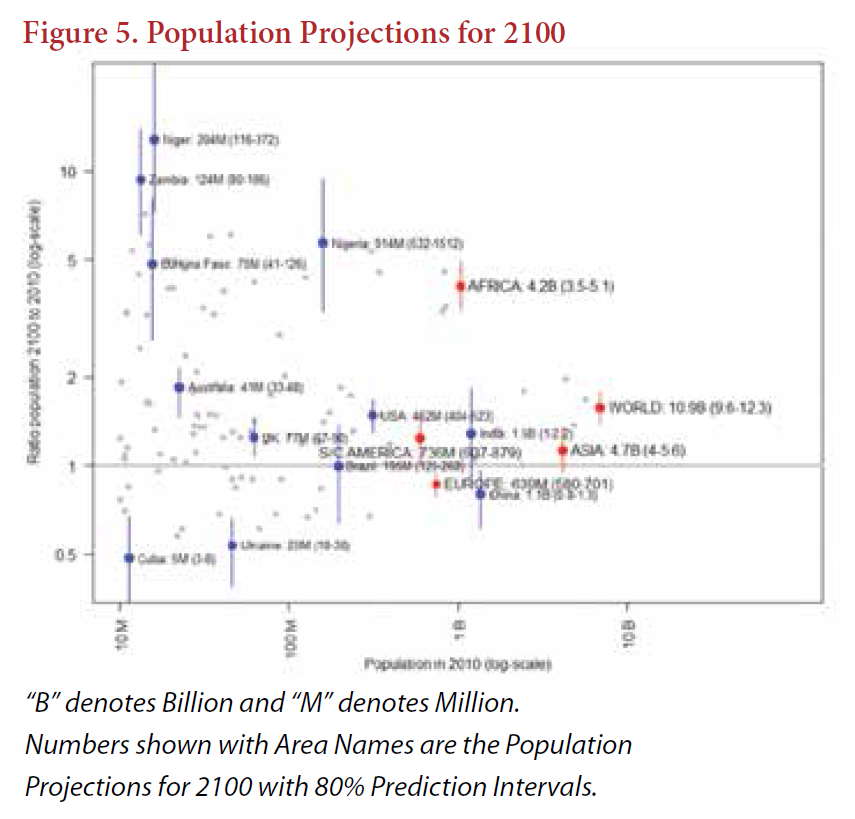
Here’s an exhibit from the article (“The United Nations Probabilistic Population Projections: An Introduction to Demographic Forecasting with Uncertainty”). If you can read through the haze in the reproduction, I found some interesting stuff (click to enlarge). Africa, for example, significantly approaches Asia in population – both with more than 4 billion persons. China is projected to still have more people than India, and the population of Nigeria will be just short of one billion.

PopulationProjections

The projections are constructed with a cohort component projection method, which projects populations by sex and and five-year age groups based on possible future trajectories of fertility, mortality, and migration.

Traditionally, the UN produced deterministic population projections and point forecasts, supplemented with ranges based on scenarios.

In 2014, however, the United Nations issued its first probabilistic population projections that attempt to quantify the uncertainty of the forecasts.

In the probabilistic method, uncertainty is captured by building a large sample of future trajectories for population size and other demographic metrics. Median outcomes then are used for point forecasts.

A key aspect the methodology is predicting fertility rates by county.

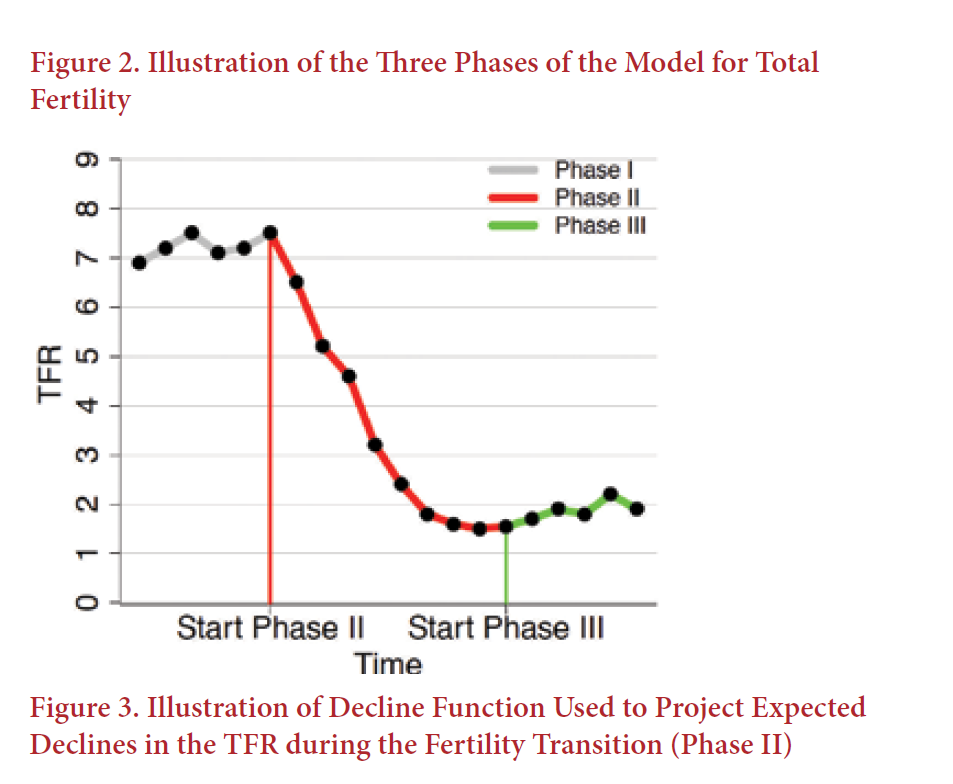
There are three phases to fertility, high fertility Phase I, a phrase involving a steep decline, down to the Phase III – the post-fertility transition.

FertilityPhases

Most developed countries are in phase III. All countries have completed Phase I.

The article explains, more clearly than I have found heretofore, how probabilistic projections and Bayesian methods can be combined in population forecasting. Really one of the best, short treatments of the topic I have found.

Monday Morning Stock Forecasts May 18 – Highs and Lows for SPY, QQQ, GE, and MSFT

Look at it this way. There are lots of business and finance blogs, but how many provide real-time forecasts, along with updates on how prior predictions performed?

Here on BusinessForecastBlog – we roll out forecasts of the highs and lows of a growing list of securities for the coming week on Monday morning, along with an update on past performance.

It’s a good discipline, if you think you have discovered a pattern which captures some part of the variation in future values of a variable. Do the backtesting, but also predict in real-time. It’s very unforgiving.

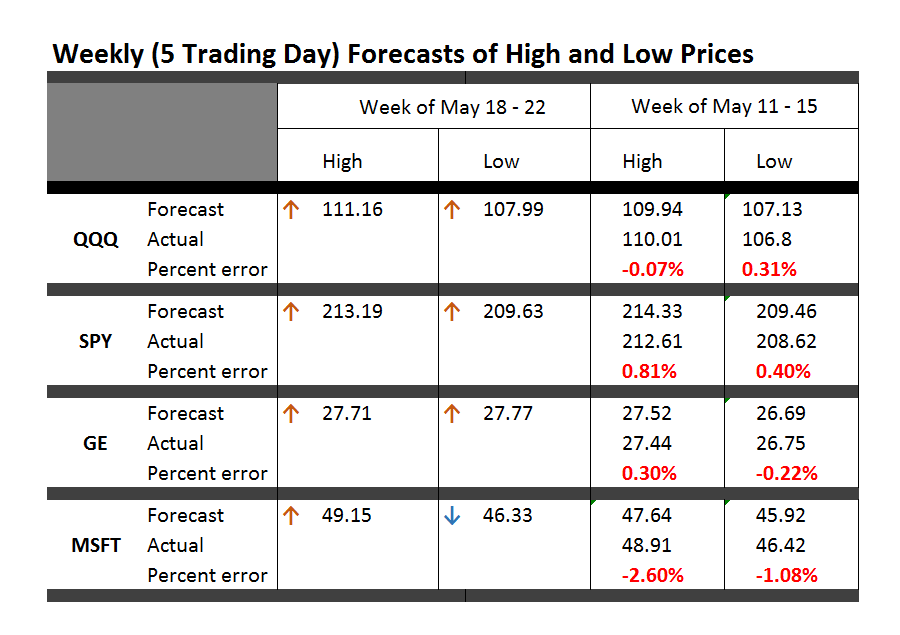
Here is today’s forecast, along with a recap for last week (click to enlarge).TableMay18

There is an inevitable tendency to narrate these in “Nightly Business Report” fashion.

So the highs are going higher this week, and so are the lows, except perhaps for a slight drop in Microsoft’s low – almost within the margin of statistical noise. Not only that, but predicted increases in the high for QQQ are fairly substantial.

Last week’s forecasts were solid, in terms of forecast error, except Microsoft’s high came in above what was forecast. Still, -2.6 percent error is within the range of variation in the backtests for this security. Recall, too, that in the previous week, the forecast error for the high of MSFT was only .04 percent, almost spot on.

Since the market moved sideways for many securities, No Change forecasts were a strong competitor to the NPV (new proximity variable) forecasts. In fact, there was an 50:50 split. In half the four cases, the NPV forecasts performed better; in the other half, No Change forecasts had lower errors.

Direction of change predictions also came in about 50:50. They were correct for QQQ and SPY, and wrong for the two stocks.

Where is the Market Going?

This tool – forecasts based on the NPV algorithms – provides longer terms looks into the future, probably effectively up to one month ahead.

So in two weeks, I’m going to add that forecast to the mix. I think it may be important, incidentally, to conform to the standard practice of taking stock at the beginning of the month, rather than, say, simply going out four weeks from today.

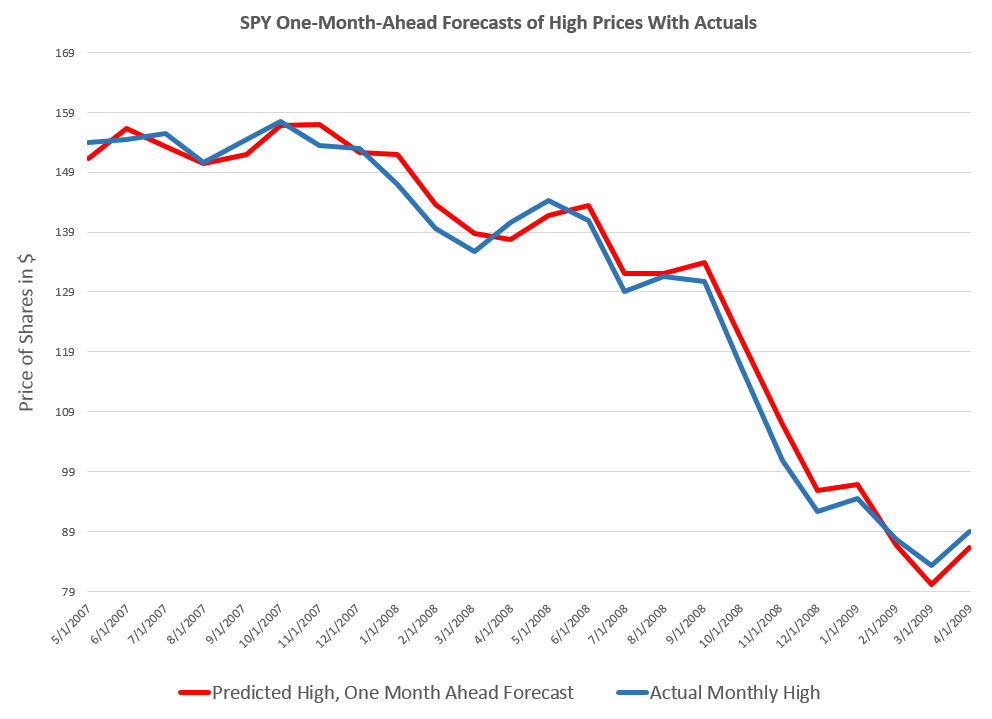
To preview the power of this monthly NPV model, here are the backtests for the crisis months before and during the 2008 financial crisis.

SPYM2008

This is a remarkable performance, really. Once the crash really gets underway in late Summer-Fall 2008, the NPV forecast drops in a straight-line descent, as do the actual monthly highs. There are some turning points in common, too, between the two series. And generally, even at the start of the process, the monthly NPV model provides good guidance as to the direction and magnitude of changes.

Over the next two weeks, I’m collecting high frequency data to see whether I can improve these forecasts with supplemental information – such as interest rates spreads and other variables available on a weekly or monthly basis.

In closing, let me plug Barry Eichengreen’s article in Syndicate An Economics to Fit the Facts.

Eichengreen writes,

While older members of the economics establishment continue to debate the merits of competing analytical frameworks, younger economists are bringing to bear important new evidence about how the economy operates.

It’s all about dealing with the wealth of data that is being collected everywhere now, and much less about theoretical disputes involving formal models.

Finally, it’s always necessary to insert a disclaimer, whenever one provides real-time, actionable forecasts. This stuff is for informational and scientific purposes only. It is not intended to provide recommendations for specific stock trading, and what you do on that score is strictly your own business and responsibility.

Mountain climbing pic from Blink.

Five Day Forecasts of High and Low for QQQ, SPY, GE, and MSFT – Week of May 11-15

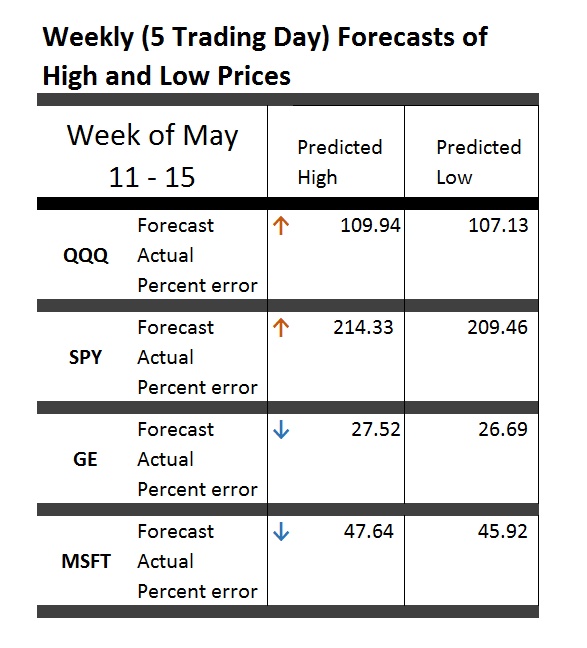
Here are high and low forecasts for two heavily traded exchange traded funds (ETF’s) and two popular stocks. Like the ones in preceding weeks, these are for the next five trading days, in this case Monday through Friday May 11-15.

HLWeekMay11to15

The up and down arrows indicate the direction of change from last week – for the high prices only, since the predictions of lows are a new feature this week.

Generally, these prices are essentially “moving sideways” or with relatively small changes, except in the case of SPY.

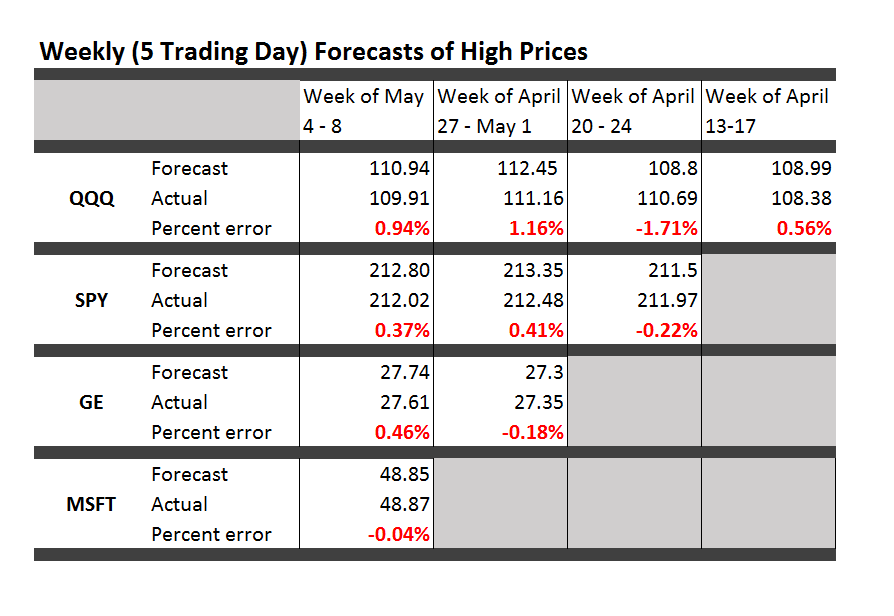
For the record, here is the performance of previous forecasts.

TableMay8

Strong disclaimer: These forecasts are provided for information and scientific purposes only. This blog accepts no responsibility for what might happen, if you base investment or trading decisions on these forecasts. What you do with these predictions is strictly your own business.

Incidentally, let me plug the recent book by Andrew W. Lo and A. Craig McKinlay – A Non-Random Walk Down Wall Street from Princeton University Press and available as a e-book.

I’ve been reading an earlier book which Andrew Lo co-authored The Econometrics of Financial Markets.

What I especially like in these works is the insistence that statistically significant autocorrelations exist in stock prices and stock returns. They also present multiple instances in which stock prices fail tests for being random walks, and establish a degree of predictability for these time series.

Again, almost all the focus of work in the econometrics of financial markets is on closing prices and stock returns, rather than predictions of the high and low prices for periods.