Tag Archives: forecasting research

Forecasts of High Prices for Week May 4-8 – QQQ, SPY, GE, and MSFT

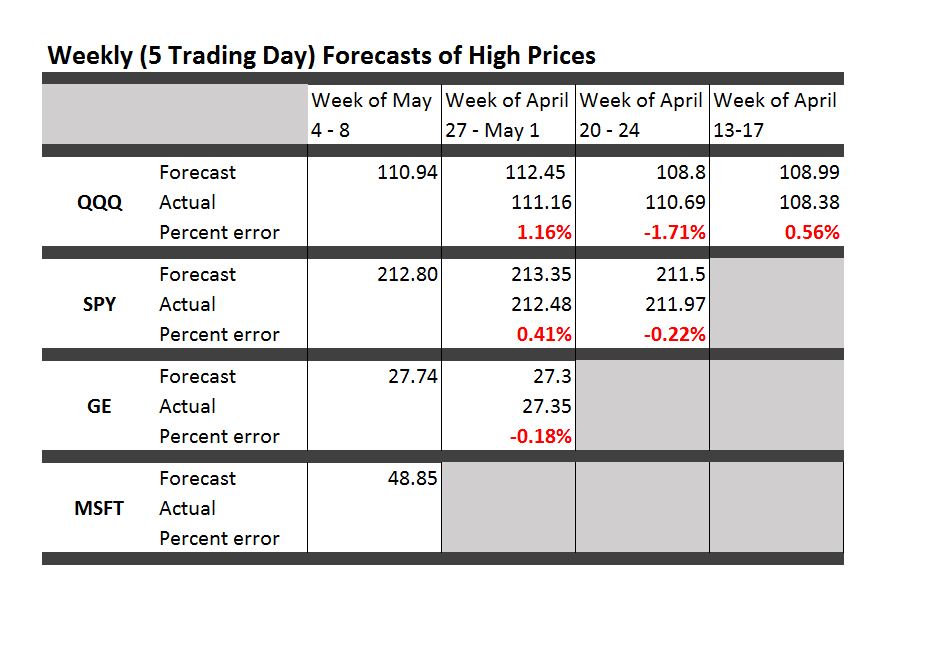
Here are forecasts of high prices for key securities for this week, May 4-8, along with updates to check the accuracy of previous forecasts. So far, there is a new security each week. This week it is Microsoft (MSFT). Click on the Table to enlarge.

TableMay4

These forecasts from the new proximity variable (NPV) algorithms compete with the “no change” forecast – supposedly the optimal predictions for a random walk.

The NPV forecasts in the Table are more accurate than no change forecasts at 3:2 odds. That is, if you take into account the highs of the previous weeks for each security – actual high numbers not shown in the Table – the NPV forecasts are more accurate 4 out of 6 times.

This performance corresponds roughly with the improvements of the NPV approach over the no change forecasts in backtests back to 2003.

The advantages of the NPV approach extend beyond raw accuracy, measured here in simple percent terms, since the “no change” forecast is uninformative about the direction of change. The NPV forecasts, on the other hand, generally get the direction of change right. In the Table above, again considering data from weeks preceding those shown, the direction of change of the high forecasts is spot on every time. Backtests suggest the NPV algorithm will correctly predict the direction of change of the high price about 75 percent of the time for this five day interval.

It will be interesting to watch QQQ in this batch of forecasts. This ETF is forecast to decline week-over-week in terms of the high price.

Next week I plan to expand the forecast table to include forecasts of the low prices.

There is a lot of information here. Much of the finance literature focuses on the rates of returns based on closing prices, or adjusted closing prices. Perhaps analysts figure that attempting to predict “extreme values” is not a promising idea. Nothing could be further from the truth.

This week I plan a post showing how to identify turning points in the movement of major indices with the NPV algorithms. The concept is simple. I forecast the high and low over coming periods, like a day, five days, ten trading days and so forth. For these “nested forecast periods” the high for the week ahead must be greater than or equal to the high for tomorrow or shorter periods. This means when the price of the SPY or QQQ heads south, the predictions of the high of these ETF’s sort of freeze at a constant value. The predictions for the low, however, plummet.

Really pretty straight-forward.

I’ve appreciated and benefitted from your questions, comments, and suggestions. Keep them coming.

Weekly BusinessForecastBlog Stock Price Forecasts – QQQ, SPY, GE

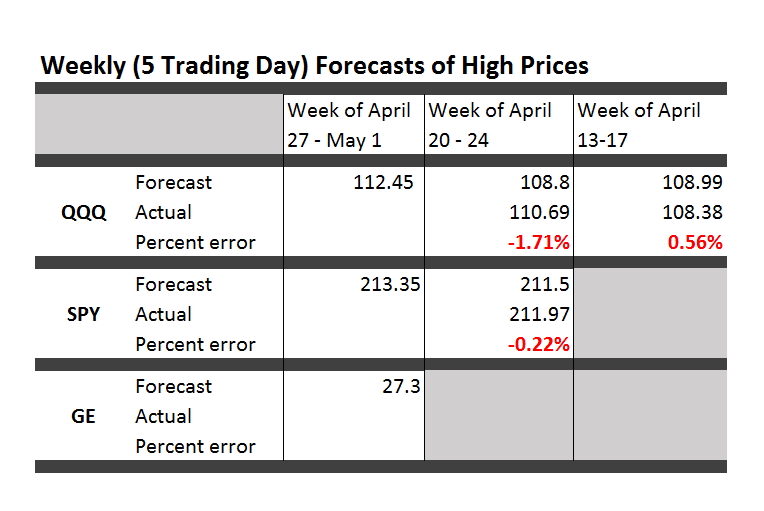
Here are forecasts of the weekly high price for three securities. These include intensely traded exchange traded funds (ETF’s) and a blue chip stock – QQQ, SPY, and GE.

TableA27

The table also shows the track record so far.

All the numbers not explicitly indicated as percents are in US dollars.

These forecasts come with disclaimers. They are presented purely for scientific and informational purposes. This blog takes no responsibility for any investment gains or losses that might be linked with these forecasts. Invest at your own risk.

So having said that, some implications and background information.

First of all, it looks like it’s off to the races for the market as a whole this week, although possibly not for GE. The highs for the ETF’s all show solid gains.

Note, too, that these are forecasts of the high price which will be reached over the next five trading days, Monday through Friday of this week.

Key features of the method are now available in a white paper published under the auspices of the University of Munich – Predictability of the daily high and low of the S&P 500 index. This research shows that the so-called proximity variables achieve higher accuracies in predicting the daily high and low prices for the S&P 500 than do benchmark approaches, such as the no-change forecast and forecasts from an autoregressive model.

Again, caution is advised in making direct application of the methods in the white paper to the current problem –forecasting the high for a five day trading period. There have been many modifications.

That’s, of course, one reason for the public announcements of forecasts from the NPV (new proximity variable) model.

Go real-time, I’ve been advised. It makes the best case, or at least exposes the results to the light of day.

Based on backtesting, I expect forecasts for GE to be less accurate than those for QQQ and SPY. In terms of mean absolute percent error (MAPE), we are talking around 1% for QQQ and SPY and, maybe, 1.7% for GE.

The most reliable element of these forecasts are the indicated directions of change from the previous period highs.

Features and Implications

There are other several other features which are reliably predicted by the NPV models. For example, forecasts for the low price or even closing prices on Friday can be added – although closing prices are less reliable. Obviously, too, volatility metrics are implied by predictions of the high and low prices.

These five-trading day forecasts parallel the results for daily periods documented in the above-cited white paper. That is, the NPV forecast accuracy for these securities in each case beats “no-change” and autoregressive model forecasts.

Focusing on stock market forecasts has “kept me out of trouble” recently. I’m focused on quantitative modeling, and am not paying a lot of attention to global developments – such as the ever- impending Greek default or, possibly, exit from the euro. Other juicy topics include signs of slowing in the global economy, and the impact of armed conflict on the Arabian Peninsula on the global price of oil. These are great topics, but beyond hearsay or personal critique, it is hard to pin things down just now.

So, indeed, I may miss some huge external event which tips this frothy stock market into reverse – but, at the same time, I assure you, once a turning point from some external disaster takes place, the NPV models should do a good job of predicting the extent and duration of such a decline.

On a more optimistic note, my research shows the horizons for which the NPV approach applies and does a better job than the benchmark models. I have, for example, produced backtests for quarterly SPY data, demonstrating continuing superiority of the NPV method.

My guess – and I would be interested in validating this – is that the NPV approach connects with dominant trader practice. Maybe stock market prices are, in some sense, a random walk. But the reactions of traders to daily price movements create short term order out of randomness. And this order can emerge and persist for relatively long periods. And, not only that, but the NPV approach is linked with self-reinforcing tendencies, so that awareness may just make predicted effects more pronounced. That is, if I tell you the high price of a security is going up over the coming period, your natural reaction is to buy in – thus reinforcing the prediction. And the prediction is not just public relations stunt or fluff. The first prediction is algorithmic, rather than wishful and manipulative. Thus, the direction of change is more predictable than the precise extent of price change.

In any case, we will see over coming weeks how well these models do.

Some Comments on Forecasting High and Low Stock Prices

I want to pay homage to Paul Erdős, the eccentric Hungarian-British-American-Israeli mathematician, whom I saw lecture a few years before his death. Erdős kept producing work in mathematics into his 70’s and 80’s – showing this is quite possible. Of course, he took amphetamines and slept on people’s couches while he was doing this work in combinatorics, number theory, and probability.

erdos

In any case, having invoked Erdős, let me offer comments on forecasting high and low stock prices – a topic which seems to be terra incognita, for the most part, to financial research.

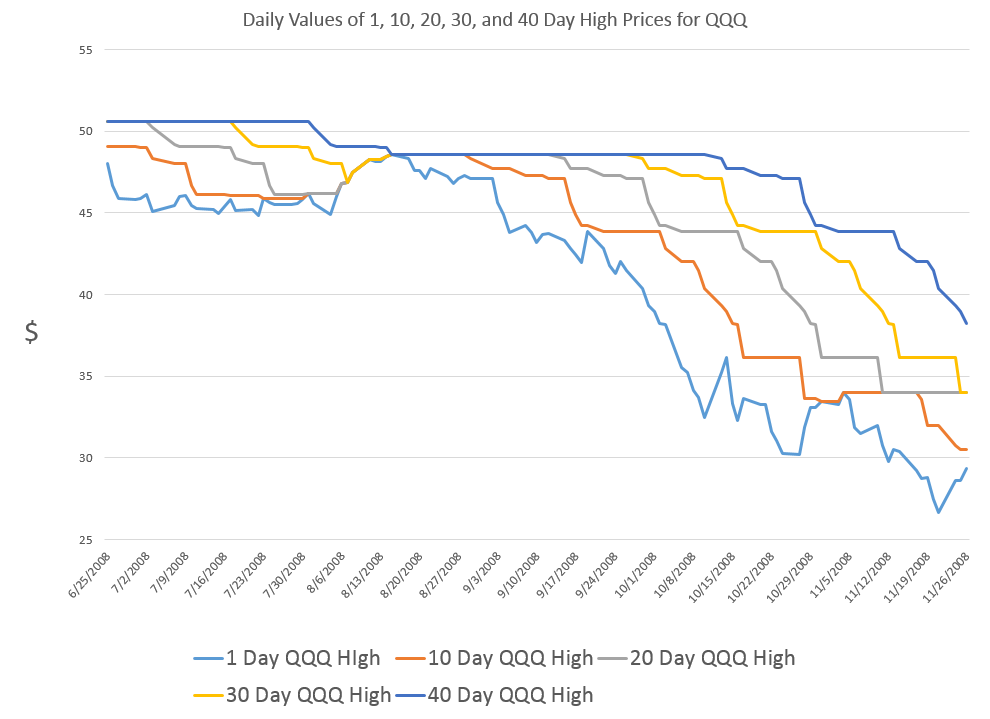
First, let’s take a quick look at a chart showing the maximum prices reached by the exchange traded fund QQQ over a critical period during the last major financial crisis in 2008-2009.

MaxHighChart

The graph charts five series representing QQQ high prices over periods extending from 1 day to 40 days.

The first thing to notice is that the variability of these time series decreases as the period for the high increases.

This suggests that forecasting the 40 day high could be easier than forecasting the high price for, say, tomorrow.

While this may be true in some sense, I want to point out that my research is really concerned with a slightly different problem.

This is forecasting ahead by the interval for the maximum prices. So, rather than a one-day-ahead forecast of the 40 day high price (which would include 39 known possible high prices), I forecast the high price which will be reached over the next 40 days.

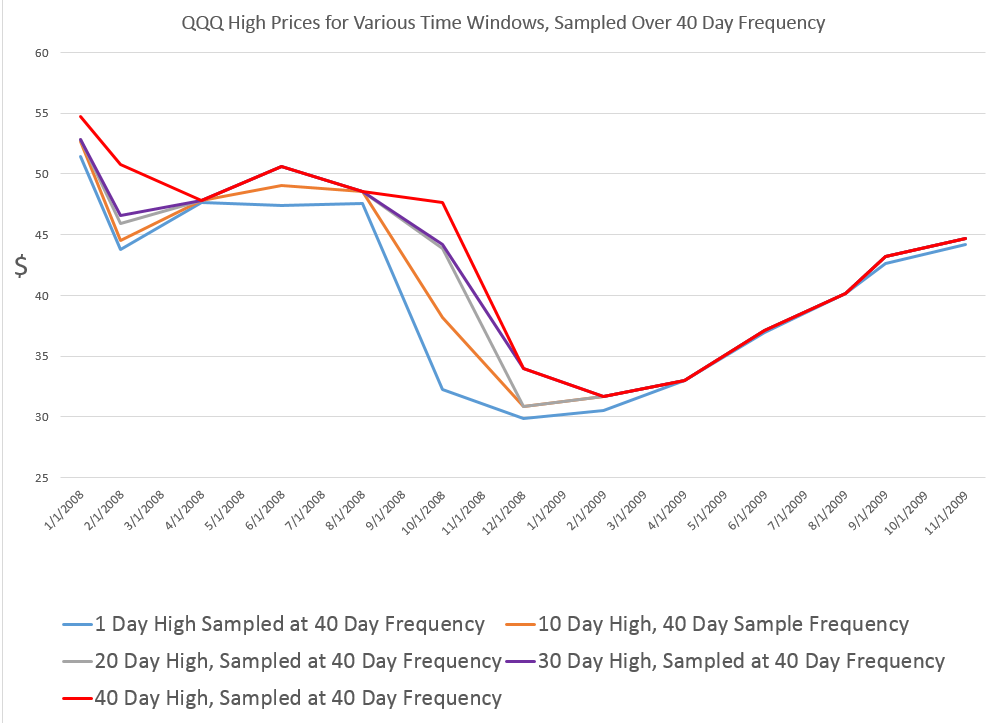
This problem is better represented by the following chart.

Sampled5Highs

This chart shows the high prices for QQQ over periods ranging from 1 to 40 days, sampled at what you might call “40 day frequencies.”

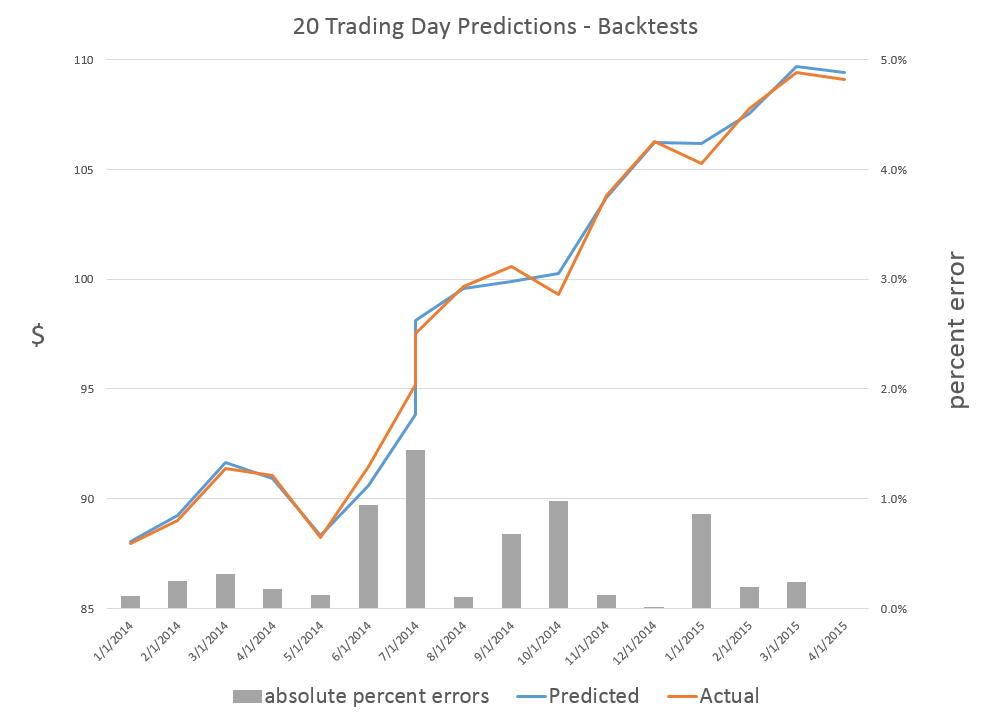
Now I am not quite going to 40 trading day ahead forecasts yet, but here are results for backtests of the algorithm which produces 20-trading-day-ahead predictions of the high for QQQ.

20Dayforecast

The blue lines shows the predictions for the QQQ high, and the orange line indicates the actual QQQ highs for these (non-overlapping) 20 trading day intervals. As you can see, the absolute percent errors – the grey bars – are almost all less than 1 percent error.

Random Walk

Now, these results are pretty good, and the question arises – what about the random walk hypothesis for stock prices?

Recall that a simple random walk can be expressed by the equation xt=xt-1 + εt where εt is conventionally assumed to be distributed according to N(0,σ) or, in other words, as a normal distribution with zero mean and constant variance σ.

An interesting question is whether the maximum prices for a stock whose prices follow a random walk also can be described, mathematically, as a random walk.

This is elementary, when we consider that any two observations in a time series of random walks can be connected together as xt+k = xt + ω where ω is distributed according to a Gaussian distribution but does not necessarily have a constant variance for different values of the spacing parameter k.

From this it follows that the methods producing these predictions or forecasts of the high of QQQ over periods of several trading days also are strong evidence against the underlying QQQ series being a random walk, even one with heteroskedastic errors.

That is, I believe the predictability demonstrated for these series are more than cointegration relationships.

Where This is Going

While demonstrating the above point could really rock the foundations of finance theory, I’m more interested, for the moment, in exploring the extent of what you can do with these methods.

Very soon I’m going to post on how these methods may provide signals as to turning points in stock market prices.

Stay tuned, and thanks for your comments and questions.

Erdős picture from Encyclopaedia Britannica

Predicting the High Reached by the SPY ETF 30 Days in Advance – Some Results

Here are some backtests of my new stock market forecasting procedures.

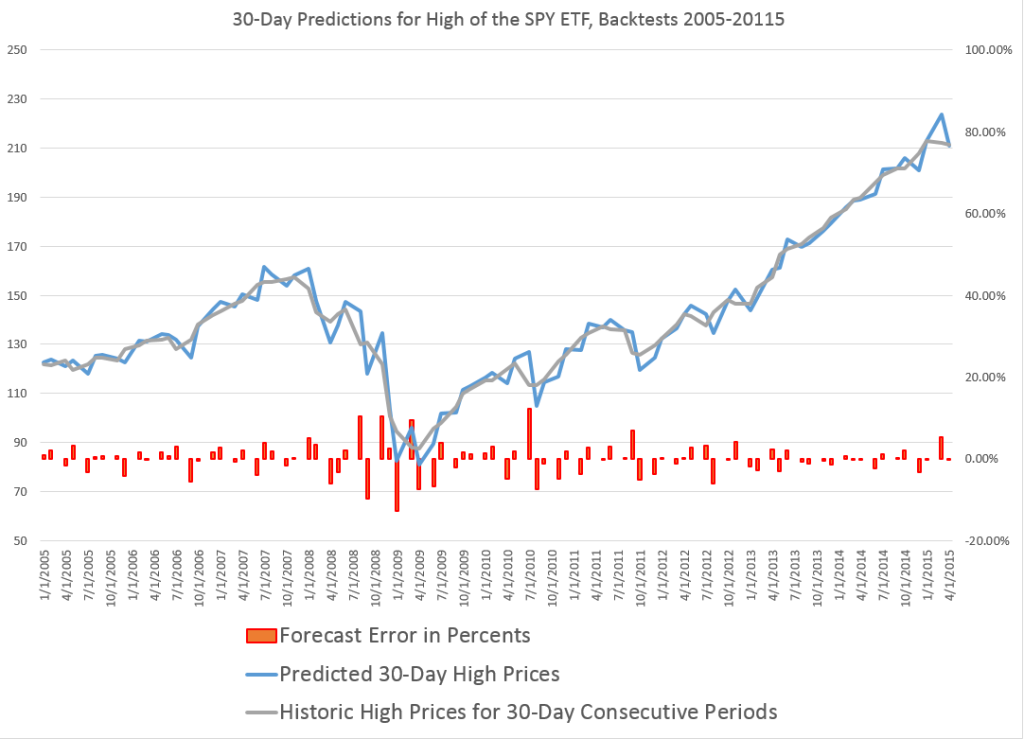
Here, for example, is a chart showing the performance of what I call the “proximity variable approach” in predicting the high price of the exchange traded fund SPY over 30 day forward periods (click to enlarge).

3oDaySPY

So let’s be clear what the chart shows.

The proximity variable approach- which so far I have been abbreviating as “PVar” – is able to identify the high prices reached by the SPY in the coming 30 trading days with forecast errors mostly under 5 percent. In fact, the MAPE for this approximately ten year period is 3 percent. The percent errors, of course, are charted in red with their metric on the axis to the right.

The blue line traces out the predictions, and the grey line shows the actual highs by 30 trading day period.

These results far surpass what can be produced by benchmark models, such as the workhorse No Change model, or autoregressive models.

Why not just do this month-by-month?

Well, months have varying numbers of trading days, and I have found I can boost accuracy by stabilizing the number of trading days considered in the algorithm.

Comments

Realize, of course, that a prediction of the high price that a stock or ETF will reach in a coming period does not tell you when the high will be reached – so it does not immediately translate to trading profits. The high in question could come with the opening price of the period, for example, leaving you out of the money, if you hear there is this big positive prediction of growth and then jump in the market.

However, I do think that market participants react to anticipated increases or decreases in the high or low of a security.

You might explain these results as follows. Traders react to fairly simple metrics predicting the high price which will be reached in the next period – and let this concept be extensible from a day to a month in this discussion. In so reacting, these traders tend to make such predictive models self-fulfilling.

Therefore, daily prices – the opening, the high, the low, and the closing prices – encode a lot more information about trader responses than is commonly given in the literature on stock market forecasting.

Of course, increasingly, scholars and experts are chipping away at the “efficient market hypothesis” and showing various ways in which stock market prices are predictable, or embody an element of predictability.

However, combing Google Scholar and other sources, it seems almost no one has taken the path to modeling stock market prices I am developing here. The focus in the literature is on closing prices and daily returns, for example, rather than high and low prices.

I can envision a whole research program organized around this proximity variable approach, and am drawn to taking this on, reporting various results on this blog.

If any readers would like to join with me in this endeavor, or if you know of resources which would be available to support such a project – feel free to contact me via the Comments and indicate, if you wish, whether you want your communication to be private.

Time-Varying Coefficients and the Risk Environment for Investing

My research provides strong support for variation of key forecasting parameters over time, probably reflecting the underlying risk environment facing investors. This type of variation is suggested by Lo ( 2005).

So I find evidence for time varying coefficients for “proximity variables” that predict the high or low of a stock in a period, based on the spread between the opening price and the high or low price of the previous period.

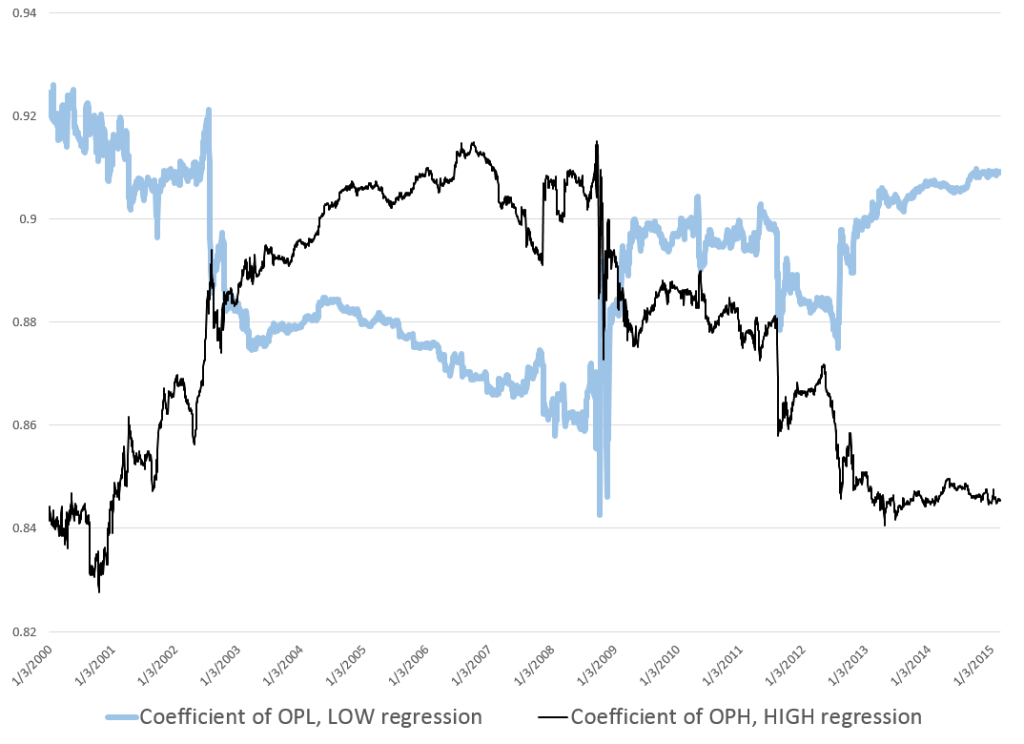
Figure 1 charts the coefficients associated with explanatory variables that I call OPHt and OPLt. These coefficients are estimated in rolling regressions estimated with five years of history on trading day data for the S&P 500 stock index. The chart is generated with more than 3000 separate regressions.

Here OPHt is the difference between the opening price and the high of the previous period, scaled by the high of the previous period. Similarly, OPLt is the difference between the opening price and the low of the previous period, scaled by the low of the previous period. Such rolling regressions sometimes are called “adaptive regressions.”

Figure 1 Evidence for Time Varying Coefficients – Estimated Coefficients of OPHt and OPLt Over Study Sample

TvaryCoeff

Note the abrupt changes in the values of the coefficients of OPHt and OPLt in 2008.

These plausibly reflect stock market volatility in the Great Recession. After 2010 the value of both coefficients tends to move back to levels seen at the beginning of the study period.

This suggests trajectories influenced by the general climate of risk for investors and their risk preferences.

I am increasingly convinced the influence of these so-called proximity variables is based on heuristics such as “buy when the opening price is greater than the previous period high” or “sell, if the opening price is lower than the previous period low.”

Recall, for example, that the coefficient of OPHt measures the influence of the spread between the opening price and the previous period high on the growth in the daily high price.

The trajectory, shown in the narrow, black line, trends up in the approach to 2007. This may reflect investors’ greater inclination to buy the underlying stocks, when the opening price is above the previous period high. But then the market experiences the crisis of 2008, and investors abruptly back off from their eagerness to respond to this “buy” signal. With onset of the Great Recession, investors become increasingly risk adverse to such “buy” signals, only starting to recover their nerve after 2013.

A parallel interpretation of the trajectory of the coefficient of OPLt can be developed based on developments 2008-2009.

Time variation of these coefficients also has implications for out-of-sample forecast errors.

Thus, late 2008, when values of the coefficients of both OPH and OPL make almost vertical movements in opposite directions, is the period of maximum out-of-sample forecast errors. Forecast errors for daily highs, for example, reach a maximum of 8 percent in October 2008. This can be compared with typical errors of less than 0.4 percent for out-of-sample forecasts of daily highs with the proximity variable regressions.

Heuristics

Finally, I recall a German forecasting expert discussing heuristics with an example from baseball. I will try to find his name and give him proper credit. By the idea is that an outfielder trying to catch a flyball does not run calculations involving mass, angle, velocity, acceleration, windspeed, and so forth. Instead, basically, an outfielder runs toward the flyball, keeping it at a constant angle in his vision, so that it falls then into his glove at the last second. If the ball starts descending in his vision, as he approaches it, it may fall on the ground before him. If it starts to float higher in his perspective as he runs to get under it, it may soar over him, landing further back int he field.

I wonder whether similar arguments can be advanced for the strategy of buying based or selling based on spreads between the opening price in a period and the high and low prices in a previous period.

How Did My Forecast of the SPY High and Low Issued January 22 Do?

A couple of months ago, I applied the stock market forecasting approach based on what I call “proximity variables” to forward-looking forecasts – as opposed to “backcasts” testing against history.

I’m surprised now that I look back at this, because I offered a forecast for 40 trading days (a little foolhardy?).

In any case, I offered forecasts for the high and low of the exchange traded fund SPY, as follows:

What about the coming period of 40 trading days, starting from this morning’s (January 22, 2015) opening price for the SPY – $203.99?

Well, subject to qualifications I will state further on here, my estimates suggest the high for the period will be in the range of $215 and the period low will be around $194. Cents attached to these forecasts would be, of course, largely spurious precision.

In my opinion, these predictions are solid enough to suggest that no stock market crash is in the cards over the next 40 trading days, nor will there be a huge correction. Things look to trade within a range not too distant from the current situation, with some likelihood of higher highs.

It sounds a little like weather forecasting.

Well, 27 trading days have transpired since January 22, 2015 – more than half the proposed 40 associated with the forecast.

How did I do?

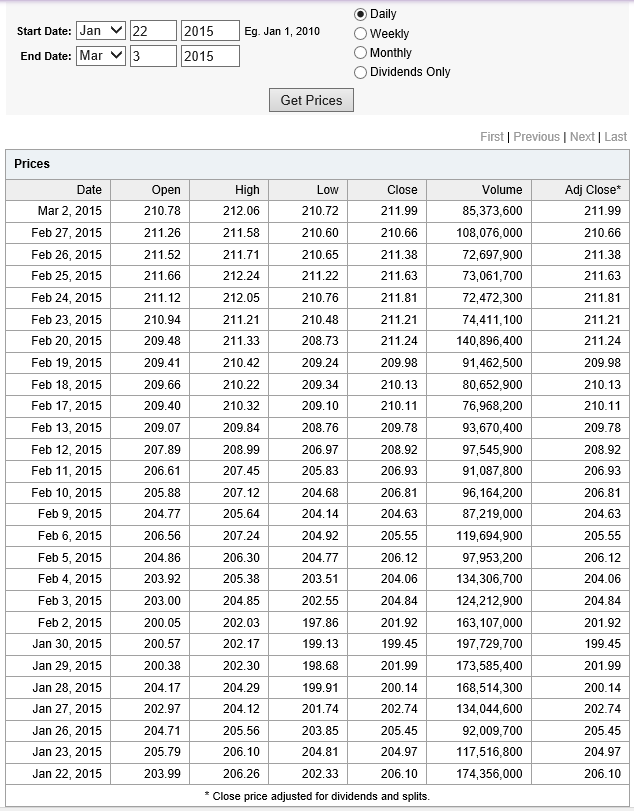
Here is a screenshot of the Yahoo Finance table showing opening, high, low, and closing prices since January 22, 2015.

SPYJan22etpassim

The bottom line – so far, so good. Neither the high nor low of any trading day has broached my proposed forecasts of $194 for the low and $215 for the high.

Now, I am pleased – a win just out of the gates with the new modeling approach.

However, I would caution readers seeking to use this for investment purposes. This approach recommends shorter term forecasts to focus in on the remaining days of the original forecast period. So, while I am encouraged the $215 high has not been broached, despite the hoopla about recent gains in the market, I don’t recommend taking $215 as an actual forecast at this point for the remaining 13 trading days – two or three weeks. Better forecasts are available from the model now.

“What are they?”

Well, there are a lot of moving parts in the computer programs to make these types of updates.

Still, it is interesting and relevant to forecasting practice – just how well do the models perform in real time?

So I am planning a new feature, a periodic update of stock market forecasts, with a look at how well these did. Give me a few days to get this up and running.

The King Has No Clothes or Why There Is High Frequency Trading (HFT)

I often present at confabs where there are engineers with management or executive portfolios. You start the slides, but, beforehand, prepare for the tough question. Make sure the numbers in the tables add up and that round-off errors or simple typos do not creep in to mess things up.

To carry this on a bit, I recall a Hewlett Packard VP whose preoccupation during meetings was to fiddle with their calculator – which dates the story a little. In any case, the only thing that really interested them was to point out mistakes in the arithmetic. The idea is apparently that if you cannot do addition, why should anyone believe your more complex claims?

I’m bending this around to the theory of efficient markets and rational expectations, by the way.

And I’m playing the role of the engineer.

Rational Expectations

The theory of rational expectations dates at least to the work of Muth in the 1960’s, and is coupled with “efficient markets.”

Lim and Brooks explain market efficiency in – The Evolution of Stock Market Efficiency Over Time: A Survey of the Empirical Literature

The term ‘market efficiency’, formalized in the seminal review of Fama (1970), is generally referred to as the informational efficiency of financial markets which emphasizes the role of information in setting prices.. More specifically, the efficient markets hypothesis (EMH) defines an efficient market as one in which new information is quickly and correctly reflected in its current security price… the weak-form version….asserts that security prices fully reflect all information contained in the past price history of the market.

Lim and Brooks focus, among other things, on statistical tests for random walks in financial time series, noting this type of research is giving way to approaches highlighting adaptive expectations.

Proof US Stock Markets Are Not Efficient (or Maybe That HFT Saves the Concept)

I like to read mathematically grounded research, so I have looked a lot of the papers purporting to show that the hypothesis that stock prices are random walks cannot be rejected statistically.

But really there is a simple constructive proof that this literature is almost certainly wrong.

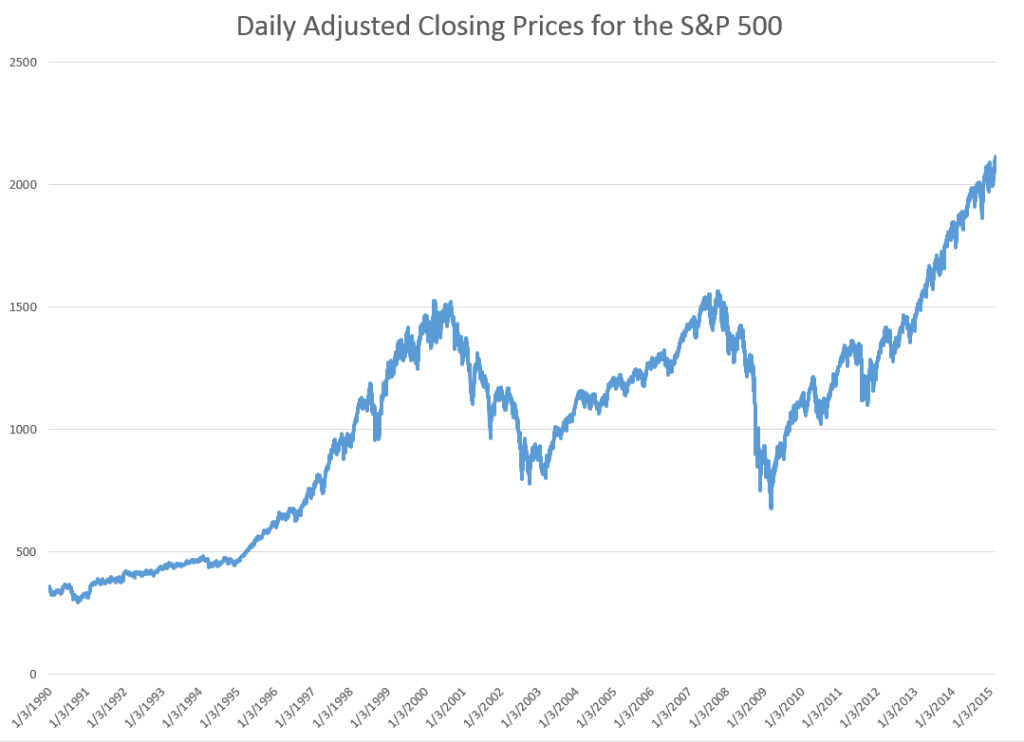
STEP 1: Grab the data. Download daily adjusted closing prices for the S&P 500 from some free site (e,g, Yahoo Finance). I did this again recently, collecting data back to 1990. Adjusted closing prices, of course, are based on closing prices for the trading day, adjusted for dividends and stock splits. Oh yeah, you may have to resort the data from oldest to newest, since a lot of sites present the newest data on top, originally.

Here’s a graph of the data, which should be very familiar by now.
adjCLPS&P

STEP 2: Create the relevant data structure. In the same spreadsheet, compute the trading-day-over-treading day growth in the adjusted closing price (ACP). Then, side-by-side with this growth rate of the ACP, create another series which, except for the first value, maps the growth in ACP for the previous trading day onto the growth of the ACP for any particular day. That gives you two columns of new data.

STEP 3: Run adaptive regressions. Most spreadsheet programs include an ordinary least squares (OLS) regression routine. Certainly, Excel does. In any case, you want to setup up a regression to predict the growth in the ACP, based on one trading lags in the growth of the ACP.

I did this, initially, to predict the growth in ACP for January 3, 2000, based on data extending back to January 3, 1990 – a total of 2528 trading days. Then, I estimated regressions going down for later dates with the same size time window of 2528 trading days.

The resulting “predictions” for the growth in ACP are out-of-sample, in the sense that each prediction stands outside the sample of historic data used to develop the regression parameters used to forecast it.

It needs to be said that these predictions for the growth of the adjusted closing price (ACP) are marginal, correctly predicting the sign of the ACP only about 53 percent of the time.

An interesting question, though, is whether these just barely predictive forecasts can be deployed in a successful trading model. Would a trading algorithm based on this autoregressive relationship beat the proverbial “buy-and-hold?”

So, for example, suppose we imagine that we can trade at closing each trading day, close enough to the actual closing prices.

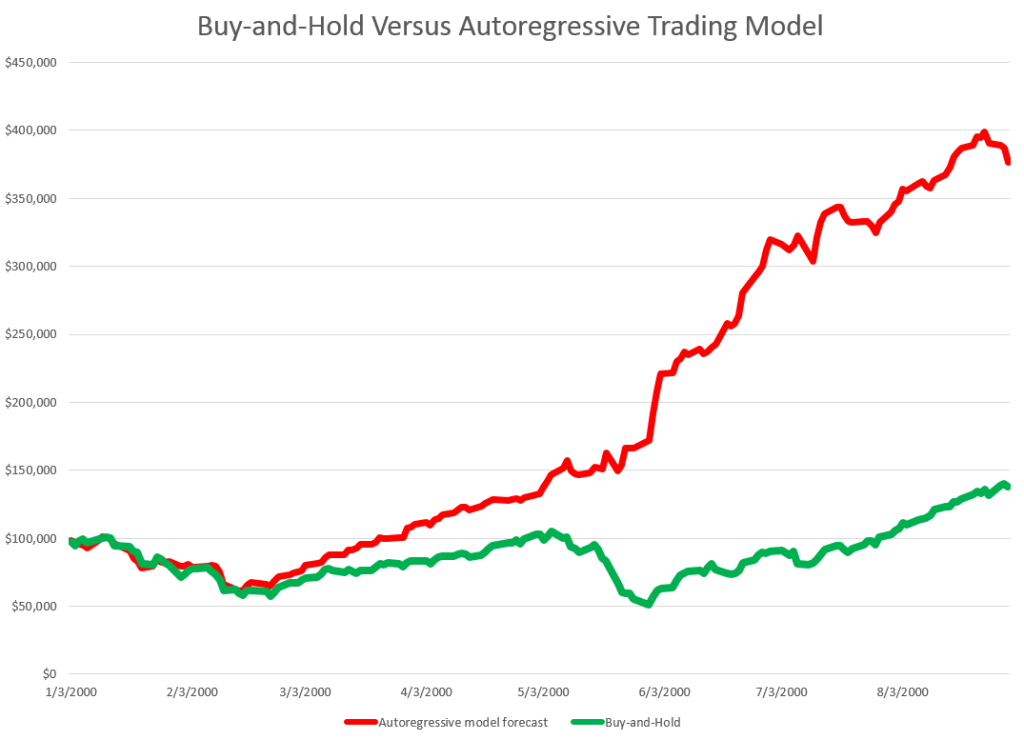
Then, you get something like this, if you invest $100,000 at the beginning of 2000, and trade through last week. If the predicted growth in the ACP is positive, you buy at the previous day’s close. If not, you sell at the previous day’s close. For the Buy-and-Hold portfolio, you just invest the $100,000 January 3, 2000, and travel to Tahiti for 15 years or so.
BandHversusAR

So, as should be no surprise, the Buy-and-Hold strategy results in replicating the S&P 500 Index on a $100,000 base.

The trading strategy based on the simple first order autoregressive model, on the other hand, achieves more than twice these cumulative earnings.

Now I suppose you could say that all this was an accident, or that it was purely a matter of chance, distributed over more than 3,810 trading days. But I doubt it. After all, this trading interval 2000-2015 includes the worst economic crisis since before World War II.

Or you might claim that the profits from the simple AR trading strategy would be eaten up by transactions fees and taxes. On this point, there were 1,774 trades, for an average of $163 per trade. So, worst case, if trading costs $10 a transaction, and there is a tax rate of 40 percent, that leaves $156K over these 14-15 years in terms of take-away profit, or about $10,000 a year.

Where This May Go Wrong

This does sound like a paen to stock market investing – even “day-trading.”

What could go wrong?

Well, I assume here, of course, that exchange traded funds (ETF’s) tracking the S&P 500 can be bought and sold with the same tactics, as outlined here.

Beyond that, I don’t have access to the data currently (although I will soon), but I suspect high frequency trading (HFT) may stand in the way of realizing this marvelous investing strategy.

So remember you have to trade some small instant before market closing to implement this trading strategy. But that means you get into the turf of the high frequency traders. And, as previous posts here observe, all kinds of unusual things can happen in a blink of an eye, faster than any human response time.

So – a conjecture. I think that the choicest situations from the standpoint of this more or less macro interday perspective, may be precisely the places where you see huge spikes in the volume of HFT. This is a proposition that can be tested.

I also think something like this has to be appealed to in order to save the efficient markets hypothesis, or rational expectations. But in this case, it is not the rational expectations of human subjects, but the presumed rationality of algorithms and robots, as it were, which may be driving the market, when push comes to shove.

Top picture from CommSmart Global.

Top Forecasters of the US Economy, 2013-2014

Once again, Christophe Barraud, a French economist based in Paris, is ranked as the “best forecaster of the US economy” by Bloomberg (see here).

This is quite an accomplishment, considering that it is based on forecasts for 14 key monthly indicators including CPI, Durable Goods Orders, Existing Home Sales, Housing Starts, IP, ISM Manufacturing, ISM Nonmanufacturing, New Home Sales, Nonfarm Payrolls, Personal Income, Personal Spending, Retail Sales, Unemployment and GDP.

For this round, Bloomberg considered two years of data ending ended November 2014.

Barraud was #1 in the rankings for 2011-2012 also.

In case you wanted to take the measure of such talent, here is a recent interview with Barraud conducted by Figaro (in French).

The #2 slot in the Bloomberg rankings of best forecasters of the US economy went to Jim O’Sullivan of High Frequency Economics.

Here just an excerpt from an interview by subscription with O’Sullivan – again to take the measure of the man.

While I have been absorbed in analyzing a statistical/econometric problem, a lot has transpired – in Switzerland, in Greece and the Ukraine, and in various global regions. While I am optimistic in outlook presently, I suspect 2015 may prove to be a year of surprises.

Stock Market Predictability

The research findings in recent posts here suggest that, in broad outline, the stock market is predictable.

This is one of the most intensively researched areas of financial econometrics.

There certainly is no shortage of studies claiming to forecast stock prices. See for example, Atsalakis, G., and K. Valavanis. “Surveying stock market forecasting techniques-part i: Conventional methods.” Journal of Computational Optimization in Economics and Finance 2.1 (2010): 45-92.

But the field is dominated by decades-long controversy over the efficient market hypothesis (EMH).

I’ve been reading Lim and Brooks outstanding survey article – The Evolution of Stock Market Efficiency Over Time: A Survey of the Empirical Literature.

They highlight two types of studies focusing on the validity of a weak form of the EMH which asserts that security prices fully reflect all information contained in the past price history of the market…

The first strand of studies, which is the focus of our survey, tests the predictability of security returns on the basis of past price changes. More specifically, previous studies in this sub-category employ a wide array of statistical tests to detect different types of deviations from a random walk in financial time series, such as linear serial correlations, unit root, low-dimensional chaos, nonlinear serial dependence and long memory. The second group of studies examines the profitability of trading strategies based on past returns, such as technical trading rules (see the survey paper by Park and Irwin, 2007), momentum and contrarian strategies (see references cited in Chou et al., 2007).

Another line, related to this second branch of research tests.. return predictability using other variables such as the dividend–price ratio, earnings–price ratio, book-to-market ratio and various measures of the interest rates.

Lim and Brooks note the tests for the semi-strong-form and strong-form EMH are renamed as event studies and tests for private information, respectively.

So bottom line – maybe your forecasting model predicts stock prices or rates of return over certain periods, but the real issue is whether it makes money. As Granger writes much earlier, mere forecastability is not enough.

I certainly respect this criterion, and recognize it is challenging. It may be possible to trade on the models of high and low stock prices over periods such I have been discussing, but I can also show you situations in which the irreducibly stochastic elements in the predictions can lead to losses. And avoiding these losses puts you into the field of higher frequency trading, where “all bets are off,” since there is so much that is not known about how that really works, particularly for individual investors.

My  primary purpose, however, in pursuing these types of models is originally not so much for trading (although that is seductive), but to explore new ways of forecasting turning points in economic time series. Confronted with the dismal record of macroeconomic forecasters, for example, one can see that predicting turning points is a truly fundamental problem. And this is true, I hardly need to add, for practical business forecasts. Your sales may do well – and exponential smoothing models may suffice – until the next phase of the business cycle, and so forth.

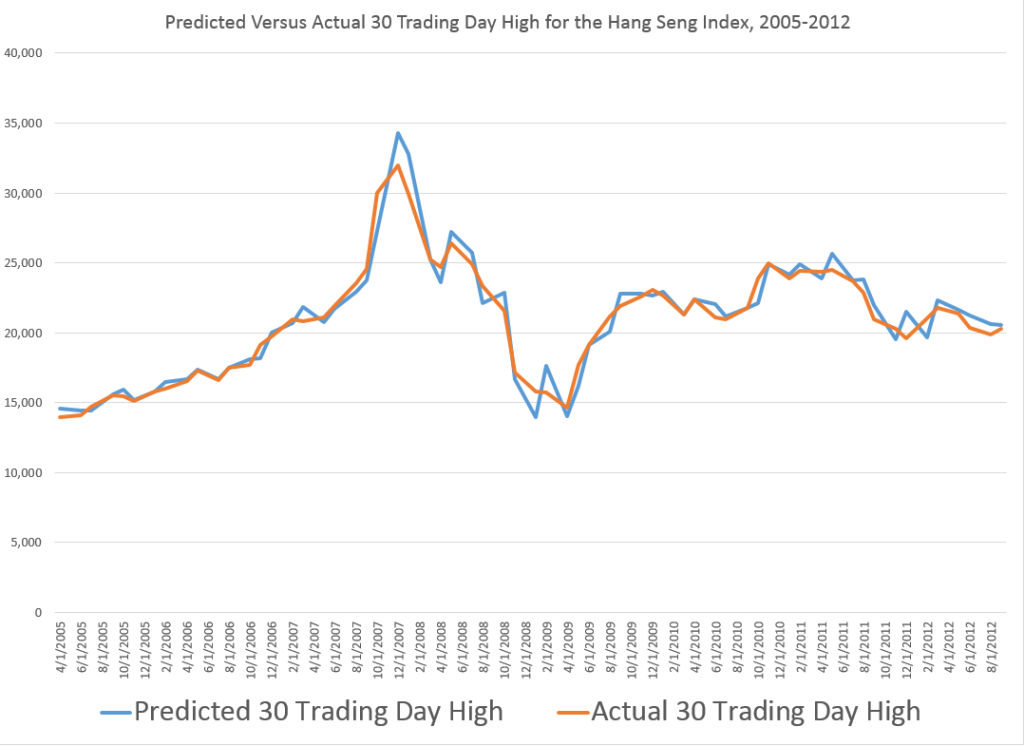
So I am amazed by the robustness of the turning point predictions from the longer (30 trading days, 40 days, etc.) groupings.

I just have never myself developed or probably even seen an example of predicting turning points as clearly as the one I presented in the previous post relating to the Hong Kong Hang Seng Index.

HSItp

A Simple Example of Stock Market Predictability

Again, without claims as to whether it will help you make money, I want to close this post today with comments about another area of stock price predictability – perhaps even simpler and more basic than relationships regarding the high and low stock price over various periods.

This is an exercise you can try for yourself in a few minutes, and which leads to remarkable predictive relationships which I do not find easy to identify or track in the existing literature regarding stock market predictability.

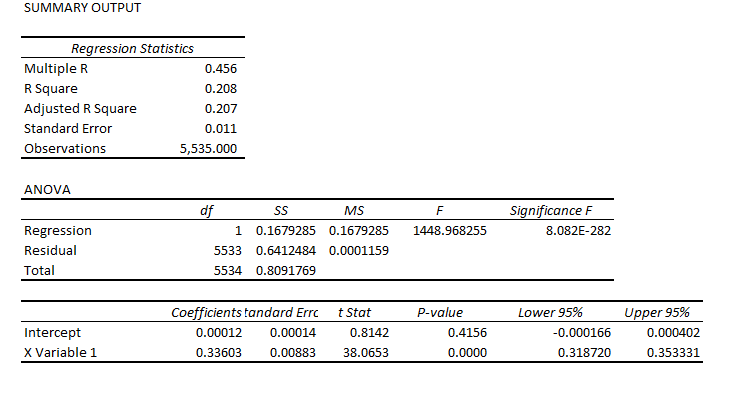
First, download the Yahoo Finance historical data for SPY, the ETF mirroring the S&P 500. This gives you a spreadsheet with approximately 5530 trading day values for the open, high, low, close, volume, and adjusted close. Sort from oldest to most recent. Then calculate trading-day over trading-day growth rates, for the opening prices and then the closing prices. Then, set up a data structure associating the opening price growth for day t with the closing price growth for day t-1. In other words, lag the growth in the closing prices.

Then, calculate the OLS regression of growth in lagged closing prices onto the growth in opening prices.

You should get something like,

openoverlcose

This is, of course, an Excel package regression output. It indicates that X Variable 1, which is the lagged growth in the closing prices, is highly significant as an explanatory variable, although the intercept or constant is not.

This equation explains about 21 percent of the variation in the growth data for the opening prices.

It also successfully predicts the direction of change of the opening price about 65 percent of the time, or considerably better than chance.

Not only that, but the two and three-period growth in the closing prices are successful predictors of the two and three-period growth in the opening prices.

And it probably is possible to improve the predictive performance of these equations by autocorrelation adjustments.

Comments

Why present the above example? Well, because I want to establish credibility on the point that there are clearly predictable aspects of stock prices, and ones you perhaps have not heard of heretofore.

The finance literature on stock market prediction and properties of stock market returns, not to mention volatility, is some of the most beautiful and complex technical literatures I know of.

But, still, I think new and important relationships can be discovered.

Whether this leads to profit-making is another question. And really, the standards have risen significantly in recent times, with program and high frequency trading possibly snatching profit opportunities from traders at the last microsecond.

So I think the more important point, from a policy standpoint if nothing else, may be whether it is possible to predict turning points – to predict broader movements of stock prices within which high frequency trading may be pushing the boundary.