Category Archives: predictive analytics

The NASDAQ 100 Daily Returns and Laplace Distributed Errors

I once ran into Norman Mailer at the Museum of Modern Art in Manhattan. We were both looking at Picasso’s “Blue Boy” and, recognizing him, I started up some kind of conversation, and Mailer was quite civil about the whole thing.

I mention this because I always associate Mailer with his collection Advertisements for Myself.

And that segues – loosely – into my wish to let you know that, in fact, I developed a generalization of the law of demand for the situation in which a commodity is sold at a schedule of rates and fees, instead of a uniform price. That was in 1987, when I was still a struggling academic and beginning a career in business consulting.

OK, and that relates to a point I want to suggest here. And that is that minor players can have big ideas.

So I recognize an element of “hubris” in suggesting that the error process of S&P 500 daily returns – up to certain transformations – is described by a Laplace distribution.

What about other stock market indexes, then? This morning, I woke up and wondered whether the same thing is true for, say, the NASDAQ 100.

NASDAQ100

So I downloaded daily closing prices for the NASDAQ 100 from Yahoo Finance dating back to October 1, 1985. Then, I took the natural log of each of these closing prices. After that, I took trading day by trading day differences. So the series I am analyzing comes from the first differences of the natural log of the NASDAQ 100 daily closing prices.

Note that this series of first differences is sometimes cast into a histogram by itself – and this also frequently is a “pointy peaked” relatively symmetric distribution. You could motivate this graph with the idea that stock prices are a random walk. So if you take first differences, you get the random component that generates the random walk.

I am troubled, however, by the fact that this component has considerable structure in and of itself. So I undertake further analysis.

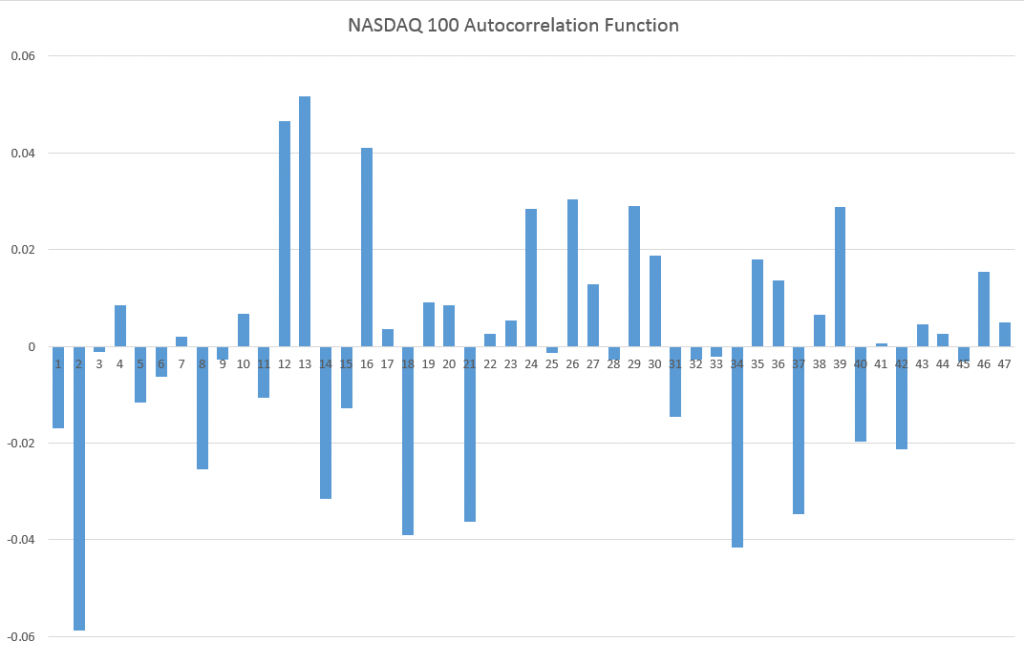
For example, the autocorrelation function of these first differences of the log of NASDAQ 100 daily closing prices looks like this.

NASDAQAC

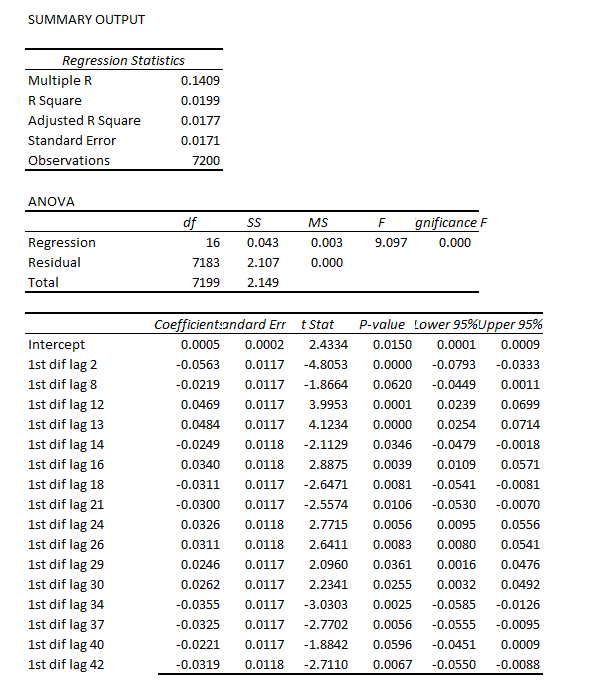
Now if you calculate bivariate regressions on these first differences and their lagged values, many of them produce coefficient estimates with t-statistics that exceed the magic value of 2.

Just selecting these significant regressors from the first 47 lags produces this regression equation, I get this equation.

Regression

Now this regression is estimated over all 7200 observations from October 1 1984 to almost right now.

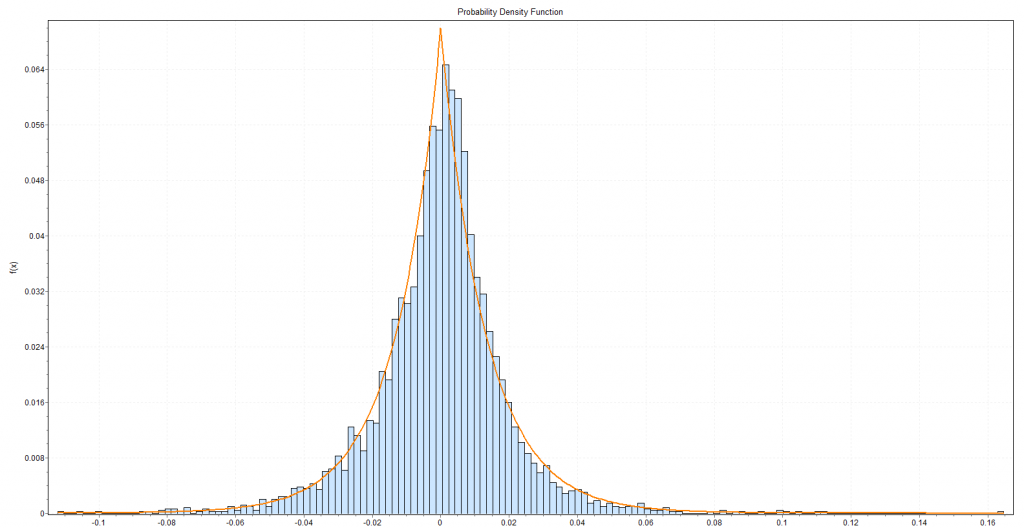
Graphing the residuals, I get the familiar pointy-peaked distribution that we saw with the S&P 500.

LaplaceNASDAQ100

Here is a fit of the Laplace distribution to this curve (Again using EasyFit).

EFLNQ

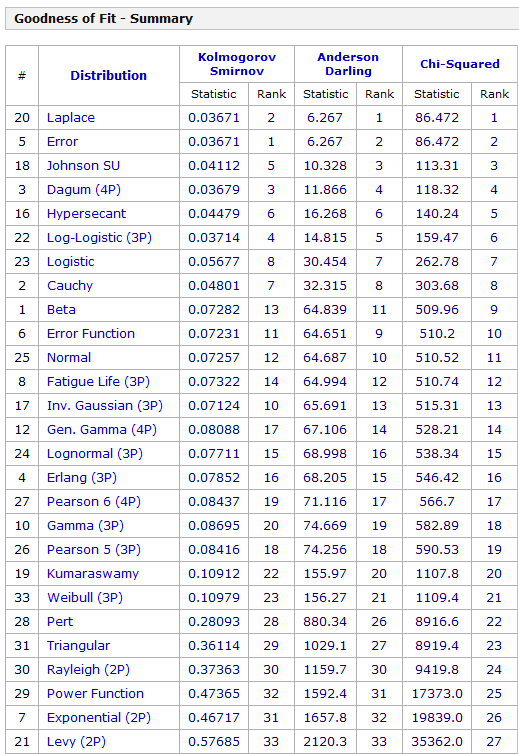
Here are the metrics for this fit and fits to a number of other probability distributions from this program.

EFtable

I have never seen as clear a linkage of returns from stock indexes and the Laplace distribution (maybe with a slight asymmetry – there are also asymmetric Laplace distributions).

One thing is for sure – the distribution above for the NASDAQ 100 data and the earlier distribution developed for the S&P 500 are not close to be normally distributed. Thus, in the table above that the normal distribution is number 12 on the list of possible candidates identified by EasyFit.

Note “Error” listed in the above table, is not the error function related to the normal distribution. Instead it is another exponential distribution with an absolute value in the exponent like the Laplace distribution. In fact, it looks like a transformation of the Laplace, but I need to do further investigation. In any case, it’s listed as number 2, even though the metrics show the same numbers.

The plot thickens.

Obviously, the next step is to investigate individual stocks with respect to Laplacian errors in this type of transformation.

Also, some people will be interested in whether the autoregressive relationship listed above makes money under the right trading rules. I will report further on that.

Anyway, thanks for your attention. If you have gotten this far – you believe numbers have power. Or you maybe are interested in finance and realize that indirect approaches may be the best shot at getting to something fundamental.

Global Energy Forecasting Competitions

The 2012 Global Energy Forecasting Competition was organized by an IEEE Working Group to connect academic research and industry practice, promote analytics in engineering education, and prepare for forecasting challenges in the smart grid world. Participation was enhanced by alliance with Kaggle for the load forecasting track. There also was a second track for wind power forecasting.

Hundreds of people and many teams participated.

This year’s April/June issue of the International Journal of Forecasting (IJF) features research from the winners.

Before discussing the 2012 results, note that there’s going to be another competition – the Global Energy Forecasting Competition 2014 – scheduled for launch August 15 of this year. Professor Tao Hong, a key organizer, describes the expansion of scope,

GEFCom2014 (www.gefcom.org) will feature three major upgrades: 1) probabilistic forecasts in the form of predicted quantiles; 2) four tracks on demand, price, wind and solar; 3) rolling forecasts with incremental data update on weekly basis.

Results of the 2012 Competition

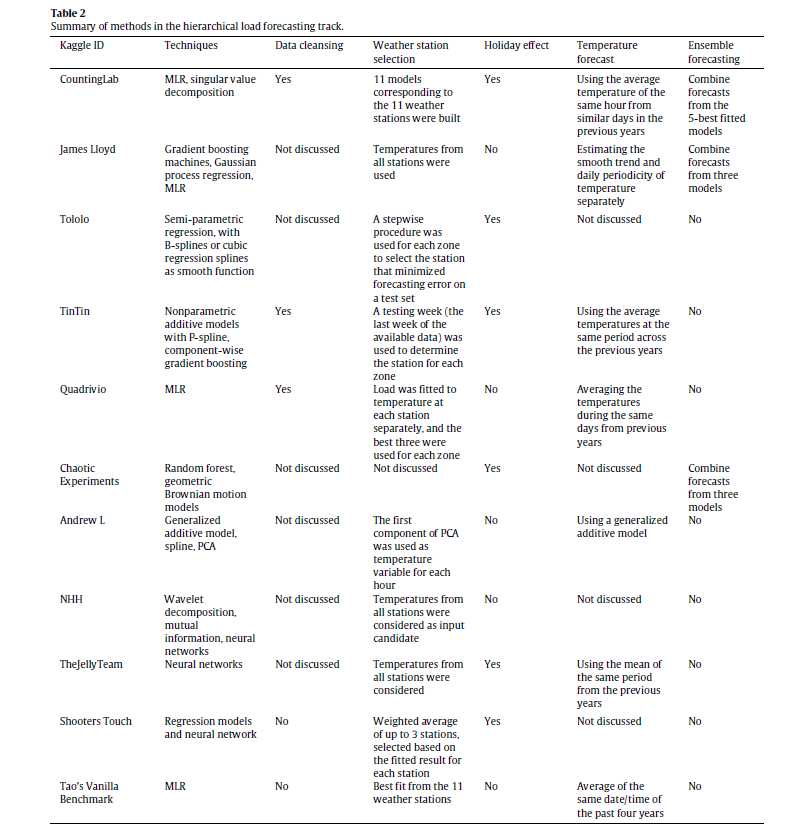
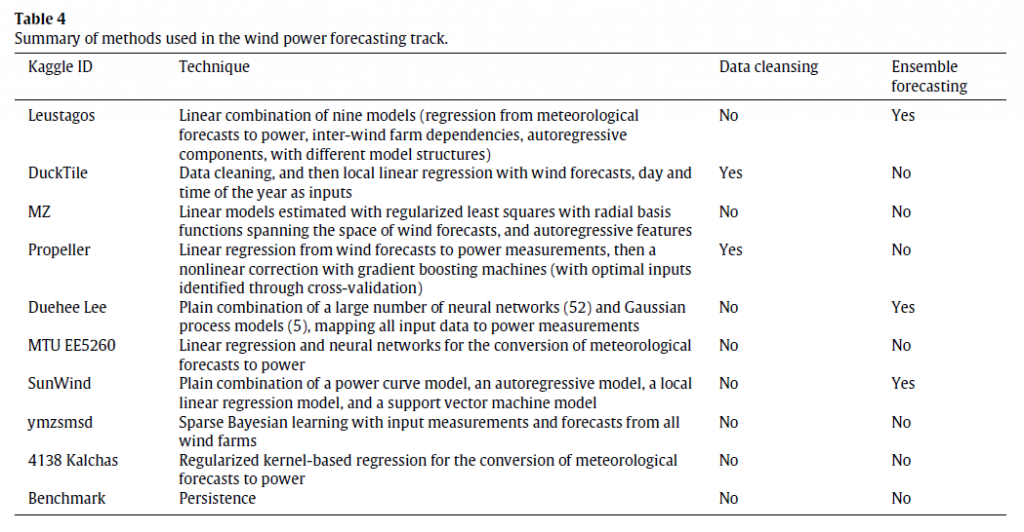
The IJF has an open source article on the competition. This features a couple of interesting tables about the methods in the load and wind power tracks (click to enlarge).

hload

The error metric is WRMSE, standing for weighted root mean square error. One week ahead system (as opposed to zone) forecasts received the greatest weight. The top teams with respect to WRMSE were Quadrivio, CountingLab, James Lloyd, and Tololo (Électricité de France).

wind

The top wind power forecasting teams were Leustagos, DuckTile, and MZ based on overall performance.

Innovations in Electric Power Load Forecasting

The IJF overview article pitches the hierarchical load forecasting problem as follows:

participants were required to backcast and forecast hourly loads (in kW) for a US utility with 20 zones at both the zonal (20 series) and system (sum of the 20 zonal level series) levels, with a total of 21 series. We provided the participants with 4.5 years of hourly load and temperature history data, with eight non-consecutive weeks of load data removed. The backcasting task is to predict the loads of these eight weeks in the history, given actual temperatures, where the participants are permitted to use the entire history to backcast the loads. The forecasting task is to predict the loads for the week immediately after the 4.5 years of history without the actual temperatures or temperature forecasts being given. This is designed to mimic a short term load forecasting job, where the forecaster first builds a model using historical data, then develops the forecasts for the next few days.

One of the top entries is by a team from Électricité de France (EDF) and is written up under the title GEFCom2012: Electric load forecasting and backcasting with semi-parametric models.

This is behind the International Journal of Forecasting paywall at present, but some of the primary techniques can be studied in a slide set by Yannig Goulde.

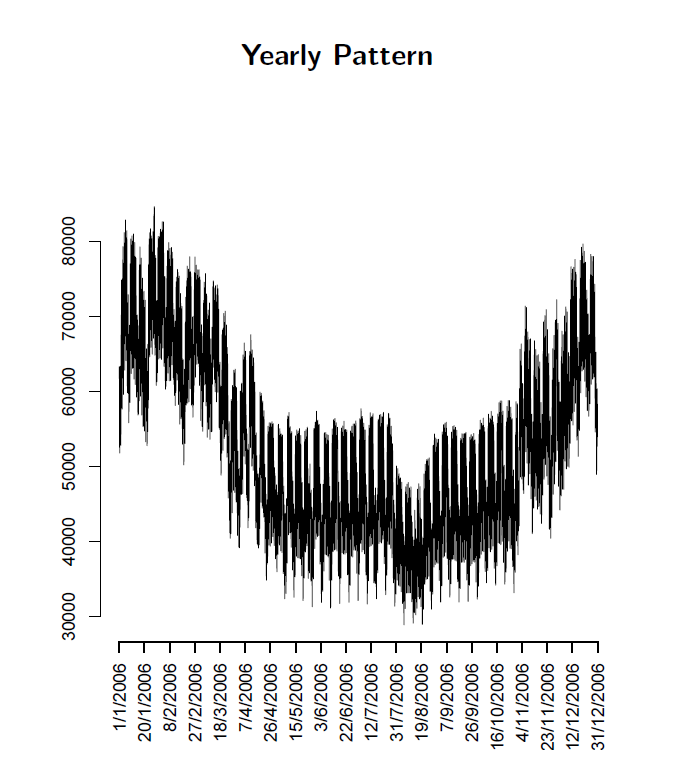
This is an interesting deck because it maps key steps in using semi-parametric models and illustrates real world system power load or demand data, as in this exhibit of annual variation showing the trend over several years.

trend

Or this exhibit showing annual variation.

annual

What intrigues me about the EDF approach in the competition and, apparently, more generally in their actual load forecasting, is the use of splines and knots. I’ve seen this basic approach applied in other time series contexts, for example, to facilitate bagging estimates.

So these competitions seem to provide solid results which can be applied in a real-world setting.

Top image from Triple-Curve

Highlights of National and Global Energy Projections

Christof Rühl – Group Chief Economist at British Petroleum (BP) just released an excellent, short summary of the global energy situation, focused on 2013.

Ruhl

Rühl’s video is currently only available on the BP site at –

http://www.bp.com/en/global/corporate/about-bp/energy-economics/statistical-review-of-world-energy.html

Note the BP Statistical Review of World Energy June 2014 was just released (June 16).

Highlights include –

  • Economic growth is one of the biggest determinants of energy growth. This means that energy growth prospects in Asia and other emerging markets are likely to dominate slower growth in Europe – where demand is actually less now than in 2005 – and the US.
  • Tradeoffs and balancing are a theme of 2013. While oil prices remained above $100/barrel for the third year in a row, seemingly stable, underneath two forces counterbalanced one another – expanding production from shale deposits in the US and an increasing number of supply disruptions in the Middle East and elsewhere.
  • 2013 saw a slowdown in natural gas demand growth with coal the fastest growing fuel. Growth in shale gas is slowing down, partly because of a big price differential between gas and oil.
  • While CO2 emissions continue to increase, the increased role of renewables or non-fossil fuels (including nuclear) have helped hold the line.
  • The success story of the year is that the US is generating new fuels, improving its trade position and trade balance with what Rühl calls the “shale revolution.”

The BP Statistical Reviews of World Energy are widely-cited, and, in my mind, rank alongside the Energy Information Agency (EIA) Annual Energy Outlook and the International Energy Agency’s World Energy Outlook. The EIA’s International Energy Outlook is another frequently-cited document, scheduled for update in July.

Price is the key, but is difficult to predict

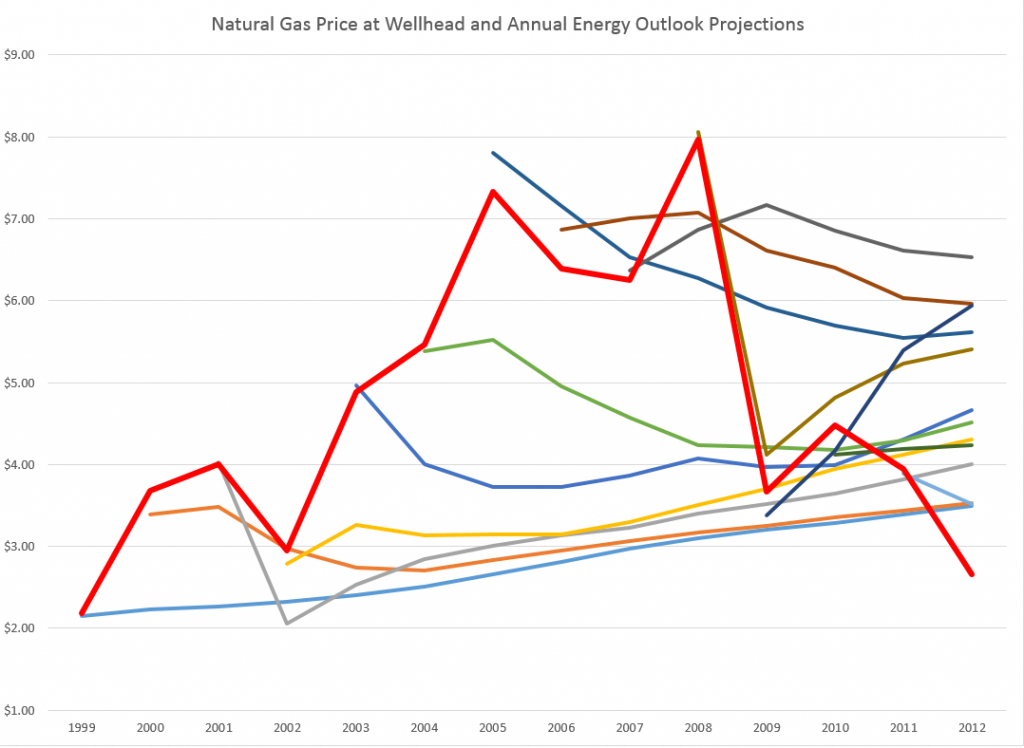
The EIA, to its credit, publishes a retrospective on the accuracy of its forecasts of prices, demand and production volumes. The latest is on a page called Annual Energy Outlook Retrospective Review which has a revealing table showing the EIA projections of the price of natural gas at wellhead and actual figures (as developed from the Monthly Energy Review).

I pulled together a graph showing the actual nominal price at the wellhead and the EIA forecasts.

natgasforecasterrorgraph

The solid red line indicates actual prices. The horizontal axis shows the year for which forecasts are made. The initial value in any forecast series is nowcast, since wellhead prices are available at only a year lag. The most accurate forecasts were for 2008-2009 in the 2009 and 2010 AEO documents, when the impact of the severe recession was already apparent.

Otherwise, the accuracy of the forecasts is completely underwhelming.

Indeed, the EIA presents another revealing chart showing the absolute percentage errors for the past two decades of forecasts. Natural gas prices show up with more than 30 percent errors, as do imported oil prices to US refineries.

Predicting Reserves Without Reference to Prices

Possibly as a result of the difficulty of price projections, the EIA apparently has decoupled the concept of Technically Recoverable Resources (TRR) from price projections.

This helps explain how you can make huge writedowns of TRR in the Monterey Shale without affecting forecasts of future shale oil and gas production.

Thus in Assumptions to AEO2014 and the section called the Oil and Gas Supply Module, we read –

While technically recoverable resources (TRR) is a useful concept, changes in play-level TRR estimates do not necessarily have significant implications for projected oil and natural gas production, which are heavily influenced by economic considerations that do not enter into the estimation of TRR. Importantly, projected oil production from the Monterey play is not a material part of the U.S. oil production outlook in either AEO2013 or AEO2014, and was largely unaffected by the change in TRR estimates between the 2013 and 2014 editions of the AEO. EIA estimates U.S. total crude oil production averaged 8.3 million barrels/day in April 2014. In the AEO2014 Reference case, economically recoverable oil from the Monterey averaged 57,000 barrels/day between 2010 and 2040, and in the AEO2013 the same play’s estimated production averaged 14,000 barrels/day. The difference in production between the AEO2013 and AEO2014 is a result of data updates for currently producing wells which were not previously linked to the Monterey play and include both conventionally-reservoired and continuous-type shale areas of the play. Clearly, there is not a proportional relationship between TRR and production estimates – economics matters, and the Monterey play faces significant economic challenges regardless of the TRR estimate.

This year EIA’s estimate for total proved and unproved U.S. technically recoverable oil resources increased 5.4 billion barrels to 238 billion barrels, even with a reduction of the Monterey/Santos shale play estimate of unproved technically recoverable tight oil resources from 13.7 billion barrels to 0.6 billion barrels. Proved reserves in EIA’s U.S. Crude Oil and Natural Gas Proved Reserves report for the Monterey/Santos shale play are withheld to avoid disclosure of individual company data. However, estimates of proved reserves in NEMS are 0.4 billion barrels, which result in 1 billion barrels of total TRR.

Key factors driving the adjustment included new geology information from a U. S. Geological Survey review of the Monterey shale and a lack of production growth relative to other shale plays like the Bakken and Eagle Ford. Geologically, the thermally mature area is 90% smaller than previously thought and is in a tectonically active area which has created significant natural fractures that have allowed oil to leave the source rock and accumulate in the overlying conventional oil fields, such as Elk Hills, Cat Canyon and Elwood South (offshore). Data also indicate the Monterey play is not over pressured and thus lacks the gas drive found in highly productive tight oil plays like the Bakken and Eagle Ford. The number of wells per square mile was revised down from 16 to 6 to represent horizontal wells instead of vertical wells. TRR estimates will likely continue to evolve over time as technology advances, and as additional geologic information and results from drilling activity provide a basis for further updates.

So the shale oil in the Monterey formation may have “migrated” from that convoluted geologic structure to sand deposits or elsewhere, leaving the productive potential much less.

I still don’t understand how it is possible to estimate any geologic reserve without reference to price, but there you have it.

I plan to move on to more manageable energy aggregates, like utility power loads and time series forecasts of consumption in coming posts.

But the shale oil and gas scene in the US is fascinating and a little scary. Part of the gestalt is the involvement of smaller players – not just BP and Exxon, for example. According to Chad Moutray, Economist for the National Association of Manufacturers, the fracking boom is a major stimulus to manufacturing jobs up and down the supply chain. But the productive life of a fracked oil or gas well is typically shorter than a conventional oil or gas well. So some claim that the increases in US production cannot be sustained or will not lead to any real period of “energy independence.” For my money, I need to watch this more before making that kind of evaluation, but the issue is definitely there.

Bayesian Reasoning and Intuition

In thinking about Bayesian methods, I wanted to focus on whether and how Bayesian probabilities are or can be made “intuitive.”

Or are they just numbers plugged into a formula which sometimes is hard to remember?

A classic example of Bayesian reasoning concerns breast cancer and mammograms.

 1%   of the women at age forty who participate in routine screening have breast    cancer
 80%   of women with breast cancer will get positive mammograms.
 9.6%   of women with no breast cancer will also get positive mammograms

Question – A women in this age group has a positive mammogram in a routine screening. What is the probability she has cancer?

There is a tendency for intuition to anchor on the high percentage of women with breast cancer with positive mammograms – 80 percent. In fact, this type of scenario elicits significant over-estimates of cancer probabilities among mammographers!

Bayes Theorem, however, shows that the probability of women with a positive mammogram having cancer is an order of magnitude less than the percent of women with breast cancer and positive mammograms.

By the Formula

Recall Bayes Theorem –

BayesThm

Let A stand for the event a women has breast cancer, and B denote the event that a women tests positive on the mammogram.

We need the conditional probability of a positive mammogram, given that a woman has breast cancer, or P(B|A). In addition, we need the prior probability that a woman has breast cancer P(A), as well as the probability of a positive mammogram P(B).

So we know P(B|A)=0.8, and P(B|~A)=0.096, where the tilde ~ indicates “not”.

For P(B) we can make the following expansion, based on first principles –

P(B)=P(B|A)P(A)+P(B|~A)P(B)= P(B|A)P(A)+P(B|~A)(1-P(A))=0.10304

Either a woman has cancer or does not have cancer. The probability of a woman having cancer is P(A), so the probability of not having cancer is 1-P(A). These are mutually exclusive events, that is, and the probabilities sum to 1.

Putting the numbers together, we calculate the probability of a forty-year-old women with a positive mammogram having cancer is 0.0776.

So this woman has about an 8 percent chance of cancer, even though her mammogram is positive.

Survey after survey of physicians shows that this type of result in not very intuitive. Many doctors answer incorrectly, assigning a much higher probability to the woman having cancer.

Building Intuition

This example is the subject of a 2003 essay by Eliezer Yudkowsky – An Intuitive Explanation of Bayes’ Theorem.

As An Intuitive (and Short) Explanation of Bayes’ Theorem notes, Yudkowsky’s intuitive explanation is around 15,000 words in length.

For a shorter explanation that helps build intuition, the following table is useful, showing the crosstabs of women in this age bracket who (a) have or do not have cancer, and (b) who test positive or negative.

Testtable

The numbers follow from our original data. The percentage of women with cancer who test positive is given as 80 percent, so the percent with cancer who test negative must be 20 percent, and so forth.

Now let’s embed the percentages of true and false positives and negatives into the table, as follows:

Testtable2

So 1 percent of forty year old women (who have routine screening) have cancer. If we multiply this 1 percent by the percent of women who have cancer and test positive, we get .008 or the chances of a true positive. Then, the chance of getting any type of positive result is .008+.99*.096=.008+.0954=0.10304.

The ratio then of the chances of a true positive to the chance of any type of positive result is 0.07763 – exactly the result following from Bayes Theorem!

CoolClips_cart0781

This may be an easier two-step procedure than trying to develop conditional probabilities directly, and plug them into a formula.

Allen Downey lists other problems of this type, with YouTube talks on Bayesian stuff that are good for beginners.

Closing Comments

I have a couple more observations.

First, this analysis is consistent with a frequency interpretation of probability.

In fact, the 1 percent figure for women who are forty getting cancer could be calculated from cause of death data and Census data. Similarly with the other numbers in the scenario.

So that’s interesting.

Bayes theorem is, in some phrasing, true by definition (of conditional probability). It can just be tool for reorganizing data about observed frequencies.

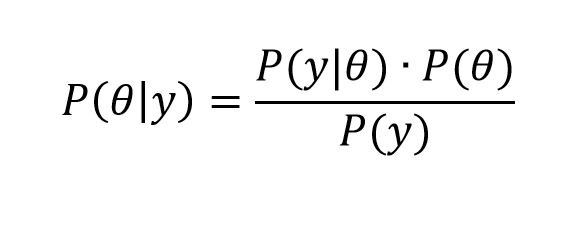
The magic comes when we transition from events to variables y and parameters θ in a version like,

Bayes2

What is this parameter θ? It certainly does not exist in “event” space in the same way as does the event of “having cancer and being a forty year old woman.” In the batting averages example, θ is a vector of parameter values of a Beta distribution – parameters which encapsulate our view of the likely variation of a batting average, given information from the previous playing season. So I guess this is where we go into “belief space”and subjective probabilities.

In my view, the issue is always whether these techniques are predictive.

Top picture courtesy of Siemens

The “Hollowing Out” of Middle Class America

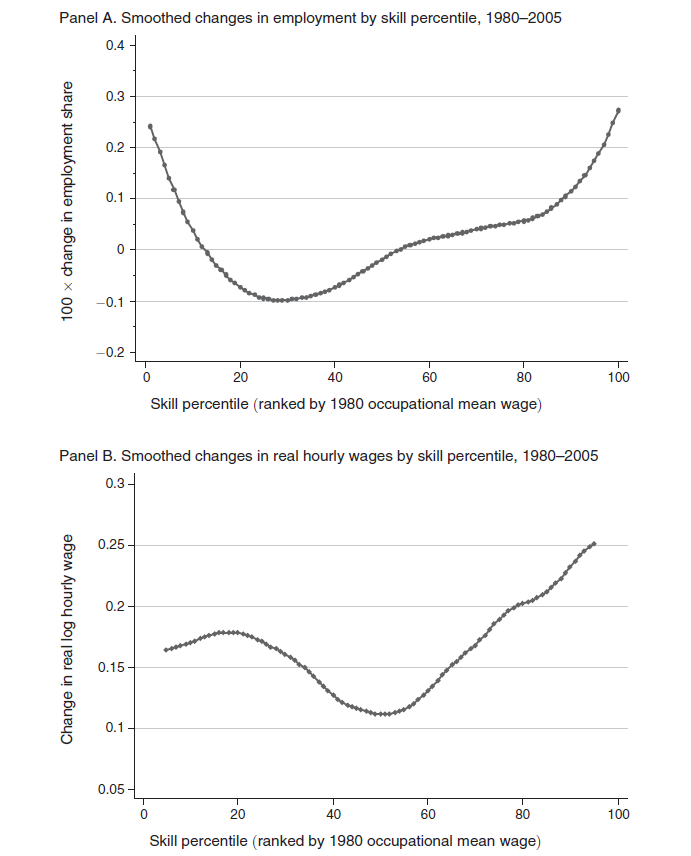
Two charts in a 2013 American Economic Review (AER) article put numbers to the “hollowing out” of middle class America – a topic celebrated with profuse anecdotes in the media.

Autor1

The top figure shows the change in employment 1980-2005 by skill level, based on Census IPUMS and American Community Survey (ACS) data. Occupations are ranked by skill level, approximated by wages in each occupation in 1980.

The lower figure documents the changes in wages of these skill levels 1980-2005.

These charts are from David Autor and David Dorn – The Growth of Low-Skill Service Jobs and the Polarization of the US Labor Market – who write that,

Consistent with the conventional view of skill-biased technological change, employment growth is differentially rapid in occupations in the upper two skill quartiles. More surprising in light of the canonical model are the employment shifts seen below the median skill level. While occupations in the second skill quartile fell as a share of employment, those in the lowest skill quartile expanded sharply. In net, employment changes in the United States during this period were strongly U-shaped in skill level, with relative employment declines in the middle of the distribution and relative gains at the tails. Notably, this pattern of employment polarization is not unique to the United States. Although not recognized until recently, a similar “polarization” of employment by skill level has been underway in numerous industrialized economies in the last 20 to 30 years.

So, employment and wage growth has been fastest in the past three or so decades (extrapolating to the present) in low skill and high skill occupations.

Among lower skill occupations, such as food service workers, security guards, janitors and gardeners, cleaners, home health aides, child care workers, hairdressers and beauticians, and recreational workers, employment grew 30 percent 1980-2005.

Among the highest paid occupations – classified as managers, professionals, technicians, and workers in finance, and public safety – the share of employment also grew by about 30 percent, but so did wages – which increased at about double the pace of the lower skill occupations over this period.

Professor Autor is in the MIT economics department, and seems to be the nexus of a lot of interesting research casting light on changes in US labor markets.

DavidAutor

In addition to “doing Big Data” as the above charts suggest, David Autor is closely associated with a new, common sense model of production activities, based on tasks and skills.

This model of the production process, enables Autor and his coresearchers to conclude that,

…recent technological developments have enabled information and communication technologies to either directly perform or permit the offshoring of a subset of the core job tasks previously performed by middle skill workers, thus causing a substantial change in the returns to certain types of skills and a measurable shift in the assignment of skills to tasks.

So it’s either a computer (robot) or a Chinaman who gets the middle-class bloke’s job these days.

And to drive that point home – (and, please, I consider the achievements of the PRC in lifting hundreds of millions out of extreme poverty to be of truly historic dimension) Autor with David Dorn and Gordon Hansen publihsed another 2013 article in the AER titled The China Syndrome: Local Labor Market Effects of Import Competition in the United States.

This study analyzes local labor markets and trade shocks to these markets, according to initial patterns of industry specialization.

The findings are truly staggering – or at least have been equivocated or obfuscated for years by special pleaders and lobbyists.

Dorn et al write,

The value of annual US goods imports from China increased by a staggering 1,156 percent from 1991 to 2007, whereas US exports to China grew by much less…. 

Our analysis finds that exposure to Chinese import competition affects local labor markets not just through manufacturing employment, which unsurprisingly is adversely affected, but also along numerous other margins. Import shocks trigger a decline in wages that is primarily observed outside of the manufacturing sector. Reductions in both employment and wage levels lead to a steep drop in the average earnings of households. These changes contribute to rising transfer payments through multiple federal and state programs, revealing an important margin of adjustment to trade that the literature has largely overlooked,

This research – conducted in terms of ordinary least squares (OLS), two stage least squares (2SLS) as well as “instrumental” regressions – is definitely not something a former trade unionist is going to ponder in the easy chair after work at the convenience store. So it’s kind of safe in terms of arousing the ire of the masses.

But I digress.

For my purposes here, Autor and his co-researchers put pieces of the puzzle in place so we can see the picture.

The US occupational environment has changed profoundly since the 1980’s. Middle class jobs have simply vanished over large parts of the landscape. More specifically, good-paying production jobs, along with a lot of other more highly paid, but routinized work, has been the target of outsourcing, often to China it seems it can be demonstrated. Higher paid work by professionals in business and finance benefits from complementarities with the advances in data processing and information technology (IT) generally. In addition, there are a small number of highly paid production workers whose job skills have been updated to run more automated assembly operations which seem to be the chief beneficiaries of new investment in production in the US these days.

There you have it.

Market away, and include these facts in any forecasts you develop for the US market.

Of course, there are issues of dynamics.

First Cut Modeling – All Possible Regressions

If you can, form the regression

Y = β0+ β1X1+ β2X2+…+ βNXN

where Y is the target variable and the N variagles Xi are the predictors which have the highest correlations with the target variables, based on some cutoff value of the correlation, say +/- 0.3.

Of course, if the number of observations you have in the data are less than N, you can’t estimate this OLS regression. Some “many predictors” data shrinkage or dimension reduction technique is then necessary – and will be covered in subsequent posts.

So, for this discussion, assume you have enough data to estimate the above regression.

Chances are that the accompanying measures of significance of the coefficients βi – the t-statistics or standard errors – will indicate that only some of these betas are statistically significant.

And, if you poke around some, you probably will find that it is possible to add some of the predictors which showed low correlation with the target variable and have them be “statistically significant.”

So this is all very confusing. What to do?

Well, if the number of predictors is, say, on the order of 20, you can, with modern computing power, simply calculate all possible regressions with combinations of these 20 predictors. That turns out to be around 1 million regressions (210 – 1). And you can reduce this number by enforcing known constraints on the betas, e.g. increasing family income should be unambiguously related to the target variable and, so, if its sign in a regression is reversed, throw that regression out from consideration.

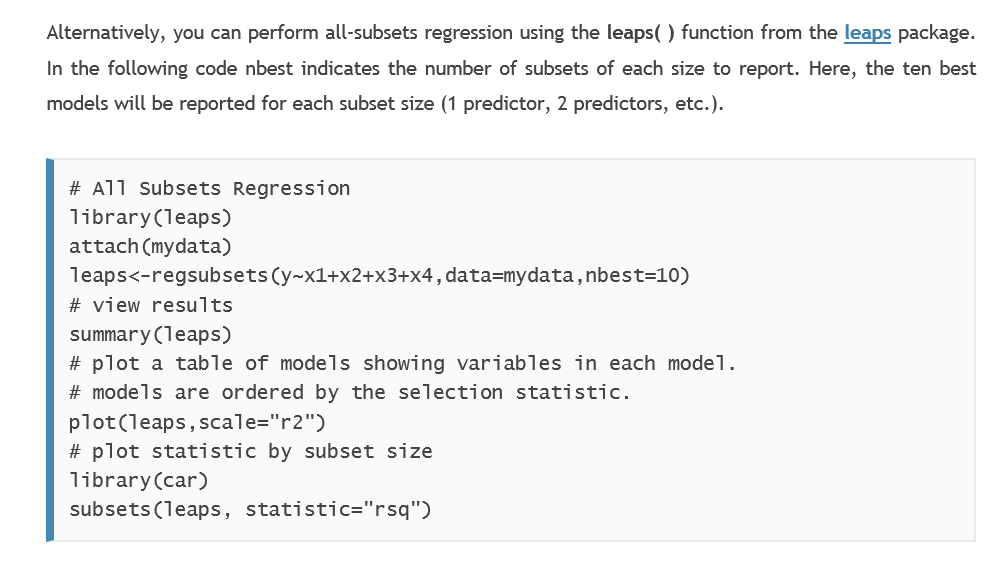
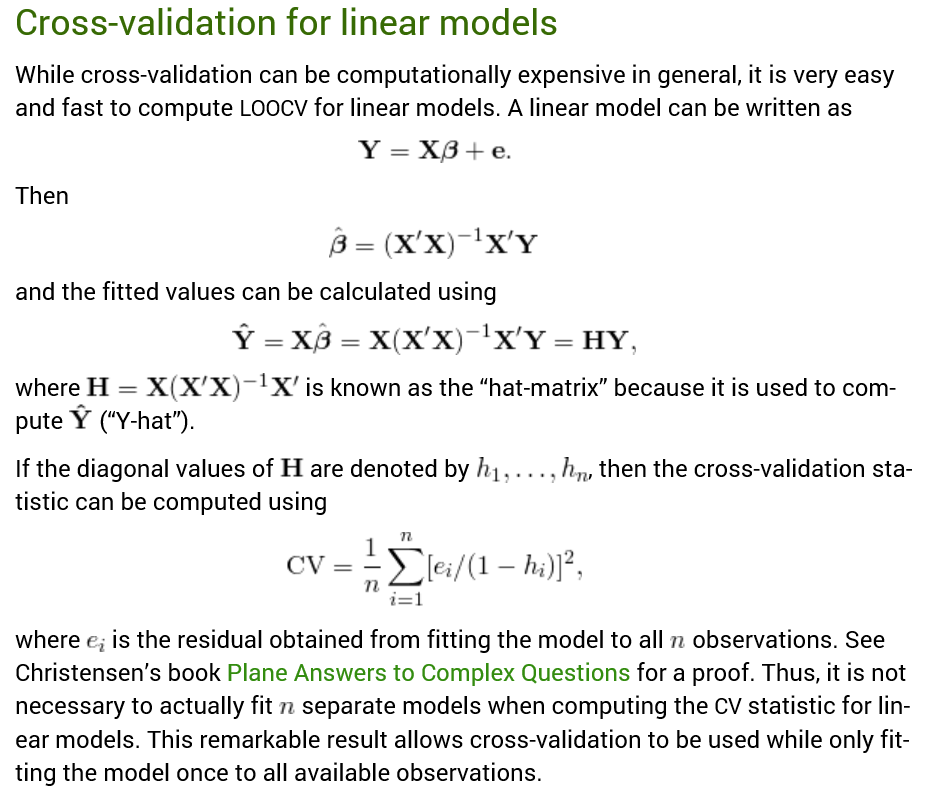
The statistical programming language R has packages set up to do all possible regressions. See, for example, Quick-R which offers this useful suggestion –

leapsBut what other metrics, besides R2, should be used to evaluate the possible regressions?

In-Sample Regression Metrics

I am not an authority on the Akaike Information Criterion (AIC) or the Bayesian Information Criterion (BIC), which, in addition, to good old R2, are leading in-sample metrics for regression adequacy.

With this disclaimer, here are a few points about the AIC and BIC.

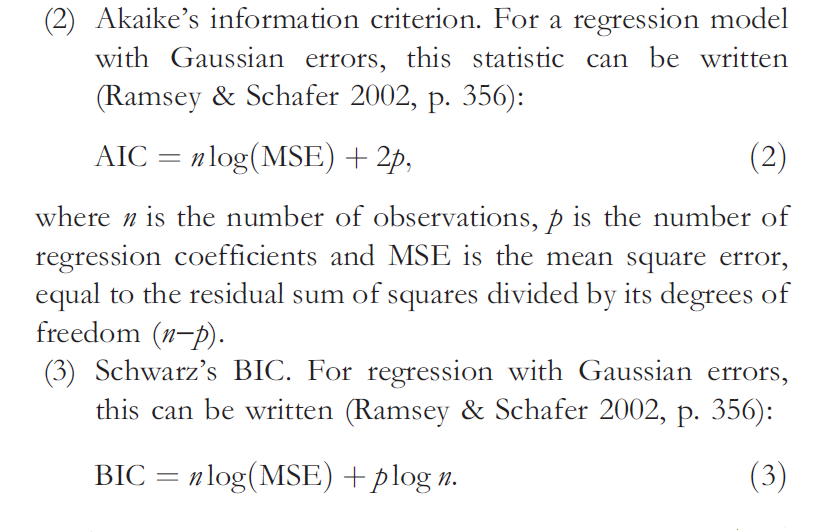
AIC

So, as you can see, both the AIC and BIC are functions of the mean square error (MSE), as well as the number of predictors in the equation and the sample size. Both metrics essentially penalize models with a lot of explanatory variables, compared with other models that might perform similarly with fewer predictors.

  • There is something called the AIC-BIC dilemma. In a valuable reference on variable selection, Serena Ng writes that the AIC is understood to fall short when it comes to consistent model selection. Hyndman, in another must-read on this topic, writes that because of the heavier penalty, the model chosen by BIC is either the same as that chosen by AIC, or one with fewer terms.

Consistency in discussions of regression methods relates to the large sample properties of the metric or procedure in question. Basically, as the sample size n becomes indefinitely large (goes to infinity) consistent estimates or metrics converge to unbiased values. So the AIC is not in every case consistent, although I’ve read research which suggests that the problem only arises in very unusual setups.

  • In many applications, the AIC and BIC can both be minimum for a particular model, suggesting that this model should be given serious consideration.

Out-of-Sample Regression Metrics

I’m all about out-of-sample (OOS) metrics of adequacy of forecasting models.

It’s too easy to over-parameterize models and come up with good testing on in-sample data.

So I have been impressed with endorsements such as that of Hal Varian of cross-validation.

So, ideally, you partition the sample data into training and test samples. You estimate the predictive model on the training sample, and then calculate various metrics of adequacy on the test sample.

The problem is that often you can’t really afford to give up that much data to the test sample.

So cross-validation is one solution.

In k-fold cross validation, you partition the sample into k parts, estimating the designated regression on data from k-1 of those segments, and using the other or kth segment to test the model. Do this k times and then average or somehow collate the various error metrics. That’s the drill.,

Again, Quick-R suggests useful R code.

Hyndman also highlights a handy matrix formula to quickly compute the Leave Out One Cross Validation (LOOCV) metric.

LOOCV

LOOCV is not guaranteed to find the true model as the sample size increases, i.e. it is not consistent.

However, k-fold cross-validation can be consistent, if k increases with sample size.

Researchers recently have shown, however, that LOOCV can be consistent for the LASSO.

Selecting regression variables is, indeed, a big topic.

Coming posts will focus on the problem of “many predictors” when the set of predictors is greater in number than the set of observations on the relevant variables.

Top image from Washington Post

Selecting Predictors – the Specification Problem

I find toy examples helpful in exploratory work.

So here is a toy example showing the pitfalls of forward selection of regression variables, in the presence of correlation between predictors. In other words, this is an example of the specification problem.

Suppose the true specification or regression is –

y = 20x1-11x2+10x3

and the observations on x2 and x3 in the available data are correlated.

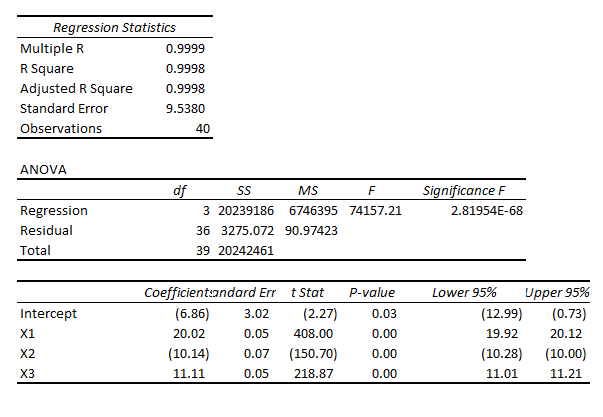
To produce examples of this system, I create columns of random numbers in which the second and third columns are correlated with a correlation coefficient of around 0.6. I also add a random error term with zero mean and constant variance of 10. Then, after generating the data and the error terms, I apply the coefficients indicated above and estimate values for the dependent variable y.

Then, specifying all three variables,  x1, x2, and x3, I estimate regressions which characteristically have coefficient values not far from the (20,-11, 10), such as,

spregThis, of course, is a regression output from Microsoft Excel, where I developed this simple Monte Carlo simulation which has 40 “observations.”

If you were lucky enough to estimate this regression initially, you well might stop and not bother about dropping variables to estimate other potentially competing models.

However, if you start with fewer variables, you encounter a significant difficulty.

Here is the distribution of x2 in repeated estimates of a regression with explanatory variables x1 and x2 –

coeff2

As you can see, the various estimates of the value of this coefficient, whose actual or true value is -11, are wide of the mark. In fact, none of the 1000 estimates in this simulation proved to be statistically significant at standard levels.

Using some flavors of forward regression, therefore, you well might decide to drop x2 in the specification and try including x3.

But you would have the same type of problem in that case, too, since x2 and x3 are correlated.

I sometimes hear people appealing to stability arguments in the face of the specification problem. In other words, they strive to find a stable set of core predictors, believing that if they can do this, they will have controlled as effectively as they can for this problem of omitted variables which are correlated with other variables that are included in the specification.

Selecting Predictors

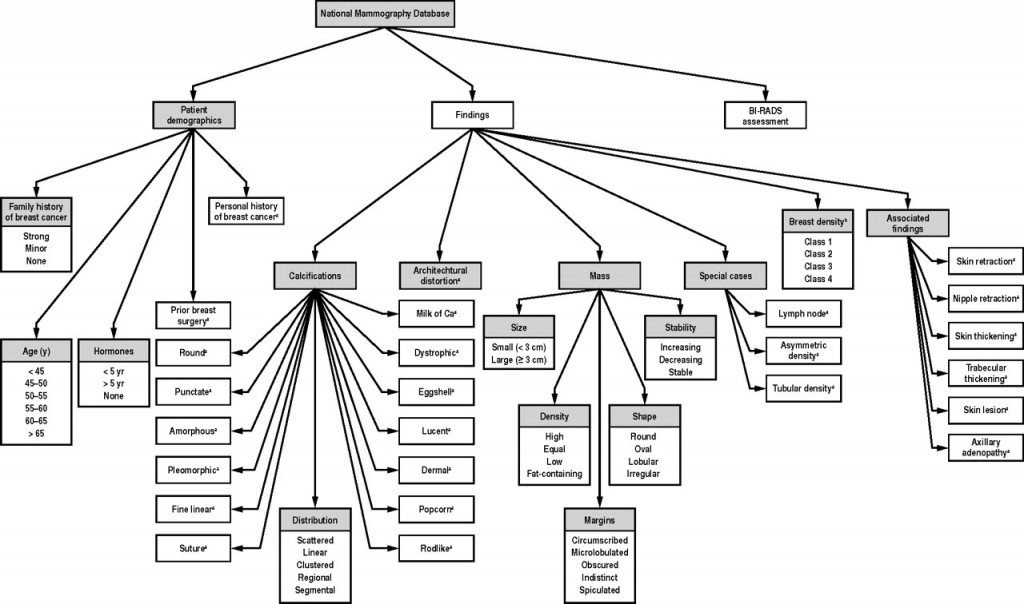
In a recent post on logistic regression, I mentioned research which developed diagnostic tools for breast cancer based on true Big Data parameters – notably 62,219 consecutive mammography records from 48,744 studies in 18,270 patients reported using the Breast Imaging Reporting and Data System (BI-RADS) lexicon and the National Mammography Database format between April 5, 1999 and February 9, 2004.

This research built a logistic regression model with 36 predictors, selected from the following information residing in the National Mammography Database (click to enlarge).

        breastcancertyp               

The question arises – are all these 36 predictors significant? Or what is the optimal model? How does one select the subset of the available predictor variables which really count?

This is the problem of selecting predictors in multivariate analysis – my focus for several posts coming up.

So we have a target variable y and set of potential predictors x={x1,x2,….,xn}. We are interested in discovering a predictive relationship, y=F(x*) where x* is some possibly proper subset of x. Furthermore, we have data comprising m observations on y and x, which in due time we will label with subscripts.

There are a range of solutions to this very real, very practical modeling problem.

Here is my short list.

  1. Forward Selection. Begin with no candidate variables in the model. Select the variable that boosts some goodness-of-fit or predictive metric the most. Traditionally, this has been R-Squared for an in-sample fit. At each step, select the candidate variable that increases the metric the most. Stop adding variables when none of the remaining variables are significant. Note that once a variable enters the model, it cannot be deleted.
  2. Backward Selection. This starts with the superset of potential predictors and eliminates variables which have the lowest score by some metric – traditionally, the t-statistic.
  3. Stepwise regression. This combines backward and forward selection of regressors.
  4. Regularization and Selection by means of the LASSO. Here is the classic article and here is a post, and here is a post in this blog on the LASSO.
  5. Information criteria applied to all possible regressions – pick the best specification by applying the Aikaike Information Criterion (AIC) or Bayesian Information Criterion (BIC) to all possible combinations of regressors. Clearly, this is only possible with a limited number of potential predictors.
  6. Cross-validation or other out-of-sample criteria applied to all possible regressions – Typically, the error metrics on the out-of-sample data cuts are averaged, and the lowest average error model is selected out of all possible combinations of predictors.
  7. Dimension reduction or data shrinkage with principal components. This is a many predictors formulation, whereby it is possible to reduce a large number of predictors to a few principal components which explain most of the variation in the data matrix.
  8. Dimension reduction or data shrinkage with partial least squares. This is similar to the PC approach, but employs a reduction to information from both the set of potential predictors and the dependent or target variable.

There certainly are other candidate techniques, but this is a good list to start with.

Wonderful topic, incidentally. Dives right into the inner sanctum of the mysteries of statistical science as practiced in the real world.

Let me give you the flavor of how hard it is to satisfy the classical criterion for variable selection, arriving at unbiased or consistent estimates of effects of a set of predictors.

And, really, the paradigmatic model is ordinary least squares (OLS) regression in which the predictive function F(.) is linear.

The Specification Problem

The problem few analysts understand is called specification error.

So assume that there is a true model – some linear expression in variables multiplied by their coefficients, possibly with a constant term added.

Then, we have some data to estimate this model.

Now the specification problem is that when predictors are not orthogonal, i.e. when they are correlated, leaving out a variable from the “true” specification imparts a bias to the estimates of coefficients of variables included in the regression.

This complications sequential methods of selecting predictors for the regression.

So in any case I will have comments forthcoming on methods of selecting predictors.

Medical/Health Predictive Analytics – Logistic Regression

The case for assessing health risk with logistic regression is made by authors of a 2009 study, which is also a sort of model example for Big Data in diagnostic medicine.

As the variables that help predict breast cancer increase in number, physicians must rely on subjective impressions based on their experience to make decisions. Using a quantitative modeling technique such as logistic regression to predict the risk of breast cancer may help radiologists manage the large amount of information available, make better decisions, detect more cancers at early stages, and reduce unnecessary biopsies

This study – A Logistic Regression Model Based on the National Mammography Database Format to Aid Breast Cancer Diagnosis  – pulled together 62,219 consecutive mammography records from 48,744 studies in 18,270 patients reported using the Breast Imaging Reporting and Data System (BI-RADS) lexicon and the National Mammography Database format between April 5, 1999 and February 9, 2004.

The combination of medical judgment and an algorithmic diagnostic tool based on extensive medical records is, in the best sense, the future of medical diagnosis and treatment.

And logistic regression has one big thing going for it – a lot of logistic regressions have been performed to identify risk factors for various diseases or for mortality from a particular ailment.

A logistic regression, of course, maps a zero/one or categorical variable onto a set of explanatory variables.

This is not to say that there are not going to be speedbumps along the way. Interestingly, these are data science speedbumps, what some would call statistical modeling issues.

Picking the Right Variables, Validating the Logistic Regression

The problems of picking the correct explanatory variables for a logistic regression and model validation are linked.

The problem of picking the right predictors for a logistic regression is parallel to the problem of picking regressors in, say, an ordinary least squares (OLS) regression with one or two complications. You need to try various specifications (sets of explanatory variables) and utilize a raft of diagnostics to evaluate the different models. Cross-validation, utilized in the breast cancer research mentioned above, is probably better than in-sample tests. And, in addition, you need to be wary of some of the weird features of logistic regression.

A survey of medical research from a few years back highlights the fact that a lot of studies shortcut some of the essential steps in validation.

A Short Primer on Logistic Regression

I want to say a few words about how the odds-ratio is the key to what logistic regression is all about.

Logistic regression, for example, does not “map” a predictive relationship onto a discrete, categorical index, typically a binary, zero/one variable, in the same way ordinary least squares (OLS) regression maps a predictive relationship onto dependent variables. In fact, one of the first things one tends to read, when you broach the subject of logistic regression, is that, if you try to “map” a binary, 0/1 variable onto a linear relationship β01x12x2 with OLS regression, you are going to come up against the problem that the predictive relationship will almost always “predict” outside the [0,1] interval.

Instead, in logistic regression we have a kind of background relationship which relates an odds-ratio to a linear predictive relationship, as in,

ln(p/(1-p)) = β01x12x2

Here p is a probability or proportion and the xi are explanatory variables. The function ln() is the natural logarithm to the base e (a transcendental number), rather than the logarithm to the base 10.

The parameters of this logistic model are β0, β1, and β2.

This odds ratio is really primary and from the logarithm of the odds ratio we can derive the underlying probability p. This probability p, in turn, governs the mix of values of an indicator variable Z which can be either zero or 1, in the standard case (there being a generalization to multiple discrete categories, too).

Thus, the index variable Z can encapsulate discrete conditions such as hospital admissions, having a heart attack, or dying – generally, occurrences and non-occurrences of something.

Chinesemathteacher

It’s exactly analogous to flipping coins, say, 100 times. There is a probability of getting a heads on a flip, usually 0.50. The distribution of the number of heads in 100 flips is a binomial, where the probability of getting say 60 heads and 40 tails is the combination of 100 things taken 60 at a time, multiplied into (0.5)60*(0.5)40. The combination of 100 things taken 60 at a time equals 60!/(60!40!) where the exclamation mark indicates “factorial.”

Similarly, the probability of getting 60 occurrences of the index Z=1 in a sample of 100 observations is (p)60*(1-p)40multiplied by 60!/(60!40!).

The parameters βi in a logistic regression are estimated by means of maximum likelihood (ML).  Among other things, this can mean the optimal estimates of the beta parameters – the parameter values which maximize the likelihood function – must be estimated by numerical analysis, there being no closed form solutions for the optimal values of β0, β1, and β2.

In addition, interpretation of the results is intricate, there being no real consensus on the best metrics to test or validate models.

SAS and SPSS as well as software packages with smaller market shares of the predictive analytics space, offer algorithms, whereby you can plug in data and pull out parameter estimates, along with suggested metrics for statistical significance and goodness of fit.

There also are logistic regression packages in R.

But you can do a logistic regression, if the data are not extensive, with an Excel spreadsheet.

This can be instructive, since, if you set it up from the standpoint of the odds-ratio, you can see that only certain data configurations are suitable. These configurations – I refer to the values which the explanatory variables xi can take, as well as the associated values of the βi – must be capable of being generated by the underlying probability model. Some data configurations are virtually impossible, while others are inconsistent.

This is a point I find lacking in discussions about logistic regression, which tend to note simply that sometimes the maximum likelihood techniques do not converge, but explode to infinity, etc.

Here is a spreadsheet example, where the predicting equation has three parameters and I determine the underlying predictor equation to be,

ln(p/(1-p))=-6+3x1+.05x2

and we have the data-
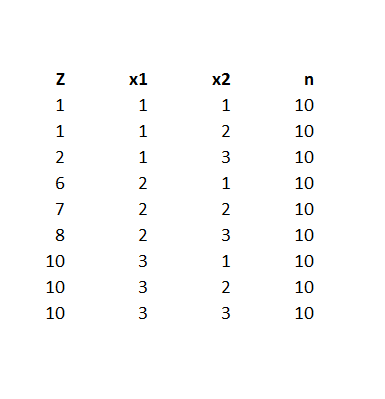
logisticregmodel

Notice the explanatory variables x1 and x2 also are categorical, or at least, discrete, and I have organized the data into bins, based on the possible combinations of the values of the explanatory variables – where the number of cases in each of these combinations or populations is given to equal 10 cases. A similar setup can be created if the explanatory variables are continuous, by partitioning their ranges and sorting out the combination of ranges in however many explanatory variables there are, associating the sum of occurrences associated with these combinations. The purpose of looking at the data this way, of course, is to make sense of an odds-ratio.

The predictor equation above in the odds ratio can be manipulated into a form which explicitly indicates the probability of occurrence of something or of Z=1. Thus,

p= eβ0+β1×1+β2×2/(1+ eβ0+β1×1+β2×2)

where this transformation takes advantage of the principle that elny = y.

So with this equation for p, I can calculate the probabilities associated with each of the combinations in the data rows of the spreadsheet. Then, given the probability of that configuration, I calculate the expected value of Z=1 by the formula 10p. Thus, the mean of a binomial variable with probability p is np, where n is the number of trials. This sequence is illustrated below (click to enlarge).
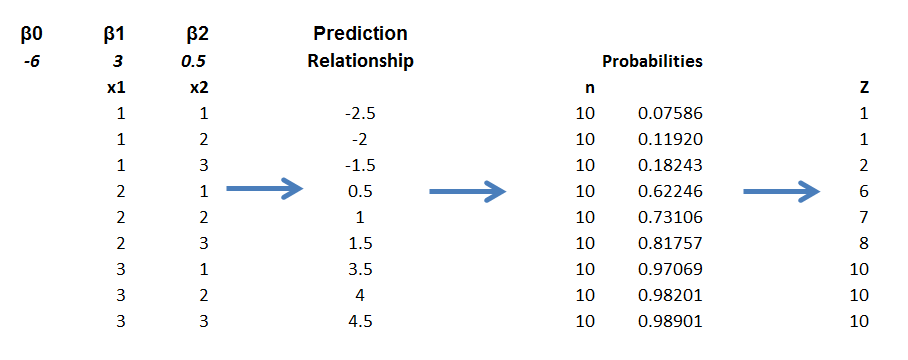
sequence

Picking the “success rates” for each of the combinations to equal the expected value of the occurrences, given 10 “trials,” produces a highly consistent set of data.

Along these lines, the most valuable source I have discovered for ML with logistic regression is a paper by Scott
Czepiel – Maximum Likelihood Estimation of Logistic Regression Models: Theory and Implementation
.

I can readily implement Czepiel’s log likelihood function in his Equation (9) with an Excel spreadsheet and Solver.

It’s also possible to see what can go wrong with this setup.

For example, the standard deviation of a binomial process with probability p and n trials is np(1-p). If we then simulate the possible “occurrences” for each of the nine combinations, some will be closer to the estimate of np used in the above spreadsheet, others will be more distant. Peforming such simulations, however, highlights that some numbers of occurrences for some combinations will simply never happen, or are well nigh impossible, based on the laws of chance.

Of course, this depends on the values of the parameters selected, too – but it’s easy to see that, whatever values selected for the parameters, some low probability combinations will be highly unlikely to produce a high number for successes. This results in a nonconvergent ML process, so some parameters simply may not be able to be estimated.

This means basically that logistic regression is less flexible in some sense than OLS regression, where it is almost always possible to find values for the parameters which map onto the dependent variable.

What This Means

Logistic regression, thus, is not the exact analogue of OLS regression, but has nuances of its own. This has not prohibited its wide application in medical risk assessment (and I am looking for a survey article which really shows the extent of its application across different medical fields).

There also are more and more reports of the successful integration of medical diagnostic systems, based in some way on logistic regression analysis, in informing medical practices.

But the march of data science is relentless. Just when doctors got a handle on logistic regression, we have a raft of new techniques, such as random forests and splines.

Header image courtesy of: National Kidney & Urologic Diseases Information Clearinghouse (NKUDIC)

Predicting the Market Over Short Time Horizons

Google “average time a stock is held.” You will come up with figures that typically run around 20 seconds. High frequency trades (HFT) dominate trading volume on the US exchanges.

All of which suggests the focus on the predictability of stock returns needs to position more on intervals lasting seconds or minutes, rather than daily, monthly, or longer trading periods.

So, it’s logical that Michael Rechenthin, a newly minted Iowa Ph.D., and Nick Street, a Professor of Management, are getting media face time from research which purportedly demonstrates the existence of predictable short-term trends in the market (see Using conditional probability to identify trends in intra-day high-frequency equity pricing).

Here’s the abstract –

By examining the conditional probabilities of price movements in a popular US stock over different high-frequency intra-day timespans, varying levels of trend predictability are identified. This study demonstrates the existence of predictable short-term trends in the market; understanding the probability of price movement can be useful to high-frequency traders. Price movement was examined in trade-by-trade (tick) data along with temporal timespans between 1 s to 30 min for 52 one-week periods for one highly-traded stock. We hypothesize that much of the initial predictability of trade-by-trade (tick) data is due to traditional market dynamics, or the bouncing of the price between the stock’s bid and ask. Only after timespans of between 5 to 10 s does this cease to explain the predictability; after this timespan, two consecutive movements in the same direction occur with higher probability than that of movements in the opposite direction. This pattern holds up to a one-minute interval, after which the strength of the pattern weakens.

The study examined price movements of the exchange traded fund SPY, during 2005, finding that

.. price movements can be predicted with a better than 50-50 accuracy for anywhere up to one minute after the stock leaves the confines of its bid-ask spread. Probabilities continue to be significant until about five minutes after it leaves the spread. By 30 minutes, the predictability window has closed.

Of course, the challenges of generalization in this world of seconds and minutes is tremendous. Perhaps, for example, the patterns the authors identify are confined to the year of the study. Without any theoretical basis, brute force generalization means riffling through additional years of 31.5 million seconds each.

Then, there are the milliseconds, and the recent blockbuster written by Michael Lewis – Flash Boys: A Wall Street Revolt.

I’m on track for reading this book for a bookclub to which I belong.

As I understand it, Lewis, who is one of my favorite financial writers, has uncovered a story whereby high frequency traders, operating with optical fiber connections to the New York Stock Exchange, sometimes being geographically as proximate as possible, can exploit more conventional trading – basically buying a stock after you have put in a buy order, but before your transaction closes, thus raising your price if you made a market order.

MLewis

The LA Times  has a nice review of the book and ran the above photo of Lewis.