Machine Learning and Next Week

Here is a nice list of machine learning algorithms. Remember, too, that they come in two or three flavors – supervised, unsupervised, semi-supervised, and reinforcement learning.

MachineLearning

An objective of mine is to cover each of these techniques with an example or two, with special reference to their relevance to forecasting.

I got this list, incidentally, from an interesting Australian blog Machine Learning Mastery.

The Coming Week

Aligned with this marvelous list, I’ve decided to focus on robotics for a few blog posts coming up.

This is definitely exploratory, but recently I heard a presentation by an economist from the National Association of Manufacturers (NAM) on manufacturing productivity, among other topics. Apparently, robotics is definitely happening on the shop floor – especially in the automobile industry, but also in semiconductors and electronics assembly.

And, as mankind pushes the envelope, drilling for oil in deeper and deeper areas offshore and handling more and more radioactive and toxic material, the need for significant robotic assistance is definitely growing.

I’m looking for indices and how to construct them – how to guage the line between merely automatic and what we might more properly call robotic.

LInks – late May

US and Global Economic Prospects

Goldman’s Hatzius: Rationale for Economic Acceleration Is Intact

We currently estimate that real GDP fell -0.7% (annualized) in the first quarter, versus a December consensus estimate of +2½%. On the face of it, this is a large disappointment. It raises the question whether 2014 will be yet another year when initially high hopes for growth are ultimately dashed.

 Today we therefore ask whether our forecast that 2014-2015 will show a meaningful pickup in growth relative to the first four years of the recovery is still on track. Our answer, broadly, is yes. Although the weak first quarter is likely to hold down real GDP for 2014 as a whole, the underlying trends in economic activity are still pointing to significant improvement….

 The basic rationale for our acceleration forecast of late 2013 was twofold—(1) an end to the fiscal drag that had weighed on growth so heavily in 2013 and (2) a positive impulse from the private sector following the completion of the balance sheet adjustments specifically among US households. Both of these points remain intact.

Economy and Housing Market Projected to Grow in 2015

Despite many beginning-of-the-year predictions about spring growth in the housing market falling flat, and despite a still chugging economy that changes its mind quarter-to-quarter, economists at the National Association of Realtors and other industry groups expect an uptick in the economy and housing market through next year.

The key to the NAR’s optimism, as expressed by the organization’s chief economist, Lawrence Yun, earlier this week, is a hefty pent-up demand for houses coupled with expectations of job growth—which itself has been more feeble than anticipated. “When you look at the jobs-to-population ratio, the current period is weaker than it was from the late 1990s through 2007,” Yun said. “This explains why Main Street America does not fully feel the recovery.”

Yun’s comments echo those in a report released Thursday by Fitch Ratings and Oxford Analytica that looks at the unusual pattern of recovery the U.S. is facing in the wake of its latest major recession. However, although the U.S. GDP and overall economy have occasionally fluctuated quarter-to-quarter these past few years, Yun said that there are no fresh signs of recession for Q2, which could grow about 3 percent.

Report: San Francisco has worse income inequality than Rwanda

If San Francisco was a country, it would rank as the 20th most unequal nation on Earth, according to the World Bank’s measurements.

Googlebus

Climate Change

When Will Coastal Property Values Crash And Will Climate Science Deniers Be The Only Buyers?

sea

How Much Will It Cost to Solve Climate Change?

Switching from fossil fuels to low-carbon sources of energy will cost $44 trillion between now and 2050, according to a report released this week by the International Energy Agency.

Natural Gas and Fracking

How The Russia-China Gas Deal Hurts U.S. Liquid Natural Gas Industry

This could dampen the demand – and ultimately the price for – LNG from the United States. East Asia represents the most prized market for producers of LNG. That’s because it is home to the top three importers of LNG in the world: Japan, South Korea and China. Together, the three countries account for more than half of LNG demand worldwide. As a result, prices for LNG are as much as four to five times higher in Asia compared to what natural gas is sold for in the United States.

The Russia-China deal may change that.

If LNG prices in Asia come down from their recent highs, the most expensive LNG projects may no longer be profitable. That could force out several of the U.S. LNG projects waiting for U.S. Department of Energy approval. As of April, DOE had approved seven LNG terminals, but many more are waiting for permits.

LNG terminals in the United States will also not be the least expensive producers. The construction of several liquefaction facilities in Australia is way ahead of competitors in the U.S., and the country plans on nearly quadrupling its LNG capacity by 2017. More supplies and lower-than-expected demand from China could bring down prices over the next several years.

Write-down of two-thirds of US shale oil explodes fracking mythThis is big!

Next month, the US Energy Information Administration (EIA) will publish a new estimate of US shale deposits set to deal a death-blow to industry hype about a new golden era of US energy independence by fracking unconventional oil and gas.

EIA officials told the Los Angeles Times that previous estimates of recoverable oil in the Monterey shale reserves in California of about 15.4 billion barrels were vastly overstated. The revised estimate, they said, will slash this amount by 96% to a puny 600 million barrels of oil.

The Monterey formation, previously believed to contain more than double the amount of oil estimated at the Bakken shale in North Dakota, and five times larger than the Eagle Ford shale in South Texas, was slated to add up to 2.8 million jobs by 2020 and boost government tax revenues by $24.6 billion a year.

China

The Annotated History Of The World’s Next Reserve Currency

yuanhistory

Goldman: Prepare for Chinese property bust

…With demand poised to slow given a tepid economic backdrop, weaker household affordability, rising mortgage rates and developer cash flow weakness, we believe current construction capacity of the domestic property industry may be excessive. We estimate an inventory adjustment cycle of two years for developers, driving 10%-15% price cuts in most cities with 15% volume contraction from 2013 levels in 2014E-15E. We also expect M&A activities to take place actively, favoring developers with strong balance sheet and cash flow discipline.

China’s Shadow Banking Sector Valued At 80% of GDP

The China Banking Regulatory Commission has shed light on the country’s opaque shadow banking sector. It was as large as 33 trillion yuan ($5.29 trillion) in mid-2013 and equivalent to 80% of last year’s GDP, according to Yan Qingmin, a vice chairman of the commission.

In a Tuesday WeChat blog sent by the Chong Yang Institute for Financial Studies, Renmin University, Yan wrote that his calculation is based on shadow lending activities from asset management businesses to trust companies, a definition he said was very broad.  Yan said the rapid expansion of the sector, which was equivalent to 53% of GDP in 2012, entailed risks of some parts of the shadow banking business, but not necessarily the Chinese economy.

Yan’s estimation is notably higher than that of the Chinese Academy of Social Sciences. The government think tank said on May 9 that the sector has reached 27 trillion yuan ($4.4 trillion in 2013) and is equivalent to nearly one fifth of the domestic banking sector’s total assets.

Massive, Curvaceous Buildings Designed to Imitate a Mountain Forest

Chinamassive

Information Technology (IT)

I am an IT generalist. Am I doomed to low pay forever? Interesting comments and suggestions to this question on a Forum maintained by The Register.

I’m an IT generalist. I know a bit of everything – I can behave appropriately up to Cxx level both internally and with clients, and I’m happy to crawl under a desk to plug in network cables. I know a little bit about how nearly everything works – enough to fill in the gaps quickly: I didn’t know any C# a year ago, but 2 days into a project using it I could see the offshore guys were writing absolute rubbish. I can talk to DB folks about their DBs; network guys about their switches and wireless networks; programmers about their code and architects about their designs. Don’t get me wrong, I can do as well as talk, programming, design, architecture – but I would never claim to be the equal of a specialist (although some of the work I have seen from the soi-disant specialists makes me wonder whether I’m missing a trick).

My principle skill, if there is one – is problem resolution, from nitty gritty tech details (performance and functionality) to handling tricky internal politics to detoxify projects and get them moving again.

How on earth do I sell this to an employer as a full-timer or contractor? Am I doomed to a low income role whilst the specialists command the big day rates? Or should I give up on IT altogether

Crowdfunding is brutal… even when it works

China bans Windows 8

China has banned government use of Windows 8, Microsoft Corp’s latest operating system, a blow to a US technology company that has long struggled with sales in the country.

The Central Government Procurement Center issued the ban on installing Windows 8 on Chinese government computers as part of a notice on the use of energy-saving products, posted on its website last week.

Data Analytics

Statistics of election irregularities – good forensic data analytics.

Dimension Reduction With Principal Components

The method of principal components regression has achieved new prominence in machine learning, data reduction, and forecasting over the last decade.

It’s highly relevant in the era of Big Data, because it facilitates analyzing “fat” or wide databases. Fat databases have more predictors than observations. So you might have ten years of monthly data on sales, but 1000 potential predictors, meaning your database would be 120 by 1001 – obeying here the convention of stating row depth first and the number of columns second.

After a brief discussion of these Big Data applications and some elements of principal components, I illustrate dimension reduction with a violent crime database from the UC Irvine Machine Learning Repository.

Dynamic Factor Models

In terms of forecasting, a lot of research over the past decade has focused on “many predictors” and reducing the dimensionality of “fat” databases. Key names are James Stock and Mark Watson (see also) and Bai.

Stock and Watson have a white paper that has been updated several times, which can be found in PDF format at this link

stock watson generalized shrinkage June _2012.pdf

They write in the June 2012 update,

We find that, for most macroeconomic time series, among linear estimators the DFM forecasts make efficient use of the information in the many predictors by using only a small number of estimated factors. These series include measures of real economic activity and some other central macroeconomic series, including some interest rates and monetary variables. For these series, the shrinkage methods with estimated parameters fail to provide mean squared error improvements over the DFM. For a small number of series, the shrinkage forecasts improve upon DFM forecasts, at least at some horizons and by some measures, and for these few series, the DFM might not be an adequate approximation. Finally, none of the methods considered here help much for series that are notoriously difficult to forecast, such as exchange rates, stock prices, or price inflation.

Here DFM refers to dynamic factor models, essentially principal components models which utilize PC’s for lagged data.

Note also that this type of autoregressive or classical time series approach does not work well, in Stock and Watson’s judgment, for “series that are notoriously difficult to forecast, such as exchange rates, stock prices, or price inflation.”

Presumably, these series are closer to being random walks in some configuration.

Intermediate Level Concepts

Essentially, you can take any bundle of data and compute the principal components. If you mean-center and (in most cases) standardize the data, the principal components divide up the variance of this data, based on the size of their associated eigenvalues. The associated eigenvectors can be used to transform the data into an equivalent and same size set of orthogonal vectors. Really, the principal components operate to change the basis of the data, transforming it into an equivalent representation, but one in which all the variables have zero correlation with each other.

The Wikipaedia article on principal components is useful, but there is no getting around the fact that principal components can only really be understood with matrix algebra.

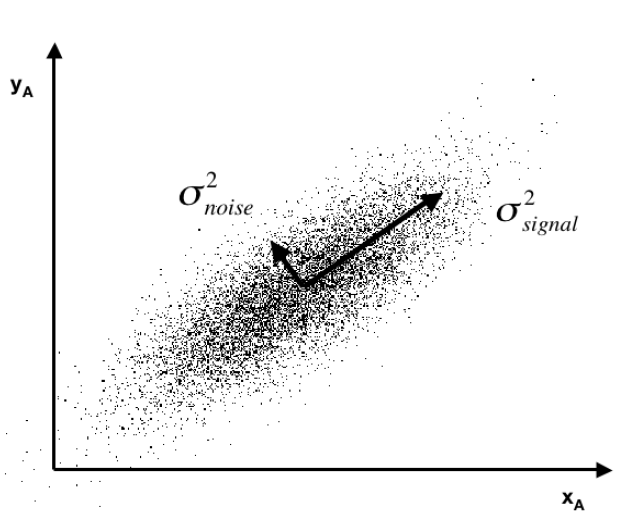
Often you see a diagram, such as the one below, showing a cloud of points distributed around a line passing through the origin of a coordinate system, but at an acute angle to those coordinates.
pcpic

This illustrates dimensionality reduction with principal components. If we express all these points in terms of this rotated set of coordinates, one of these coordinates – the signal – captures most of the variation in the data. Projections of the datapoints onto the second principal component, therefore, account for much less variance.

Principal component regression characteristically specifies only the first few principal components in the regression equation, knowing that, typically, these explain the largest portion of the variance in the data.

An Application to Crime Data

Looking for some non-macroeconomic data to illustrate principal components (PC) regression, I found the Communities and Crime Data Set in the University of California at Irving Machine Learning Repository.

The data do not illustrate “many predictors” in the sense of more predictors than observations.

Here, the crime and other data comprise 128 variables, including a violent crime variable, which are collated for 1994 cities. That is, there are more observations than predictors.

The variables included in the dataset involve the community, such as the percent of the population considered urban, and the median family income, and involving law enforcement, such as per capita number of police officers, and percent of officers assigned to drug units. The per capita violent crimes variable was calculated using population and the sum of crime variables considered violent crimes in the United States: murder, rape, robbery, and assault.

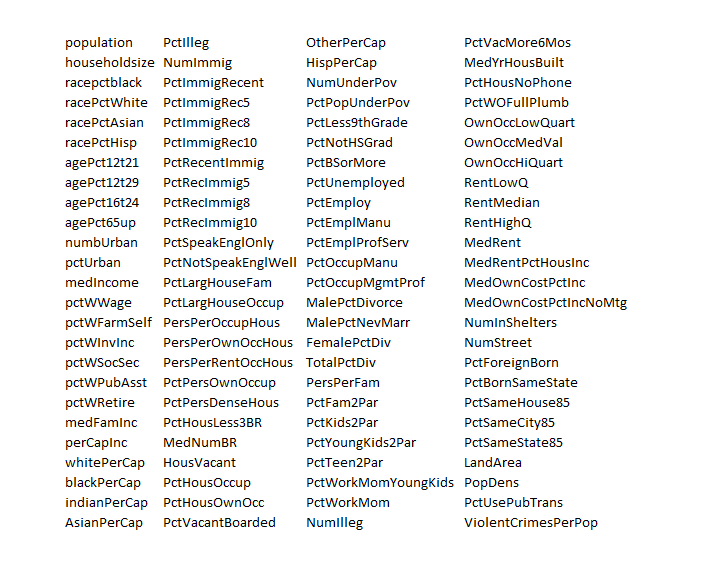
I standardize the data, dropping variables with a lot of missing values. That leaves me 100 variables, including the violent crime metric.

This table gives you a flavor of the variables included – you have to interpret the abbreviations
crime

I developed a comparison of OLS regression with principal components regression, finding that principal component regression can outperform OLS in out-of-sample predictions of violent crimes per capita.

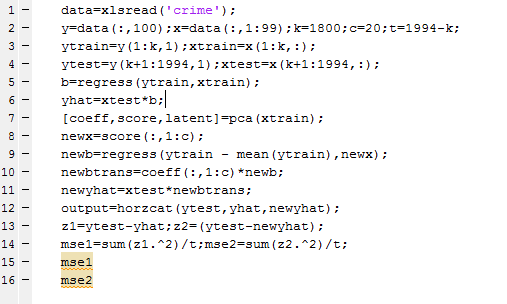
The Matlab program to carry out this analysis is as follows:
Matalbp

So I used a training set of 1800 cities, and developed OLS and PC regressions to predict violent crime per capita in the remaining 194 cities.  I calculate the  principal components (coeff) from a training set (xtrain) comprised of the first 1800 cities. Then, I select the first twenty pc’s  and translate them back to weightings on all 99 variables for application to the test set (xtest). I also calculate OLS regression coefficients on xtrain.

The mean square prediction error (mse1) of the OLS regression was 0.35 and the mean square prediction error (mse2) of the PC regression was 0.34 – really a marginal difference but large enough to make the point.

What’s really interesting is that I had to use the first twenty (20) principal components to achieve this improvement. Thus, this violent crime database has a quite diverse characteristic, compared with many socioeconomic datasets I have seen, where, as noted above, the first few principal components explain most of the variation in the data.

This method – PC regression – is especially good when there are predictors which are closely correlated (“multicollinearity”) as often is the case with market research surveys of consumer attitudes and income and wealth variables.

The bottom line here is that principal compoments can facilitate data reduction or regression regularization. Quite often, this can improve the prediction capabilities of a regression, when compared with an OLS regression using all the variables. The PC regression assigns higher weights to the most important predictors, in effect performing a kind of variable selection – although the coefficients or pc’s may not zero out variables per se.

I am continuing to work on this data with an eye to implementing k-fold cross-validation as a way of estimating the optimal number of principal components which should be used in the PC regressions.

Estimation and Variable Selection with Ridge Regression and the LASSO

I’ve posted on ridge regression and the LASSO (Least Absolute Shrinkage and Selection Operator) some weeks back.

Here I want to compare them in connection with variable selection  where there are more predictors than observations (“many predictors”).

1. Ridge regression does not really select variables in the many predictors situation. Rather, ridge regression “shrinks” all predictor coefficient estimates toward zero, based on the size of the tuning parameter λ. When ordinary least squares (OLS) estimates have high variability, ridge regression estimates of the betas may, in fact, produce lower mean square error (MSE) in prediction.

2. The LASSO, on the other hand, handles estimation in the many predictors framework and performs variable selection. Thus, the LASSO can produce sparse, simpler, more interpretable models than ridge regression, although neither dominates in terms of predictive performance. Both ridge regression and the LASSO can outperform OLS regression in some predictive situations – exploiting the tradeoff between variance and bias in the mean square error.

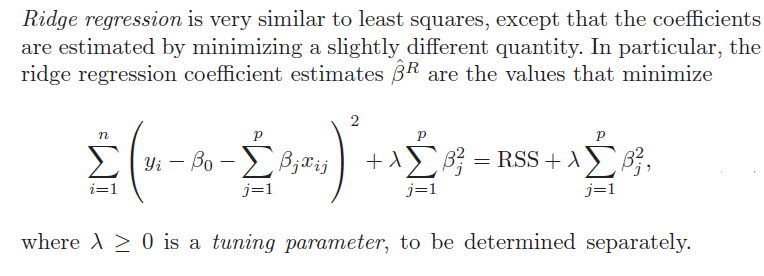
3. Ridge regression and the LASSO both involve penalizing OLS estimates of the betas. How they impose these penalties explains why the LASSO can “zero” out coefficient estimates, while ridge regression just keeps making them smaller. From
An Introduction to Statistical Learning

ridgeregressionOF

Similarly, the objective function for the LASSO procedure is outlined by An Introduction to Statistical Learning, as follows

LASSOobkf

4. Both ridge regression and the LASSO, by imposing a penalty on the regression sum of squares (RWW) shrink the size of the estimated betas. The LASSO, however, can zero out some betas, since it tends to shrink the betas by fixed amounts, as λ increases (up to the zero lower bound). Ridge regression, on the other hand, tends to shrink everything proportionally.

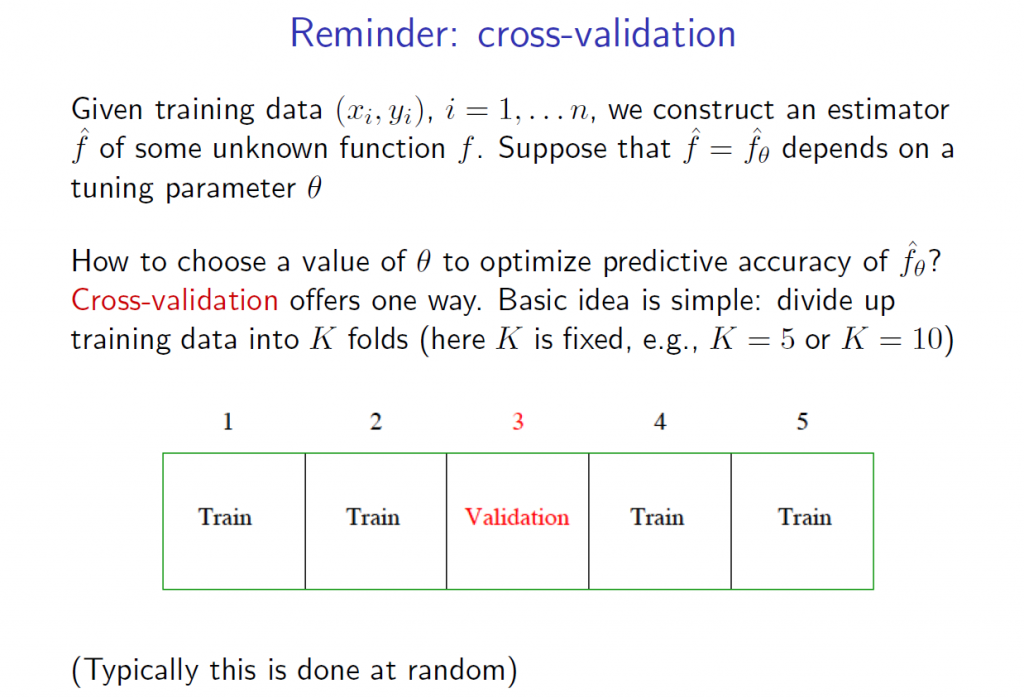
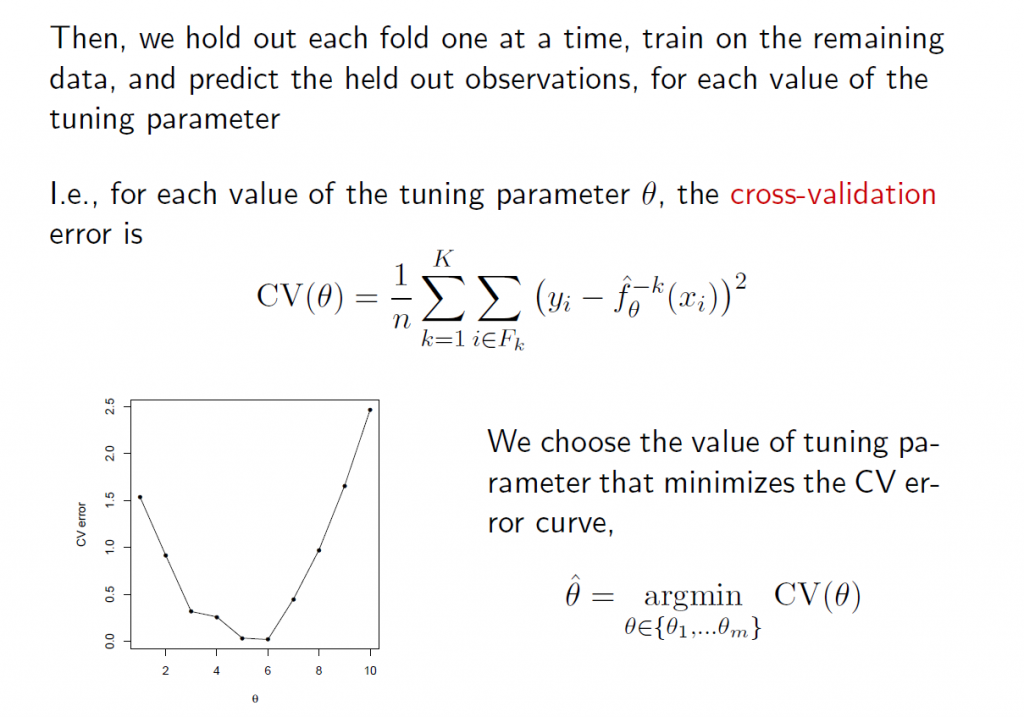
5.The tuning parameter λ in ridge regression and the LASSO usually is determined by cross-validation. Here are a couple of useful slides from Ryan Tibshirani’s Spring 2013 Data Mining course at Carnegie Mellon.

RTCV1

RTCV2

6.There are R programs which estimate ridge regression and lasso models and perform cross validation, recommended by these statisticians from Stanford and Carnegie Mellon. In particular, see glmnet at CRAN. Mathworks MatLab also has routines to do ridge regression and estimate elastic net models.

Here, for example, is R code to estimate the LASSO.

lasso.mod=glmnet(x[train,],y[train],alpha=1,lambda=grid)
plot(lasso.mod)
set.seed(1)
cv.out=cv.glmnet(x[train,],y[train],alpha=1)
plot(cv.out)
bestlam=cv.out$lambda.min
lasso.pred=predict(lasso.mod,s=bestlam,newx=x[test,])
mean((lasso.pred-y.test)^2)
out=glmnet(x,y,alpha=1,lambda=grid)
lasso.coef=predict(out,type=”coefficients”,s=bestlam)[1:20,]
lasso.coef
lasso.coef[lasso.coef!=0]

 What You Get

I’ve estimated quite a number of ridge regression and LASSO models, some with simulated data where you know the answers (see the earlier posts cited initially here) and other models with real data, especially medical or health data.

As a general rule of thumb, An Introduction to Statistical Learning notes,

 ..one might expect the lasso to perform better in a setting where a relatively small number of predictors have substantial coefficients, and the remaining predictors have coefficients that are very small or that equal zero. Ridge regression will perform better when the response is a function of many predictors, all with coefficients of roughly equal size.

The R program glmnet linked above is very flexible, and can accommodate logistic regression, as well as regression with continuous, real-valued dependent variables ranging from negative to positive infinity.


The Tibshirani’s – Statistics and Machine Learning Superstars

As regular readers of this blog know, I’ve migrated to a weekly (or potentially longer) topic focus, and this week’s topic is variable selection.

And the next planned post in the series will compare and contrast ridge regression and the LASSO (least absolute shrinkage and selection operator). There also are some new results for the LASSO. But all this takes time and is always better when actual computations can be accomplished to demonstrate points.

But in researching this, I’ve come to a deeper appreciation of the Tibshiranis.

Robert Tibshirani was an early exponent of the LASSO and has probably, as much as anyone, helped integrate the LASSO into standard statistical procedures.

Here’s his picture from Wikipedia.

RobertTib2

You might ask why put his picuture up, and my answer is that Professor Robert Tibshirani (Stanford) has a son Ryan Tibshirani, whose picture is just below.

Ryan Tibsharani has a great Data Mining course online from Carnegie Mellon, where he is an Assistant Professor.

RyanTib

Professor Ryan Tibshirani’s Spring 2013 a Data Mining course can be found at http://www.stat.cmu.edu/~ryantibs/datamining/

Reviewing Ryan Tibsharani’s slides is very helpful in getting insight into topics like cross validation, ridge regression and the LASSO.

And let us not forget Professor Ryan Tibshirani is author of essential reading about how to pick your target in darts, based on your skill level (hint – don’t go for the triple-20 unless you are good).

Free Books on Machine Learning and Statistics

Robert Tibshirani et al’s text – Elements of Statistical Learning is now in the 10th version and is available online free here.

But the simpler An Introduction to Statistical Leaning is also available for an online download of a PDF file here. This is the corrected 4th printing. The book, which I have been reading today, is really dynamite – an outstanding example of scientific exposition and explanation.

These guys and their collaborators are truly gifted teachers. They create windows into new mathematical and statistical worlds, as it were.

First Cut Modeling – All Possible Regressions

If you can, form the regression

Y = β0+ β1X1+ β2X2+…+ βNXN

where Y is the target variable and the N variagles Xi are the predictors which have the highest correlations with the target variables, based on some cutoff value of the correlation, say +/- 0.3.

Of course, if the number of observations you have in the data are less than N, you can’t estimate this OLS regression. Some “many predictors” data shrinkage or dimension reduction technique is then necessary – and will be covered in subsequent posts.

So, for this discussion, assume you have enough data to estimate the above regression.

Chances are that the accompanying measures of significance of the coefficients βi – the t-statistics or standard errors – will indicate that only some of these betas are statistically significant.

And, if you poke around some, you probably will find that it is possible to add some of the predictors which showed low correlation with the target variable and have them be “statistically significant.”

So this is all very confusing. What to do?

Well, if the number of predictors is, say, on the order of 20, you can, with modern computing power, simply calculate all possible regressions with combinations of these 20 predictors. That turns out to be around 1 million regressions (210 – 1). And you can reduce this number by enforcing known constraints on the betas, e.g. increasing family income should be unambiguously related to the target variable and, so, if its sign in a regression is reversed, throw that regression out from consideration.

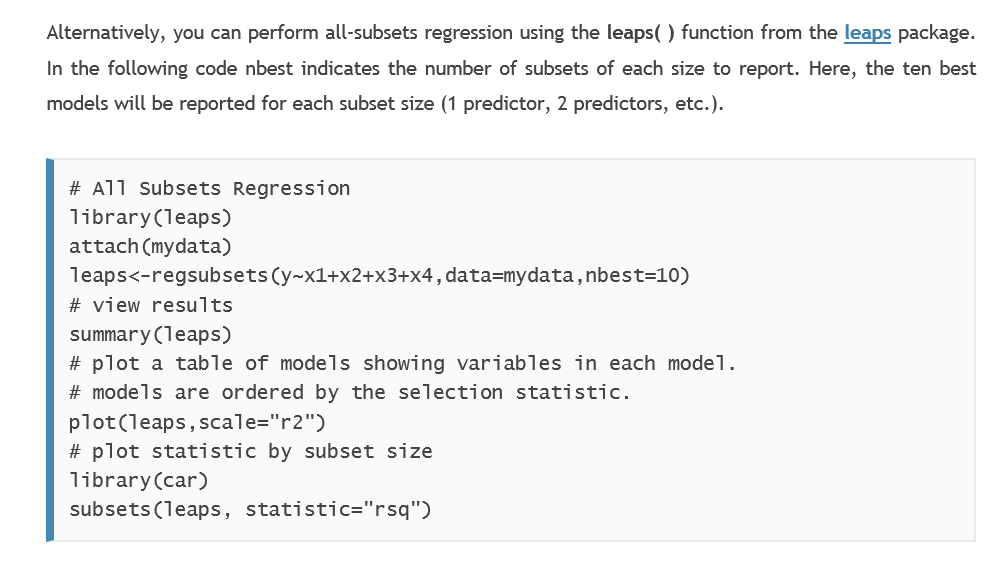
The statistical programming language R has packages set up to do all possible regressions. See, for example, Quick-R which offers this useful suggestion –

leapsBut what other metrics, besides R2, should be used to evaluate the possible regressions?

In-Sample Regression Metrics

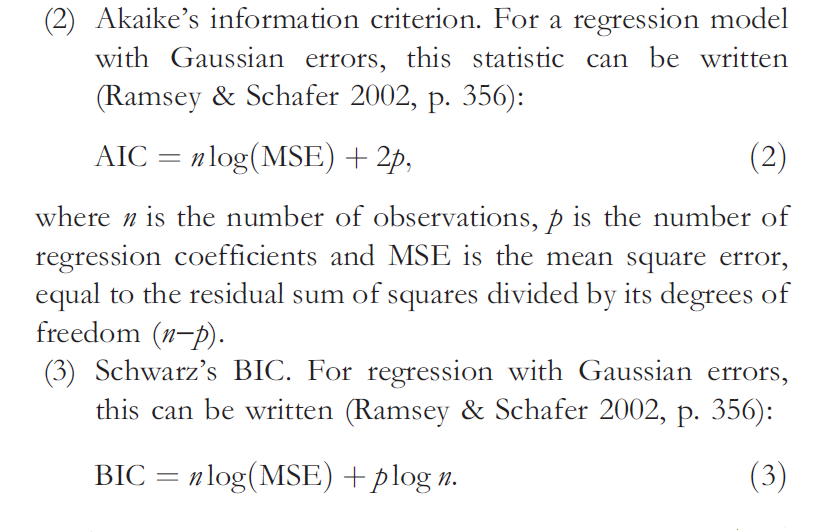
I am not an authority on the Akaike Information Criterion (AIC) or the Bayesian Information Criterion (BIC), which, in addition, to good old R2, are leading in-sample metrics for regression adequacy.

With this disclaimer, here are a few points about the AIC and BIC.

AIC

So, as you can see, both the AIC and BIC are functions of the mean square error (MSE), as well as the number of predictors in the equation and the sample size. Both metrics essentially penalize models with a lot of explanatory variables, compared with other models that might perform similarly with fewer predictors.

  • There is something called the AIC-BIC dilemma. In a valuable reference on variable selection, Serena Ng writes that the AIC is understood to fall short when it comes to consistent model selection. Hyndman, in another must-read on this topic, writes that because of the heavier penalty, the model chosen by BIC is either the same as that chosen by AIC, or one with fewer terms.

Consistency in discussions of regression methods relates to the large sample properties of the metric or procedure in question. Basically, as the sample size n becomes indefinitely large (goes to infinity) consistent estimates or metrics converge to unbiased values. So the AIC is not in every case consistent, although I’ve read research which suggests that the problem only arises in very unusual setups.

  • In many applications, the AIC and BIC can both be minimum for a particular model, suggesting that this model should be given serious consideration.

Out-of-Sample Regression Metrics

I’m all about out-of-sample (OOS) metrics of adequacy of forecasting models.

It’s too easy to over-parameterize models and come up with good testing on in-sample data.

So I have been impressed with endorsements such as that of Hal Varian of cross-validation.

So, ideally, you partition the sample data into training and test samples. You estimate the predictive model on the training sample, and then calculate various metrics of adequacy on the test sample.

The problem is that often you can’t really afford to give up that much data to the test sample.

So cross-validation is one solution.

In k-fold cross validation, you partition the sample into k parts, estimating the designated regression on data from k-1 of those segments, and using the other or kth segment to test the model. Do this k times and then average or somehow collate the various error metrics. That’s the drill.,

Again, Quick-R suggests useful R code.

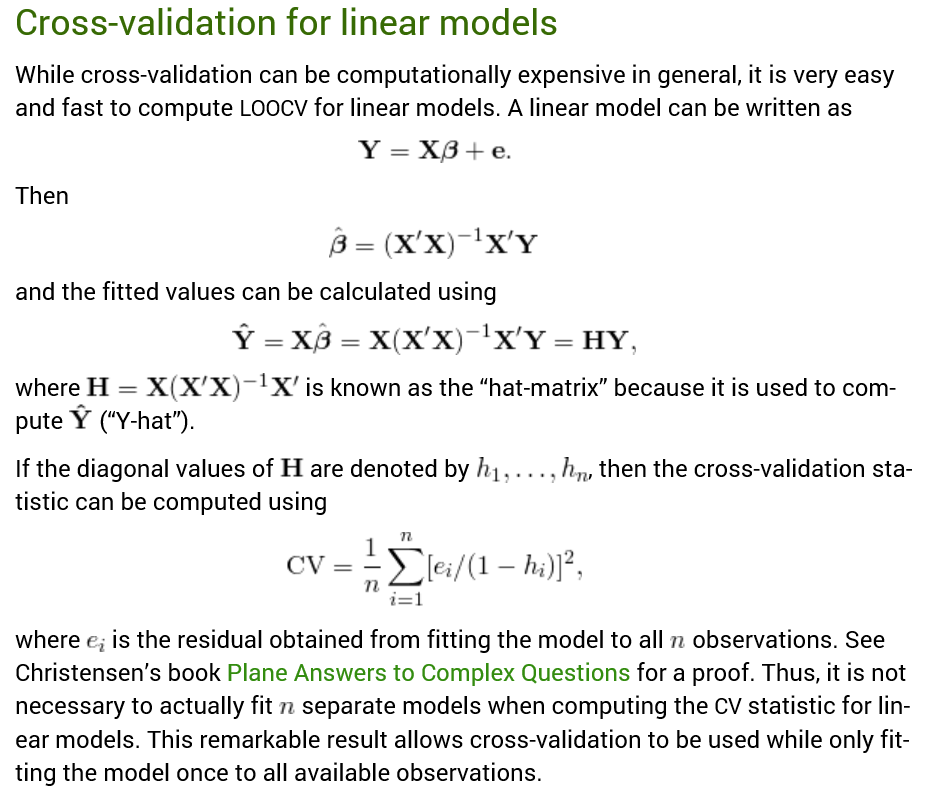
Hyndman also highlights a handy matrix formula to quickly compute the Leave Out One Cross Validation (LOOCV) metric.

LOOCV

LOOCV is not guaranteed to find the true model as the sample size increases, i.e. it is not consistent.

However, k-fold cross-validation can be consistent, if k increases with sample size.

Researchers recently have shown, however, that LOOCV can be consistent for the LASSO.

Selecting regression variables is, indeed, a big topic.

Coming posts will focus on the problem of “many predictors” when the set of predictors is greater in number than the set of observations on the relevant variables.

Top image from Washington Post

Selecting Predictors – the Specification Problem

I find toy examples helpful in exploratory work.

So here is a toy example showing the pitfalls of forward selection of regression variables, in the presence of correlation between predictors. In other words, this is an example of the specification problem.

Suppose the true specification or regression is –

y = 20x1-11x2+10x3

and the observations on x2 and x3 in the available data are correlated.

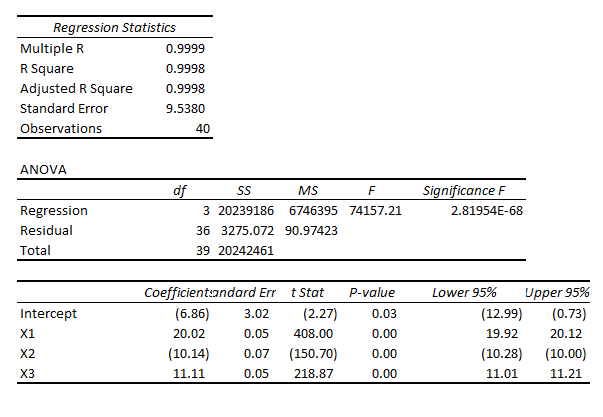
To produce examples of this system, I create columns of random numbers in which the second and third columns are correlated with a correlation coefficient of around 0.6. I also add a random error term with zero mean and constant variance of 10. Then, after generating the data and the error terms, I apply the coefficients indicated above and estimate values for the dependent variable y.

Then, specifying all three variables,  x1, x2, and x3, I estimate regressions which characteristically have coefficient values not far from the (20,-11, 10), such as,

spregThis, of course, is a regression output from Microsoft Excel, where I developed this simple Monte Carlo simulation which has 40 “observations.”

If you were lucky enough to estimate this regression initially, you well might stop and not bother about dropping variables to estimate other potentially competing models.

However, if you start with fewer variables, you encounter a significant difficulty.

Here is the distribution of x2 in repeated estimates of a regression with explanatory variables x1 and x2 –

coeff2

As you can see, the various estimates of the value of this coefficient, whose actual or true value is -11, are wide of the mark. In fact, none of the 1000 estimates in this simulation proved to be statistically significant at standard levels.

Using some flavors of forward regression, therefore, you well might decide to drop x2 in the specification and try including x3.

But you would have the same type of problem in that case, too, since x2 and x3 are correlated.

I sometimes hear people appealing to stability arguments in the face of the specification problem. In other words, they strive to find a stable set of core predictors, believing that if they can do this, they will have controlled as effectively as they can for this problem of omitted variables which are correlated with other variables that are included in the specification.

Selecting Predictors

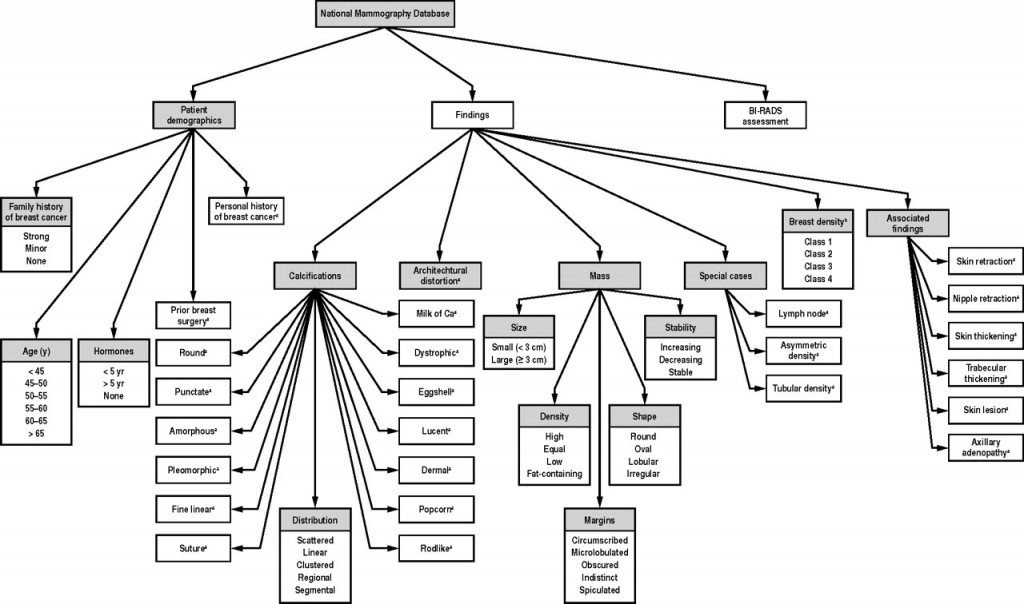
In a recent post on logistic regression, I mentioned research which developed diagnostic tools for breast cancer based on true Big Data parameters – notably 62,219 consecutive mammography records from 48,744 studies in 18,270 patients reported using the Breast Imaging Reporting and Data System (BI-RADS) lexicon and the National Mammography Database format between April 5, 1999 and February 9, 2004.

This research built a logistic regression model with 36 predictors, selected from the following information residing in the National Mammography Database (click to enlarge).

        breastcancertyp               

The question arises – are all these 36 predictors significant? Or what is the optimal model? How does one select the subset of the available predictor variables which really count?

This is the problem of selecting predictors in multivariate analysis – my focus for several posts coming up.

So we have a target variable y and set of potential predictors x={x1,x2,….,xn}. We are interested in discovering a predictive relationship, y=F(x*) where x* is some possibly proper subset of x. Furthermore, we have data comprising m observations on y and x, which in due time we will label with subscripts.

There are a range of solutions to this very real, very practical modeling problem.

Here is my short list.

  1. Forward Selection. Begin with no candidate variables in the model. Select the variable that boosts some goodness-of-fit or predictive metric the most. Traditionally, this has been R-Squared for an in-sample fit. At each step, select the candidate variable that increases the metric the most. Stop adding variables when none of the remaining variables are significant. Note that once a variable enters the model, it cannot be deleted.
  2. Backward Selection. This starts with the superset of potential predictors and eliminates variables which have the lowest score by some metric – traditionally, the t-statistic.
  3. Stepwise regression. This combines backward and forward selection of regressors.
  4. Regularization and Selection by means of the LASSO. Here is the classic article and here is a post, and here is a post in this blog on the LASSO.
  5. Information criteria applied to all possible regressions – pick the best specification by applying the Aikaike Information Criterion (AIC) or Bayesian Information Criterion (BIC) to all possible combinations of regressors. Clearly, this is only possible with a limited number of potential predictors.
  6. Cross-validation or other out-of-sample criteria applied to all possible regressions – Typically, the error metrics on the out-of-sample data cuts are averaged, and the lowest average error model is selected out of all possible combinations of predictors.
  7. Dimension reduction or data shrinkage with principal components. This is a many predictors formulation, whereby it is possible to reduce a large number of predictors to a few principal components which explain most of the variation in the data matrix.
  8. Dimension reduction or data shrinkage with partial least squares. This is similar to the PC approach, but employs a reduction to information from both the set of potential predictors and the dependent or target variable.

There certainly are other candidate techniques, but this is a good list to start with.

Wonderful topic, incidentally. Dives right into the inner sanctum of the mysteries of statistical science as practiced in the real world.

Let me give you the flavor of how hard it is to satisfy the classical criterion for variable selection, arriving at unbiased or consistent estimates of effects of a set of predictors.

And, really, the paradigmatic model is ordinary least squares (OLS) regression in which the predictive function F(.) is linear.

The Specification Problem

The problem few analysts understand is called specification error.

So assume that there is a true model – some linear expression in variables multiplied by their coefficients, possibly with a constant term added.

Then, we have some data to estimate this model.

Now the specification problem is that when predictors are not orthogonal, i.e. when they are correlated, leaving out a variable from the “true” specification imparts a bias to the estimates of coefficients of variables included in the regression.

This complications sequential methods of selecting predictors for the regression.

So in any case I will have comments forthcoming on methods of selecting predictors.

Predictive Models in Medicine and Health – Forecasting Epidemics

I’m interested in everything under the sun relating to forecasting – including sunspots (another future post). But the focus on medicine and health is special for me, since my closest companion, until her untimely death a few years ago, was a physician. So I pay particular attention to details on forecasting in medicine and health, with my conversations from the past somewhat in mind.

There is a major area which needs attention for any kind of completion of a first pass on this subject – forecasting epidemics.

Several major diseases ebb and flow according to a pattern many describe as an epidemic or outbreak – influenza being the most familiar to people in North America.

I’ve already posted on the controversy over Google flu trends, which still seems to be underperforming, judging from the 2013-2014 flu season numbers.

However, combining Google flu trends with other forecasting models, and, possibly, additional data, is reported to produce improved forecasts. In other words, there is information there.

In tropical areas, malaria and dengue fever, both carried by mosquitos, have seasonal patterns and time profiles that health authorities need to anticipate to stock supplies to keep fatalities lower and take other preparatory steps.

Early Warning Systems

The following slide from A Prototype Malaria Forecasting System illustrates the promise of early warning systems, keying off of weather and climatic predictions.

  malaria                     

There is a marked seasonal pattern, in other words, to malaria outbreaks, and this pattern is linked with developments in weather.

Researchers from the Howard Hughes Medical Institute, for example, recently demonstrated that temperatures in a large area of the tropical South Atlantic are directly correlated with the size of malaria outbreaks in India each year – lower sea surface temperatures led to changes in how the atmosphere over the ocean behaved and, over time, led to increased rainfall in India.

Another mosquito-borne disease claiming many thousands of lives each year is dengue fever.

And there is interesting, sophisticated research detailing the development of an early warning system for climate-sensitive disease risk from dengue epidemics in Brazil.

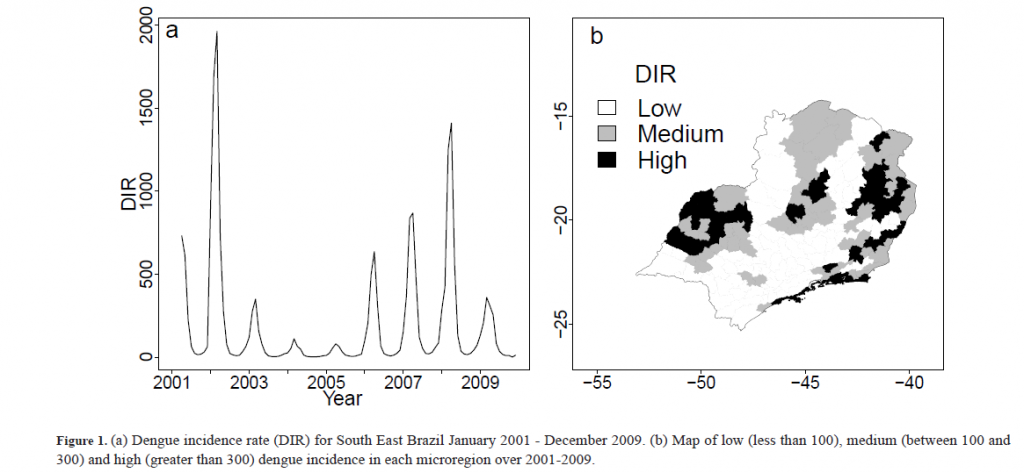
The following exhibits show the strong seasonality of dengue outbreaks, and a revealing mapping application, showing geographic location of high incidence areas.

dengue

This research used out-of-sample data to test the performance of the forecasting model.

The model was compared to a simple conceptual model of current practice, based on dengue cases three months previously. It was found that the developed model including climate, past dengue risk and observed and unobserved confounding factors, enhanced dengue predictions compared to model based on past dengue risk alone.

MERS

The latest global threat, of course, is MERS – or Middle East Respiratory Syndrome, which is a coronavirus, It’s transmission from source areas in Saudi Arabia is pointedly suggested by the following graphic.

MERS

The World Health Organization is, as yet, refusing to declare MERS a global health emergency. Instead, spokesmen for the organization say,

..that much of the recent surge in cases was from large outbreaks of MERS in hospitals in Saudi Arabia, where some emergency rooms are crowded and infection control and prevention are “sub-optimal.” The WHO group called for all hospitals to immediately strengthen infection prevention and control measures. Basic steps, such as washing hands and proper use of gloves and masks, would have an immediate impact on reducing the number of cases..

Millions of people, of course, will travel to Saudi Arabia for Ramadan in July and the hajj in October. Thirty percent of the cases so far diagnosed have resulted in fatalties.

Trend Following in the Stock Market

Noah Smith highlights some amazing research on investor attitudes and behavior in Does trend-chasing explain financial markets?

He cites 2012 research by Greenwood and Schleifer where these researchers consider correlations between investor expectations, as measured by actual investor surveys, and subsequent investor behavior.

A key graphic is the following:

Untitled

This graph shows rather amazingly, as Smith points out..when people say they expect stocks to do well, they actually put money into stocks. How do you find out what investor expectations are? – You ask them – then it’s interesting it’s possible to show that for the most part they follow up attitudes with action.

This discussion caught my eye since Sornette and others attribute the emergence of bubbles to momentum investing or trend-following behavior. Sometimes Sornette reduces this to “herding” or mimicry. I think there are simulation models, combining trend investors with others following a market strategy based on “fundamentals”, which exhibit cumulating and collapsing bubbles.

More on that later, when I track all that down.

For the moment, some research put out by AQR Capital Management in Greenwich CT makes big claims for an investment strategy based on trend following –

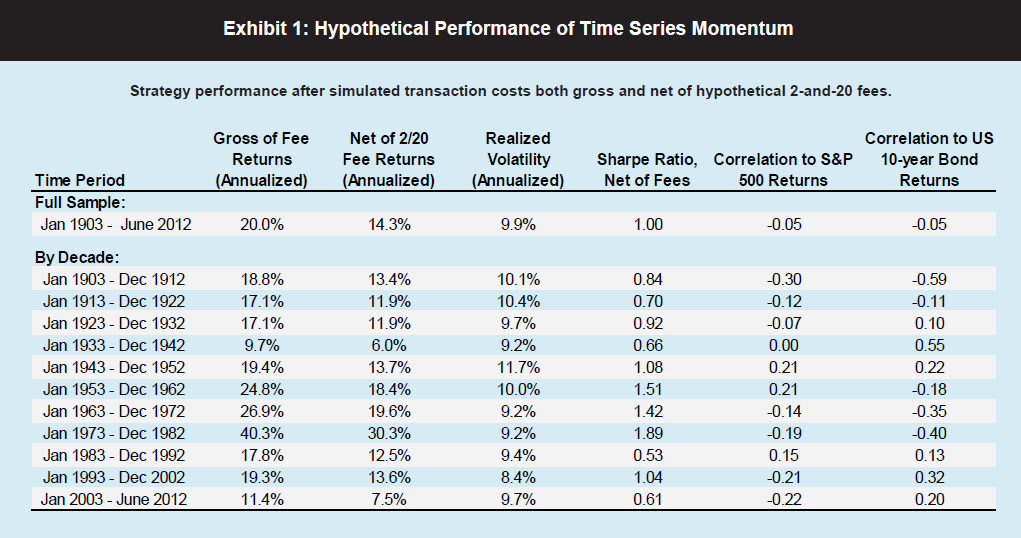
The most basic trend-following strategy is time series momentum – going long markets with recent positive returns and shorting those with recent negative returns. Time series momentum has been profitable on average since 1985 for nearly all equity index futures, fixed income futures, commodity futures, and currency forwards. The strategy explains the strong performance of Managed Futures funds from the late 1980s, when fund returns and index data first becomes available.

This paragraph references research by Moscowitz and Pederson published in the Journal of Financial Economics – an article called Time Series Momentum.

But more spectacularly, this AQR white paper presents this table of results for a trend-following investment strategy decade-by-decade.

Trend

There are caveats to this rather earth-shaking finding, but what it really amounts to for many investors is a recommendation to look into managed futures.

Along those lines there is this video interview, conducted in 2013, with Brian Hurst, one of the authors of the AQR white paper. He reports that recently trending-following investing has run up against “choppy” markets, but holds out hope for the longer term –

http://www.morningstar.com/advisor/v/69423366/will-trends-reverse-for-managed-futures.htm

At the same time, caveat emptor. Bloomberg reported late last year that a lot of investors plunging into managed futures after the Great Recession of 2008-2009 have been disappointed, in many cases, because of the high, unregulated fees and commissions involved in this type of alternative investment.

Sales and new product forecasting in data-limited (real world) contexts