Category Archives: data science

Links – early July 2014

While I dig deeper on the current business outlook and one or two other issues, here are some links for this pre-Fourth of July week.

Predictive Analytics

A bunch of papers about the widsom of smaller, smarter crowds I think the most interesting of these (which I can readily access) is Identifying Expertise to Extract the Wisdom of Crowds which develops a way by eliminating poorly performing individuals from the crowd to improve the group response.

Application of Predictive Analytics in Customer Relationship Management: A Literature Review and Classification From the Proceedings of the Southern Association for Information Systems Conference, Macon, GA, USA March 21st–22nd, 2014. Some minor problems with writing English in the article, but solid contribution.

US and Global Economy

Nouriel Roubini: There’s ‘schizophrenia’ between what stock and bond markets tell you Stocks tell you one thing, but bond yields suggest another. Currently, Roubini is guardedly optimistic – Eurozone breakup risks are receding, US fiscal policy is in better order, and Japan’s aggressively expansionist fiscal policy keeps deflation at bay. On the other hand, there’s the chance of a hard landing in China, trouble in emerging markets, geopolitical risks (Ukraine), and growing nationalist tendencies in Asia (India). Great list, and worthwhile following the links.

The four stages of Chinese growth Michael Pettis was ahead of the game on debt and China in recent years and is now calling for reduction in Chinese growth to around 3-4 percent annually.

Because of rapidly approaching debt constraints China cannot continue what I characterize as the set of “investment overshooting” economic polices for much longer (my instinct suggests perhaps three or four years at most). Under these policies, any growth above some level – and I would argue that GDP growth of anything above 3-4% implies almost automatically that “investment overshooting” policies are still driving growth, at least to some extent – requires an unsustainable increase in debt. Of course the longer this kind of growth continues, the greater the risk that China reaches debt capacity constraints, in which case the country faces a chaotic economic adjustment.

Politics

Is This the Worst Congress Ever? Barry Ritholtz decries the failure of Congress to lower interest rates on student loans, observing –

As of July 1, interest on new student loans rises to 4.66 percent from 3.86 percent last year, with future rates potentially increasing even more. This comes as interest rates on mortgages and other consumer credit hovered near record lows. For a comparison, the rate on the 10-year Treasury is 2.6 percent. Congress could have imposed lower limits on student-loan rates, but chose not to.

This is but one example out of thousands of an inability to perform the basic duties, which includes helping to educate the next generation of leaders and productive citizens. It goes far beyond partisanship; it is a matter of lack of will, intelligence and ability.

Hear, hear.

Climate Change

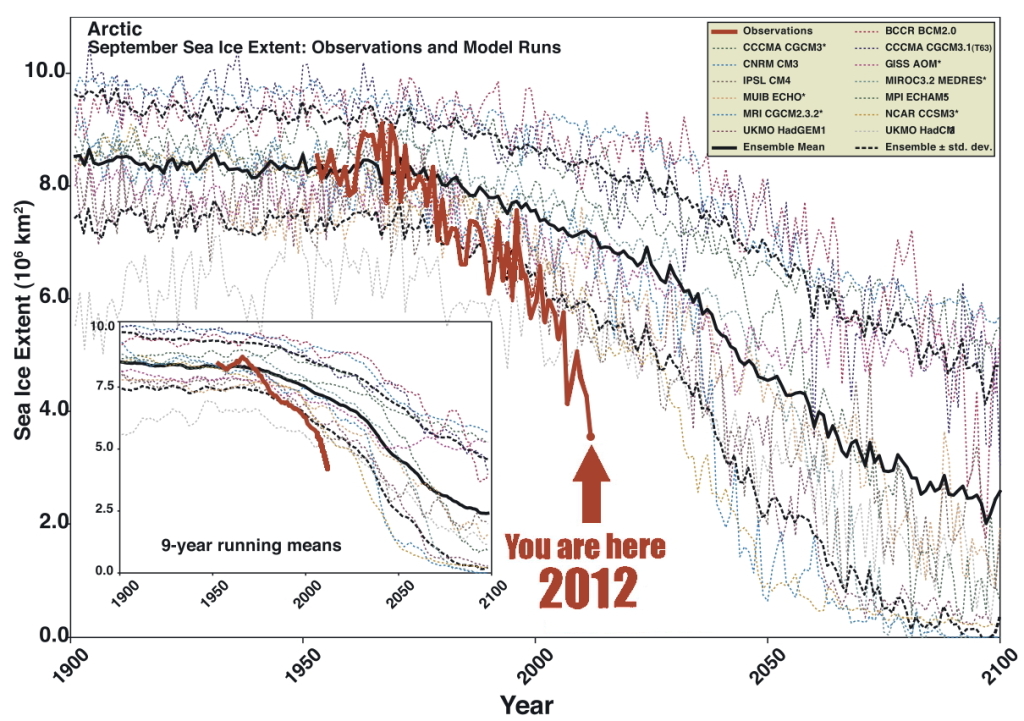
Climate news: Arctic seafloor methane release is double previous estimates, and why that matters This is a ticking time bomb. Article has a great graphic (shown below) which contrasts the projections of loss of Artic sea ice with what actually is happening – underlining that the facts on the ground are outrunning the computer models. Methane has more than an order of magnitude more global warming impact that carbon dioxide, per equivalent mass.

ArcticSeaIce

Dahr Jamail | Former NASA Chief Scientist: “We’re Effectively Taking a Sledgehammer to the Climate System”

I think the sea level rise is the most concerning. Not because it’s the biggest threat, although it is an enormous threat, but because it is the most irrefutable outcome of the ice loss. We can debate about what the loss of sea ice would mean for ocean circulation. We can debate what a warming Arctic means for global and regional climate. But there’s no question what an added meter or two of sea level rise coming from the Greenland ice sheet would mean for coastal regions. It’s very straightforward.

Machine Learning

EG

Computer simulating 13-year-old boy becomes first to pass Turing test A milestone – “Eugene Goostman” fooled more than a third of the Royal Society testers into thinking they were texting with a human being, during a series of five minute keyboard conversations.

The Milky Way Project: Leveraging Citizen Science and Machine Learning to Detect Interstellar Bubbles Combines Big Data and crowdsourcing.

Global Energy Forecasting Competitions

The 2012 Global Energy Forecasting Competition was organized by an IEEE Working Group to connect academic research and industry practice, promote analytics in engineering education, and prepare for forecasting challenges in the smart grid world. Participation was enhanced by alliance with Kaggle for the load forecasting track. There also was a second track for wind power forecasting.

Hundreds of people and many teams participated.

This year’s April/June issue of the International Journal of Forecasting (IJF) features research from the winners.

Before discussing the 2012 results, note that there’s going to be another competition – the Global Energy Forecasting Competition 2014 – scheduled for launch August 15 of this year. Professor Tao Hong, a key organizer, describes the expansion of scope,

GEFCom2014 (www.gefcom.org) will feature three major upgrades: 1) probabilistic forecasts in the form of predicted quantiles; 2) four tracks on demand, price, wind and solar; 3) rolling forecasts with incremental data update on weekly basis.

Results of the 2012 Competition

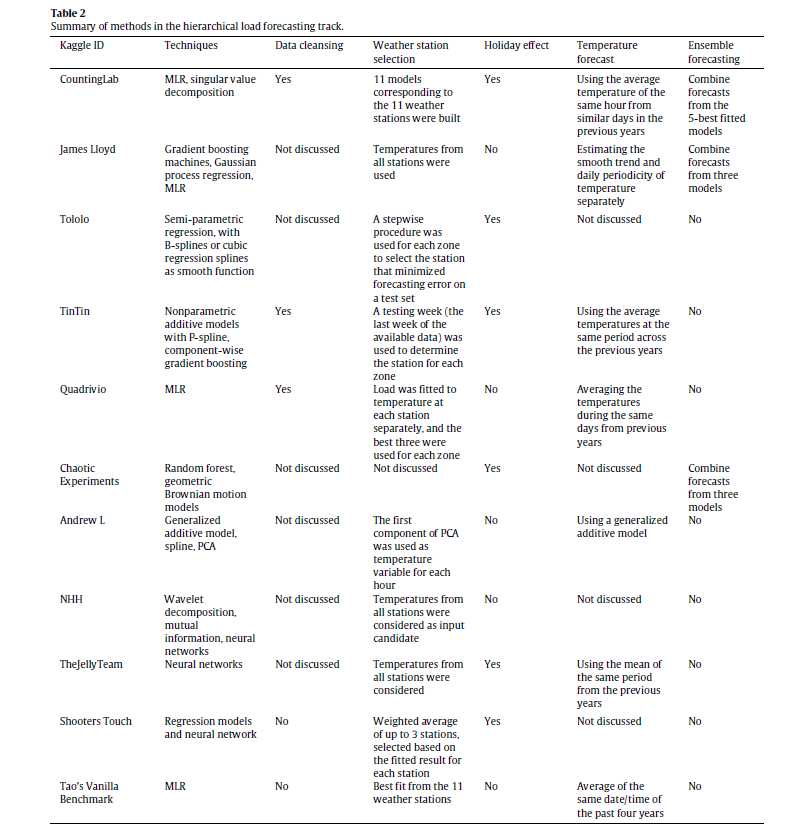
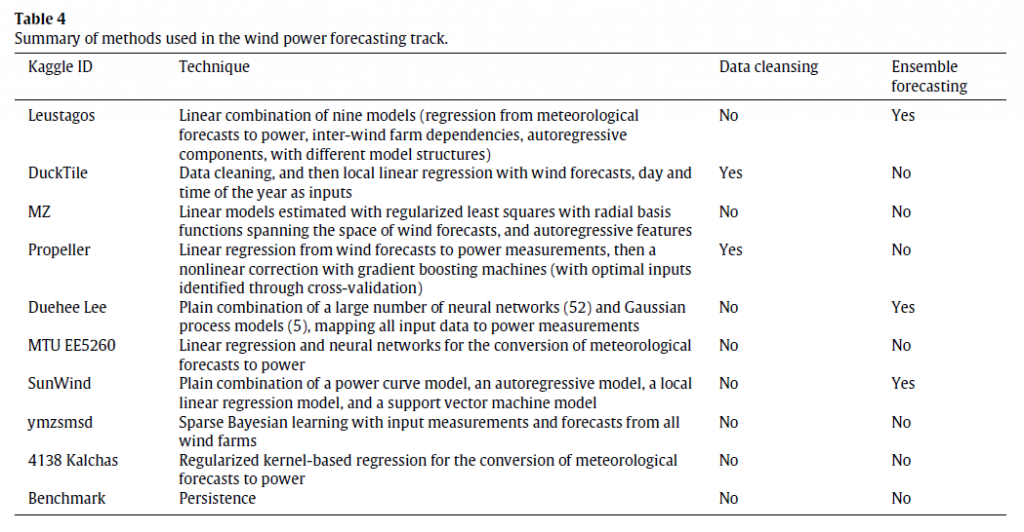
The IJF has an open source article on the competition. This features a couple of interesting tables about the methods in the load and wind power tracks (click to enlarge).

hload

The error metric is WRMSE, standing for weighted root mean square error. One week ahead system (as opposed to zone) forecasts received the greatest weight. The top teams with respect to WRMSE were Quadrivio, CountingLab, James Lloyd, and Tololo (Électricité de France).

wind

The top wind power forecasting teams were Leustagos, DuckTile, and MZ based on overall performance.

Innovations in Electric Power Load Forecasting

The IJF overview article pitches the hierarchical load forecasting problem as follows:

participants were required to backcast and forecast hourly loads (in kW) for a US utility with 20 zones at both the zonal (20 series) and system (sum of the 20 zonal level series) levels, with a total of 21 series. We provided the participants with 4.5 years of hourly load and temperature history data, with eight non-consecutive weeks of load data removed. The backcasting task is to predict the loads of these eight weeks in the history, given actual temperatures, where the participants are permitted to use the entire history to backcast the loads. The forecasting task is to predict the loads for the week immediately after the 4.5 years of history without the actual temperatures or temperature forecasts being given. This is designed to mimic a short term load forecasting job, where the forecaster first builds a model using historical data, then develops the forecasts for the next few days.

One of the top entries is by a team from Électricité de France (EDF) and is written up under the title GEFCom2012: Electric load forecasting and backcasting with semi-parametric models.

This is behind the International Journal of Forecasting paywall at present, but some of the primary techniques can be studied in a slide set by Yannig Goulde.

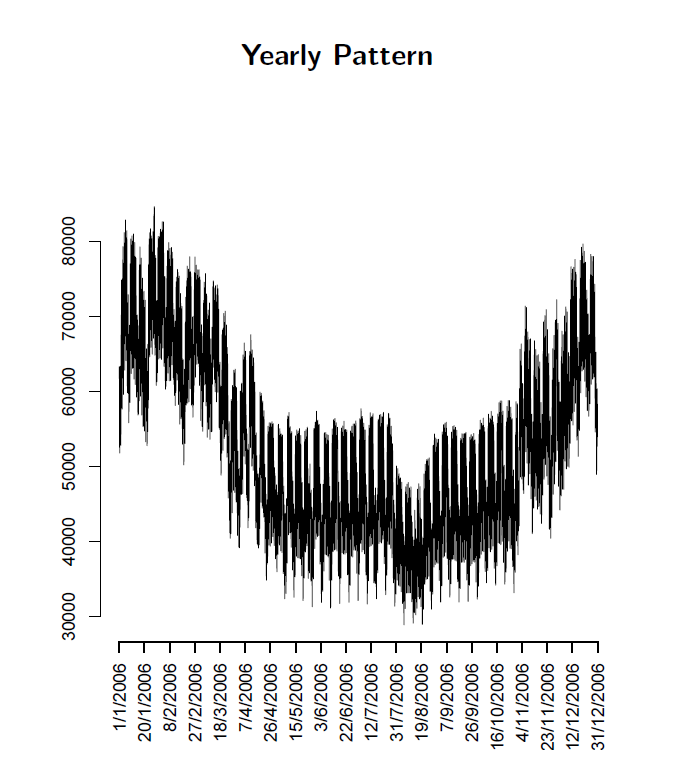
This is an interesting deck because it maps key steps in using semi-parametric models and illustrates real world system power load or demand data, as in this exhibit of annual variation showing the trend over several years.

trend

Or this exhibit showing annual variation.

annual

What intrigues me about the EDF approach in the competition and, apparently, more generally in their actual load forecasting, is the use of splines and knots. I’ve seen this basic approach applied in other time series contexts, for example, to facilitate bagging estimates.

So these competitions seem to provide solid results which can be applied in a real-world setting.

Top image from Triple-Curve

Data Analytics Reverses Grandiose Claims for California’s Monterey Shale Formation

In May, “federal officials” contacted the Los Angeles Times with advance news of a radical revision of estimates of reserves in the Monterey Formation,

Just 600 million barrels of oil can be extracted with existing technology, far below the 13.7 billion barrels once thought recoverable from the jumbled layers of subterranean rock spread across much of Central California, the U.S. Energy Information Administration said.

The LA Times continues with a bizarre story of how “an independent firm under contract with the government” made the mistake of assuming that deposits in the Monterey Shale formation were as easily recoverable as those found in shale formations elsewhere.

There was a lot more too, such as the information that –

The Monterey Shale formation contains about two-thirds of the nation’s shale oil reserves. It had been seen as an enormous bonanza, reducing the nation’s need for foreign oil imports through the use of the latest in extraction techniques, including acid treatments, horizontal drilling and fracking…

The estimate touched off a speculation boom among oil companies.

Well, I’ve combed the web trying to find more about this “mistake,” deciding that, probably, it was the analysis of David Hughes in “Drilling California,” released in March of this year, that turned the trick.

Hughes – a geoscientist working decades with the Geological Survey of Canada – utterly demolishes studies which project 15 billion barrels in reserve in the Monterey Formation. And he does this by analyzing an extensive database (Big Data) of wells drilled in the Formation.

The video below is well worth the twenty minutes or so. It’s a tour de force of data analysis, but it takes a little patience at points.

First, though, check out a sample of the hype associated with all this, before the overblown estimates were retracted.

Monterey Shale: California’s Trillion-Dollar Energy Source

Here’s a video on Hughes’ research in Drilling California

Finally, here’s the head of the US Energy Information Agency in December 2013, discussing a preliminary release of figures in the 2014 Energy Outlook, also released in May 2014.

Natural Gas 2014 Projections by the EIA’s Adam Sieminski

One question is whether the EIA projections eventually will be acknowledged to be affected by a revision of reserves for a formation that is thought to contain two thirds of all shale oil in the US.

Machine Learning and Next Week

Here is a nice list of machine learning algorithms. Remember, too, that they come in two or three flavors – supervised, unsupervised, semi-supervised, and reinforcement learning.

MachineLearning

An objective of mine is to cover each of these techniques with an example or two, with special reference to their relevance to forecasting.

I got this list, incidentally, from an interesting Australian blog Machine Learning Mastery.

The Coming Week

Aligned with this marvelous list, I’ve decided to focus on robotics for a few blog posts coming up.

This is definitely exploratory, but recently I heard a presentation by an economist from the National Association of Manufacturers (NAM) on manufacturing productivity, among other topics. Apparently, robotics is definitely happening on the shop floor – especially in the automobile industry, but also in semiconductors and electronics assembly.

And, as mankind pushes the envelope, drilling for oil in deeper and deeper areas offshore and handling more and more radioactive and toxic material, the need for significant robotic assistance is definitely growing.

I’m looking for indices and how to construct them – how to guage the line between merely automatic and what we might more properly call robotic.

Dimension Reduction With Principal Components

The method of principal components regression has achieved new prominence in machine learning, data reduction, and forecasting over the last decade.

It’s highly relevant in the era of Big Data, because it facilitates analyzing “fat” or wide databases. Fat databases have more predictors than observations. So you might have ten years of monthly data on sales, but 1000 potential predictors, meaning your database would be 120 by 1001 – obeying here the convention of stating row depth first and the number of columns second.

After a brief discussion of these Big Data applications and some elements of principal components, I illustrate dimension reduction with a violent crime database from the UC Irvine Machine Learning Repository.

Dynamic Factor Models

In terms of forecasting, a lot of research over the past decade has focused on “many predictors” and reducing the dimensionality of “fat” databases. Key names are James Stock and Mark Watson (see also) and Bai.

Stock and Watson have a white paper that has been updated several times, which can be found in PDF format at this link

stock watson generalized shrinkage June _2012.pdf

They write in the June 2012 update,

We find that, for most macroeconomic time series, among linear estimators the DFM forecasts make efficient use of the information in the many predictors by using only a small number of estimated factors. These series include measures of real economic activity and some other central macroeconomic series, including some interest rates and monetary variables. For these series, the shrinkage methods with estimated parameters fail to provide mean squared error improvements over the DFM. For a small number of series, the shrinkage forecasts improve upon DFM forecasts, at least at some horizons and by some measures, and for these few series, the DFM might not be an adequate approximation. Finally, none of the methods considered here help much for series that are notoriously difficult to forecast, such as exchange rates, stock prices, or price inflation.

Here DFM refers to dynamic factor models, essentially principal components models which utilize PC’s for lagged data.

Note also that this type of autoregressive or classical time series approach does not work well, in Stock and Watson’s judgment, for “series that are notoriously difficult to forecast, such as exchange rates, stock prices, or price inflation.”

Presumably, these series are closer to being random walks in some configuration.

Intermediate Level Concepts

Essentially, you can take any bundle of data and compute the principal components. If you mean-center and (in most cases) standardize the data, the principal components divide up the variance of this data, based on the size of their associated eigenvalues. The associated eigenvectors can be used to transform the data into an equivalent and same size set of orthogonal vectors. Really, the principal components operate to change the basis of the data, transforming it into an equivalent representation, but one in which all the variables have zero correlation with each other.

The Wikipaedia article on principal components is useful, but there is no getting around the fact that principal components can only really be understood with matrix algebra.

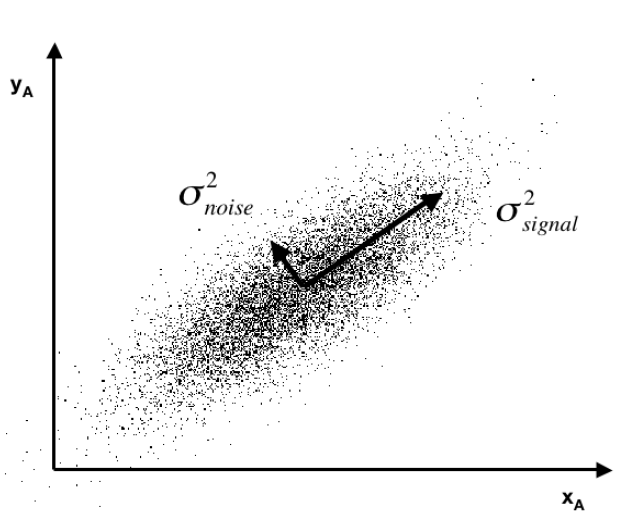
Often you see a diagram, such as the one below, showing a cloud of points distributed around a line passing through the origin of a coordinate system, but at an acute angle to those coordinates.

pcpic

This illustrates dimensionality reduction with principal components. If we express all these points in terms of this rotated set of coordinates, one of these coordinates – the signal – captures most of the variation in the data. Projections of the datapoints onto the second principal component, therefore, account for much less variance.

Principal component regression characteristically specifies only the first few principal components in the regression equation, knowing that, typically, these explain the largest portion of the variance in the data.

An Application to Crime Data

Looking for some non-macroeconomic data to illustrate principal components (PC) regression, I found the Communities and Crime Data Set in the University of California at Irving Machine Learning Repository.

The data do not illustrate “many predictors” in the sense of more predictors than observations.

Here, the crime and other data comprise 128 variables, including a violent crime variable, which are collated for 1994 cities. That is, there are more observations than predictors.

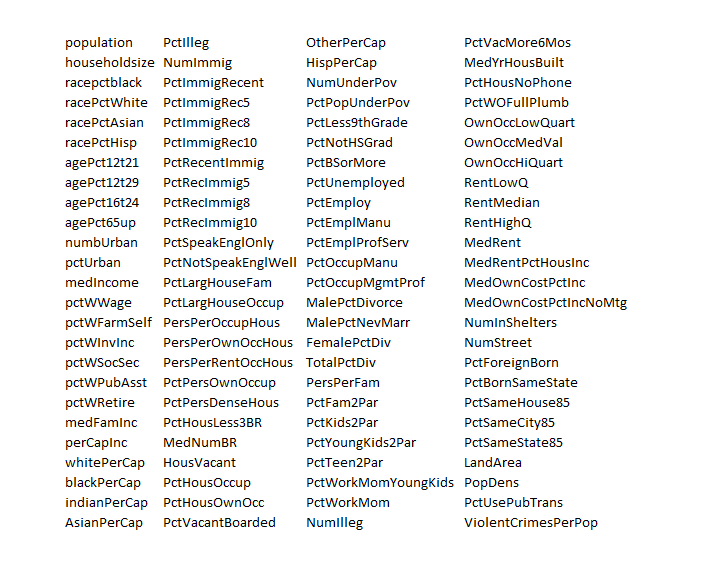
The variables included in the dataset involve the community, such as the percent of the population considered urban, and the median family income, and involving law enforcement, such as per capita number of police officers, and percent of officers assigned to drug units. The per capita violent crimes variable was calculated using population and the sum of crime variables considered violent crimes in the United States: murder, rape, robbery, and assault.

I standardize the data, dropping variables with a lot of missing values. That leaves me 100 variables, including the violent crime metric.

This table gives you a flavor of the variables included – you have to interpret the abbreviations

crime

I developed a comparison of OLS regression with principal components regression, finding that principal component regression can outperform OLS in out-of-sample predictions of violent crimes per capita.

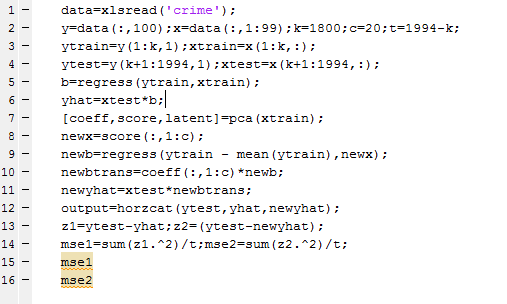
The Matlab program to carry out this analysis is as follows:

Matalbp

So I used a training set of 1800 cities, and developed OLS and PC regressions to predict violent crime per capita in the remaining 194 cities.  I calculate the  principal components (coeff) from a training set (xtrain) comprised of the first 1800 cities. Then, I select the first twenty pc’s  and translate them back to weightings on all 99 variables for application to the test set (xtest). I also calculate OLS regression coefficients on xtrain.

The mean square prediction error (mse1) of the OLS regression was 0.35 and the mean square prediction error (mse2) of the PC regression was 0.34 – really a marginal difference but large enough to make the point.

What’s really interesting is that I had to use the first twenty (20) principal components to achieve this improvement. Thus, this violent crime database has a quite diverse characteristic, compared with many socioeconomic datasets I have seen, where, as noted above, the first few principal components explain most of the variation in the data.

This method – PC regression – is especially good when there are predictors which are closely correlated (“multicollinearity”) as often is the case with market research surveys of consumer attitudes and income and wealth variables.

The bottom line here is that principal compoments can facilitate data reduction or regression regularization. Quite often, this can improve the prediction capabilities of a regression, when compared with an OLS regression using all the variables. The PC regression assigns higher weights to the most important predictors, in effect performing a kind of variable selection – although the coefficients or pc’s may not zero out variables per se.

I am continuing to work on this data with an eye to implementing k-fold cross-validation as a way of estimating the optimal number of principal components which should be used in the PC regressions.

Predictive Models in Medicine and Health – Forecasting Epidemics

I’m interested in everything under the sun relating to forecasting – including sunspots (another future post). But the focus on medicine and health is special for me, since my closest companion, until her untimely death a few years ago, was a physician. So I pay particular attention to details on forecasting in medicine and health, with my conversations from the past somewhat in mind.

There is a major area which needs attention for any kind of completion of a first pass on this subject – forecasting epidemics.

Several major diseases ebb and flow according to a pattern many describe as an epidemic or outbreak – influenza being the most familiar to people in North America.

I’ve already posted on the controversy over Google flu trends, which still seems to be underperforming, judging from the 2013-2014 flu season numbers.

However, combining Google flu trends with other forecasting models, and, possibly, additional data, is reported to produce improved forecasts. In other words, there is information there.

In tropical areas, malaria and dengue fever, both carried by mosquitos, have seasonal patterns and time profiles that health authorities need to anticipate to stock supplies to keep fatalities lower and take other preparatory steps.

Early Warning Systems

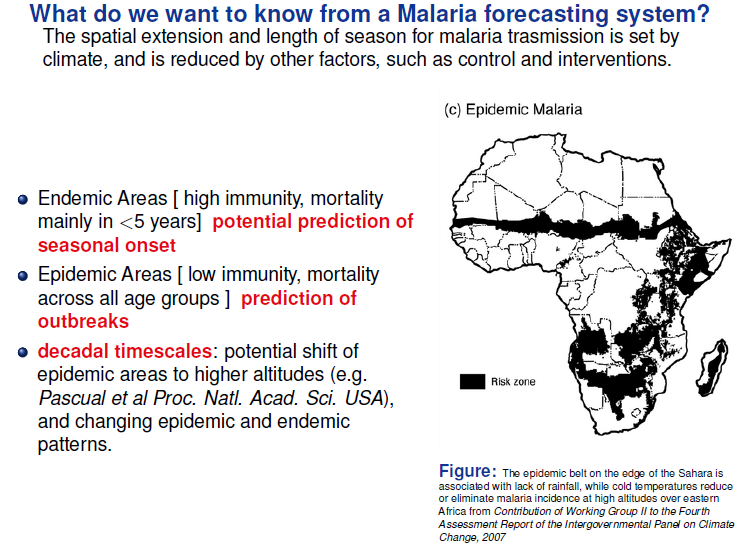
The following slide from A Prototype Malaria Forecasting System illustrates the promise of early warning systems, keying off of weather and climatic predictions.

  malaria                     

There is a marked seasonal pattern, in other words, to malaria outbreaks, and this pattern is linked with developments in weather.

Researchers from the Howard Hughes Medical Institute, for example, recently demonstrated that temperatures in a large area of the tropical South Atlantic are directly correlated with the size of malaria outbreaks in India each year – lower sea surface temperatures led to changes in how the atmosphere over the ocean behaved and, over time, led to increased rainfall in India.

Another mosquito-borne disease claiming many thousands of lives each year is dengue fever.

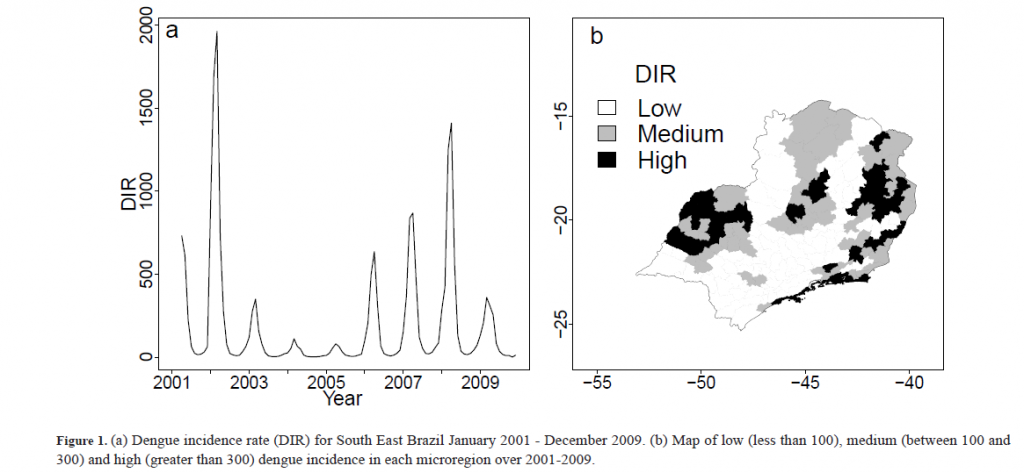
And there is interesting, sophisticated research detailing the development of an early warning system for climate-sensitive disease risk from dengue epidemics in Brazil.

The following exhibits show the strong seasonality of dengue outbreaks, and a revealing mapping application, showing geographic location of high incidence areas.

dengue

This research used out-of-sample data to test the performance of the forecasting model.

The model was compared to a simple conceptual model of current practice, based on dengue cases three months previously. It was found that the developed model including climate, past dengue risk and observed and unobserved confounding factors, enhanced dengue predictions compared to model based on past dengue risk alone.

MERS

The latest global threat, of course, is MERS – or Middle East Respiratory Syndrome, which is a coronavirus, It’s transmission from source areas in Saudi Arabia is pointedly suggested by the following graphic.

MERS

The World Health Organization is, as yet, refusing to declare MERS a global health emergency. Instead, spokesmen for the organization say,

..that much of the recent surge in cases was from large outbreaks of MERS in hospitals in Saudi Arabia, where some emergency rooms are crowded and infection control and prevention are “sub-optimal.” The WHO group called for all hospitals to immediately strengthen infection prevention and control measures. Basic steps, such as washing hands and proper use of gloves and masks, would have an immediate impact on reducing the number of cases..

Millions of people, of course, will travel to Saudi Arabia for Ramadan in July and the hajj in October. Thirty percent of the cases so far diagnosed have resulted in fatalties.

Predicting the Market Over Short Time Horizons

Google “average time a stock is held.” You will come up with figures that typically run around 20 seconds. High frequency trades (HFT) dominate trading volume on the US exchanges.

All of which suggests the focus on the predictability of stock returns needs to position more on intervals lasting seconds or minutes, rather than daily, monthly, or longer trading periods.

So, it’s logical that Michael Rechenthin, a newly minted Iowa Ph.D., and Nick Street, a Professor of Management, are getting media face time from research which purportedly demonstrates the existence of predictable short-term trends in the market (see Using conditional probability to identify trends in intra-day high-frequency equity pricing).

Here’s the abstract –

By examining the conditional probabilities of price movements in a popular US stock over different high-frequency intra-day timespans, varying levels of trend predictability are identified. This study demonstrates the existence of predictable short-term trends in the market; understanding the probability of price movement can be useful to high-frequency traders. Price movement was examined in trade-by-trade (tick) data along with temporal timespans between 1 s to 30 min for 52 one-week periods for one highly-traded stock. We hypothesize that much of the initial predictability of trade-by-trade (tick) data is due to traditional market dynamics, or the bouncing of the price between the stock’s bid and ask. Only after timespans of between 5 to 10 s does this cease to explain the predictability; after this timespan, two consecutive movements in the same direction occur with higher probability than that of movements in the opposite direction. This pattern holds up to a one-minute interval, after which the strength of the pattern weakens.

The study examined price movements of the exchange traded fund SPY, during 2005, finding that

.. price movements can be predicted with a better than 50-50 accuracy for anywhere up to one minute after the stock leaves the confines of its bid-ask spread. Probabilities continue to be significant until about five minutes after it leaves the spread. By 30 minutes, the predictability window has closed.

Of course, the challenges of generalization in this world of seconds and minutes is tremendous. Perhaps, for example, the patterns the authors identify are confined to the year of the study. Without any theoretical basis, brute force generalization means riffling through additional years of 31.5 million seconds each.

Then, there are the milliseconds, and the recent blockbuster written by Michael Lewis – Flash Boys: A Wall Street Revolt.

I’m on track for reading this book for a bookclub to which I belong.

As I understand it, Lewis, who is one of my favorite financial writers, has uncovered a story whereby high frequency traders, operating with optical fiber connections to the New York Stock Exchange, sometimes being geographically as proximate as possible, can exploit more conventional trading – basically buying a stock after you have put in a buy order, but before your transaction closes, thus raising your price if you made a market order.

MLewis

The LA Times  has a nice review of the book and ran the above photo of Lewis.

Bootstrapping

I’ve been reading about the bootstrap. I’m interested in bagging or bootstrap aggregation.

The primary task of a statistician is to summarize a sample based study and generalize the finding to the parent population in a scientific manner..

The purpose of a sample study is to gather information cheaply in a timely fashion. The idea behind bootstrap is to use the data of a sample study at hand as a “surrogate population”, for the purpose of approximating the sampling distribution of a statistic; i.e. to resample (with replacement) from the sample data at hand and create a large number of “phantom samples” known as bootstrap samples. The sample summary is then computed on each of the bootstrap samples (usually a few thousand). A histogram of the set of these computed values is referred to as the bootstrap distribution of the statistic.

These well-phrased quotes come from Bootstrap: A Statistical Method by Singh and Xie.

OK, so let’s do a simple example.

Suppose we generate ten random numbers, drawn independently from a Gaussian or normal distribution with a mean of 10 and standard deviation of 1.

vector

This sample has an average of 9.7684. We would like to somehow project a 95 percent confidence interval around this sample mean, to understand how close it is to the population average.

So we bootstrap this sample, drawing 10,000 samples of ten numbers with replacement.

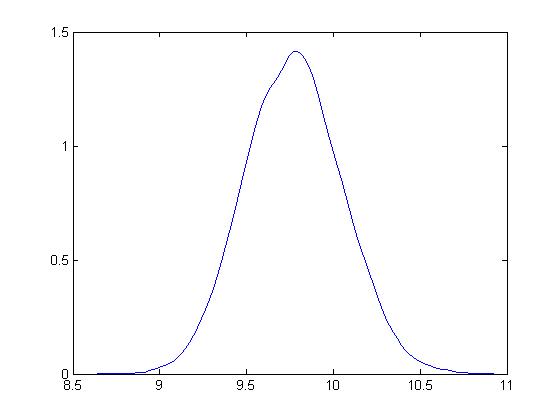
Here is the distribution of bootstrapped means of these samples.

bootstrapdist

The mean is 9.7713.

Based on the method of percentiles, the 95 percent confidence interval for the sample mean is between 9.32 and 10.23, which, as you note, correctly includes the true mean for the population of 10.

Bias-correction is another primary use of the bootstrap. For techies, there is a great paper from the old Bell Labs called A Real Example That Illustrates Properties of Bootstrap Bias Correction. Unfortunately, you have to pay a fee to the American Statistical Association to read it – I have not found a free copy on the Web.

In any case, all this is interesting and a little amazing, but what we really want to do is look at the bootstrap in developing forecasting models.

Bootstrapping Regressions

There are several methods for using bootstrapping in connection with regressions.

One is illustrated in a blog post from earlier this year. I treated the explanatory variables as variables which have a degree of randomness in them, and resampled the values of the dependent variable and explanatory variables 200 times, finding that doing so “brought up” the coefficient estimates, moving them closer to the underlying actuals used in constructing or simulating them.

This method works nicely with hetereoskedastic errors, as long as there is no autocorrelation.

Another method takes the explanatory variables as fixed, and resamples only the residuals of the regression.

Bootstrapping Time Series Models

The underlying assumptions for the standard bootstrap include independent and random draws.

This can be violated in time series when there are time dependencies.

Of course, it is necessary to transform a nonstationary time series to a stationary series to even consider bootstrapping.

But even with a time series that fluctuates around a constant mean, there can be autocorrelation.

So here is where the block bootstrap can come into play. Let me cite this study – conducted under the auspices of the Cowles Foundation (click on link) – which discusses the asymptotic properties of the block bootstrap and provides key references.

There are many variants, but the basic idea is to sample blocks of a time series, probably overlapping blocks. So if a time series yt  has n elements, y1,..,yn and the block length is m, there are n-m blocks, and it is necessary to use n/m of these blocks to construct another time series of length n. Issues arise when m is not a perfect divisor of n, and it is necessary to develop special rules for handling the final values of the simulated series in that case.

Block bootstrapping is used by Bergmeir, Hyndman, and Benıtez in bagging exponential smoothing forecasts.

How Good Are Bootstrapped Estimates?

Consistency in statistics or econometrics involves whether or not an estimate or measure converges to an unbiased value as sample size increases – or basically goes to infinity.

This is a huge question with bootstrapped statistics, and there are new findings all the time.

Interestingly, sometimes bootstrapped estimates can actually converge faster to the appropriate unbiased values than can be achieved simply by increasing sample size.

And some metrics really do not lend themselves to bootstrapping.

Also some samples are inappropriate for bootstrapping.  Gelman, for example, writes about the problem of “separation” in a sample

[In} ..an example of a poll from the 1964 U.S. presidential election campaign, … none of the black respondents in the sample supported the Republican candidate, Barry Goldwater… If zero black respondents in the sample supported Barry Goldwater, then zero black respondents in any bootstrap sample will support Goldwater as well. Indeed, bootstrapping can exacerbate separation by turning near-separation into complete separation for some samples. For example, consider a survey in which only one or two of the black respondents support the Republican candidate. The resulting logistic regression estimate will be noisy but it will be finite.

Here is a video doing a good job of covering the bases on boostrapping. I suggest sampling portions of it first. It’s quite good, but it may seem too much going into it.

More on Automatic Forecasting Packages – Autobox Gold Price Forecasts

Yesterday, my post discussed the statistical programming language R and Rob Hyndman’s automatic forecasting package, written in R – facts about this program, how to download it, and an application to gold prices.

In passing, I said I liked Hyndman’s disclosure of his methods in his R package and “contrasted” that with leading competitors in the automatic forecasting market space –notably Forecast Pro and Autobox.

This roused Tom Reilly, currently Senior Vice-President and CEO of Automatic Forecast Systems – the company behind Autobox.

62_tom

Reilly, shown above, wrote  –

You say that Autobox doesn’t disclose its methods.  I think that this statement is unfair to Autobox.  SAS tried this (Mike Gilliland) on the cover of his book showing something purporting to a black box.  We are a white box.  I just downloaded the GOLD prices and recreated the problem and ran it. If you open details.htm it walks you through all the steps of the modeling process.  Take a look and let me know your thoughts.  Much appreciated!

AutoBox Gold Price Forecast

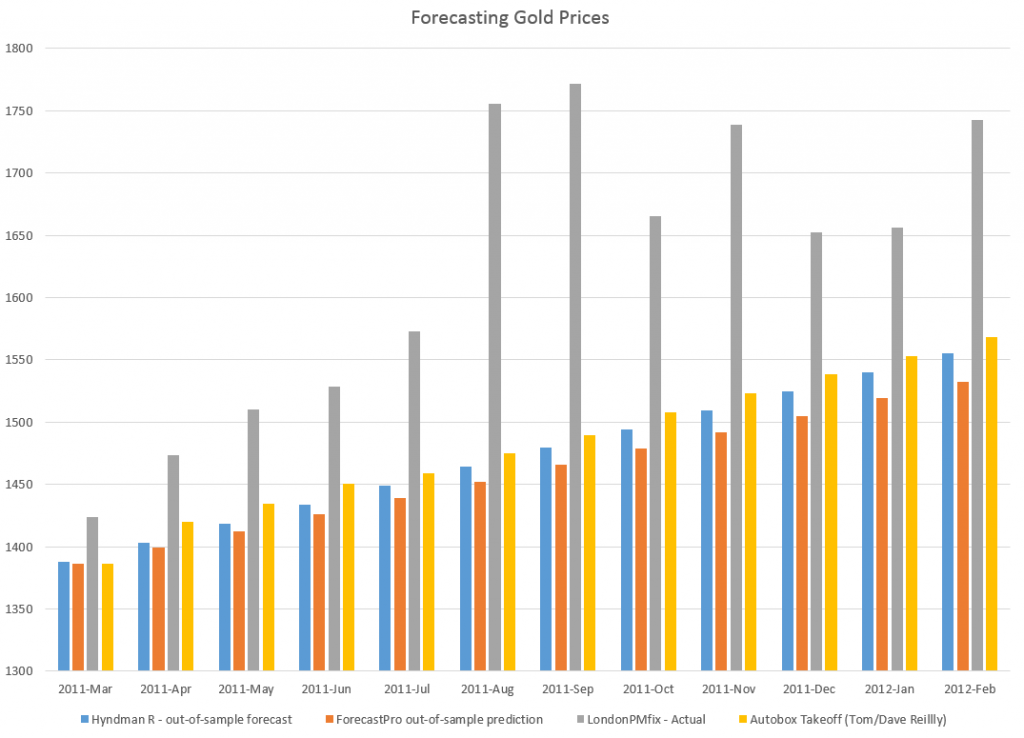
First, disregarding the issue of transparency for a moment, let’s look at a comparison of forecasts for this monthly gold price series (London PM fix).

A picture tells the story (click to enlarge).

ABFPHcomp

So, for this data, 2007 to early 2011, Autobox dominates. That is, all forecasts are less than the respective actual monthly average gold prices. Thus, being linear, if one forecast method is more inaccurate than another for one month, that method is less accurate than the forecasts generated by this other approach for the entire forecast horizon.

I guess this does not surprise me. Autobox has been a serious contender in the M-competitions, for example, usually running just behind or perhaps just ahead of Forecast Pro, depending on the accuracy metric and forecast horizon. (For a history of these “accuracy contests” see Markridakis and Hibon’s article on M3).

And, of course, this is just one of many possible forecasts that can be developed with this time series, taking off from various ending points in the historic record.

The Issue of Transparency

In connection with all this, I also talked with Dave Reilly, a founding principal of Autobox, shown below.

DaveReilly

Among other things, we went over the “printout” Tom Reilly sent, which details the steps in the estimation of a final time series model to predict these gold prices.

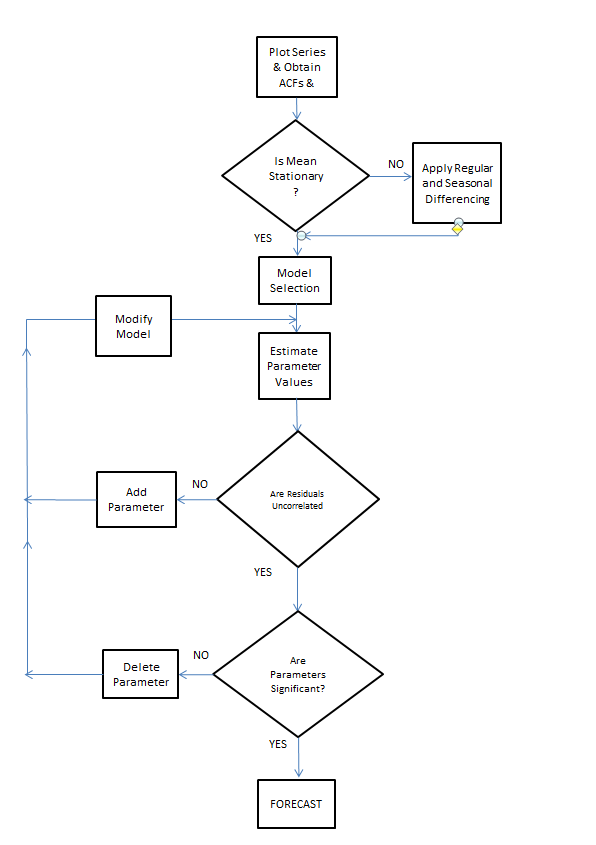
A blog post on the Autobox site is especially pertinent, called Build or Make your own ARIMA forecasting model? This discussion contains two flow charts which describe the process of building a time series model, I reproduce here, by kind permission.

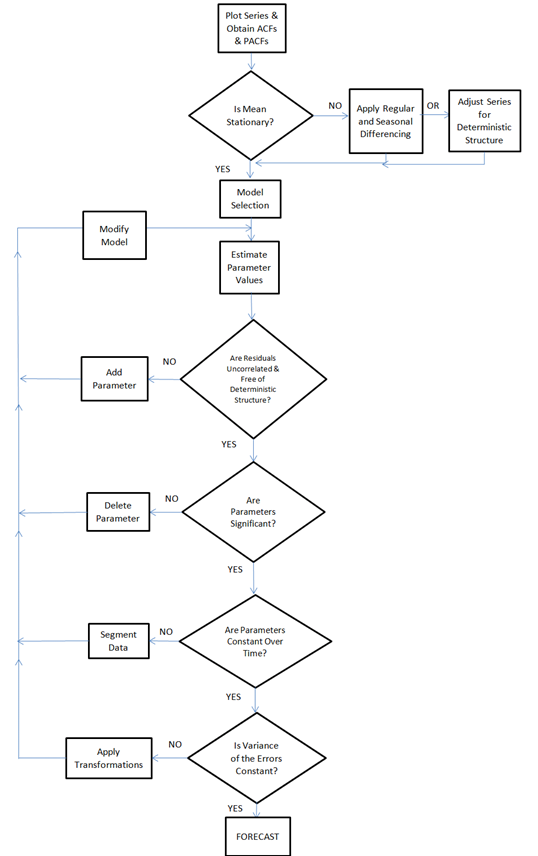
The first provides a plain vanilla description of Box-Jenkins modeling.

Rflowchart1

The second flowchart adds steps revised for additions by Tsay, Tiao, Bell, Reilly & Gregory Chow (ie chow test).

Rflowchart2

Both start with plotting the time series to be analyzed and calculating the autocorrelation and partial autocorrelation functions.

But then additional boxes are added for accounting for and removing “deterministic” elements in the time series and checking for the constancy of parameters over the sample.

The analysis run Tom Reilly sent suggests to me that “deterministic” elements can mean outliers.

Dave Reilly made an interesting point about outliers. He suggested that the true autocorrelation structure can be masked or dampened in the presence of outliers. So the tactic of specifying an intervention variable in the various trial models can facilitate identification of autoregressive lags which otherwise might appear to be statistically not significant.

Really, the point of Autobox model development is to “create an error process free of structure.” That a Dave Reilly quote.

So, bottom line, Autobox’s general methods are well-documented. There is no problem of transparency with respect to the steps in the recommended analysis in the program. True, behind the scenes, comparisons are being made and alternatives are being rejected which do not make it to the printout of results. But you can argue that any commercial software has to keep some kernel of its processes proprietary.

I expect to be writing more about Autobox. It has a good track record in various forecasting competitions and currently has a management team that actively solicits forecasting challenges.

Three Pass Regression Filter – New Data Reduction Method

Malcolm Gladwell’s 10,000 hour rule (for cognitive mastery) is sort of an inspiration for me. I picked forecasting as my field for “cognitive mastery,” as dubious as that might be. When I am directly engaged in an assignment, at some point or other, I feel the need for immersion in the data and in estimations of all types. This blog, on the other hand, represents an effort to survey and, to some extent, get control of new “tools” – at least in a first pass. Then, when I have problems at hand, I can try some of these new techniques.

Ok, so these remarks preface what you might call the humility of my approach to new methods currently being innovated. I am not putting myself on a level with the innovators, for example. At the same time, it’s important to retain perspective and not drop a critical stance.

The Working Paper and Article in the Journal of Finance

Probably one of the most widely-cited recent working papers is Kelly and Pruitt’s three pass regression filter (3PRF). The authors, shown above, are with the University of Chicago, Booth School of Business and the Federal Reserve Board of Governors, respectively, and judging from the extensive revisions to the 2011 version, they had a bit of trouble getting this one out of the skunk works.

Recently, however, Kelly and Pruit published an important article in the prestigious Journal of Finance called Market Expectations in the Cross-Section of Present Values. This article applies a version of the three pass regression filter to show that returns and cash flow growth for the aggregate U.S. stock market are highly and robustly predictable.

I learned of a published application of the 3PRF from Francis X. Dieblod’s blog, No Hesitations, where Diebold – one of the most published authorities on forecasting – writes

Recent interesting work, moreover, extends PLS in powerful ways, as with the Kelly-Pruitt three-pass regression filter and its amazing apparent success in predicting aggregate equity returns.

What is the 3PRF?

The working paper from the Booth School of Business cited at a couple of points above describes what might be cast as a generalization of partial least squares (PLS). Certainly, the focus in the 3PRF and PLS is on using latent variables to predict some target.

I’m not sure, though, whether 3PRF is, in fact, more of a heuristic, rather than an algorithm.

What I mean is that the three pass regression filter involves a procedure, described below.

(click to enlarge).
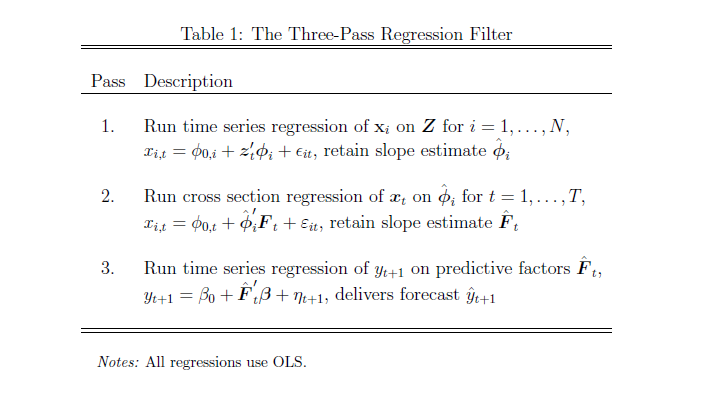
3PRFprocedure

Here’s the basic idea –

Suppose you have a large number of potential regressors xi ε X, i=1,..,N. In fact, it may be impossible to calculate an OLS regression, since N > T the number of observations or time periods.

Furthermore, you have proxies zj ε  Z, I = 1,..,L – where L is significantly less than the number of observations T. These proxies could be the first several principal components of the data matrix, or underlying drivers which theory proposes for the situation. The authors even suggest an automatic procedure for generating proxies in the paper.

And, finally, there is the target variable yt which is a column vector with T observations.

Latent factors in a matrix F drive both the proxies in Z and the predictors in X. Based on macroeconomic research into dynamic factors, there might be only a few of these latent factors – just as typically only a few principal components account for the bulk of variation in a data matrix.

Now here is a key point – as Kelly and Pruitt present the 3PRF, it is a leading indicator approach when applied to forecasting macroeconomic variables such as GDP, inflation, or the like. Thus, the time index for yt ranges from 2,3,…T+1, while the time indices of all X and Z variables and the factors range from 1,2,..T. This means really that all the x and z variables are potentially leading indicators, since they map conditions from an earlier time onto values of a target variable at a subsequent time.

What Table 1 above tells us to do is –

  1. Run an ordinary least square (OLS) regression of the xi      in X onto the zj in X, where T ranges from 1 to T and there are      N variables in X and L << T variables in Z. So, in the example      discussed below, we concoct a spreadsheet example with 3 variables in Z,      or three proxies, and 10 predictor variables xi in X (I could      have used 50, but I wanted to see whether the method worked with lower      dimensionality). The example assumes 40 periods, so t = 1,…,40. There will      be 40 different sets of coefficients of the zj as a result of      estimating these regressions with 40 matched constant terms.
  2. OK, then we take this stack of estimates of      coefficients of the zj and their associated constants and map      them onto the cross sectional slices of X for t = 1,..,T. This means that,      at each period t, the values of the cross-section. xi,t, are      taken as the dependent variable, and the independent variables are the 40      sets of coefficients (plus constant) estimated in the previous step for      period t become the predictors.
  3. Finally, we extract the estimate of the factor loadings      which results, and use these in a regression with target variable as the      dependent variable.

This is tricky, and I have questions about the symbolism in Kelly and Pruitt’s papers, but the procedure they describe does work. There is some Matlab code here alongside the reference to this paper in Professor Kelly’s research.

At the same time, all this can be short-circuited (if you have adequate data without a lot of missing values, apparently) by a single humungous formula –
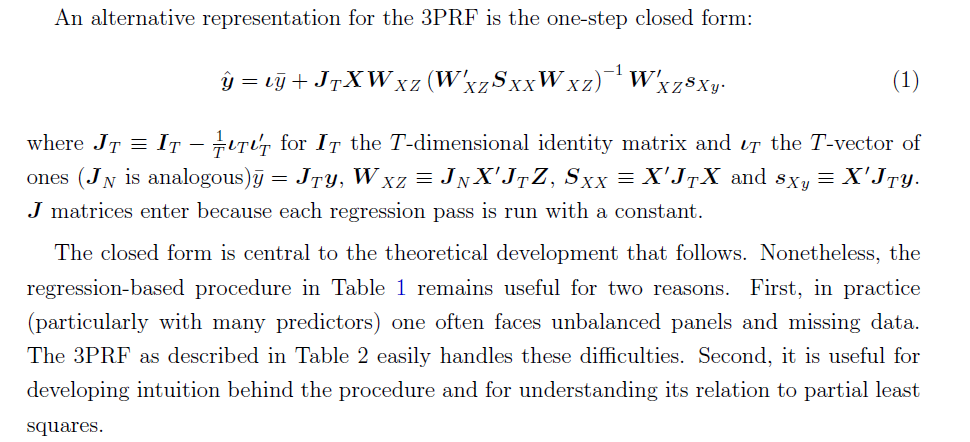
3PRFformula

Here, the source is the 2012 paper.

Spreadsheet Implementation

Spreadsheets help me understand the structure of the underlying data and the order of calculation, even if, for the most part, I work with toy examples.

So recently, I’ve been working through the 3PRF with a small spreadsheet.

Generating the factors:I generated the factors as two columns of random variables (=rand()) in Excel. I gave the factors different magnitudes by multiplying by different constants.

Generating the proxies Z and predictors X. Kelly and Pruitt call for the predictors to be variance standardized, so I generated 40 observations on ten sets of xi by selecting ten different coefficients to multiply into the two factors, and in each case I added a normal error term with mean zero and standard deviation 1. In Excel, this is the formula =norminv(rand(),0,1).

Basically, I did the same drill for the three zj — I created 40 observations for z1, z2, and z3 by multiplying three different sets of coefficients into the two factors and added a normal error term with zero mean and variance equal to 1.

Then, finally, I created yt by multiplying randomly selected coefficients times the factors.

After generating the data, the first pass regression is easy. You just develop a regression with each predictor xi as the dependent variable and the three proxies as the independent variables, case-by-case, across the time series for each. This gives you a bunch of regression coefficients which, in turn, become the explanatory variables in the cross-sectional regressions of the second step.

The regression coefficients I calculated for the three proxies, including a constant term, were as follows – where the 1st row indicates the regression for x1 and so forth.
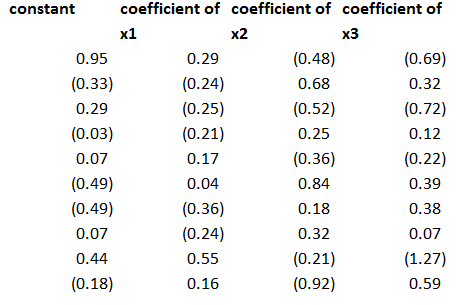
coeff

This second step is a little tricky, but you just take all the values of the predictor variables for a particular period and designate these as the dependent variables, with the constant and coefficients estimated in the previous step as the independent variables. Note, the number of predictors pairs up exactly with the number of rows in the above coefficient matrix.

This then gives you the factor loadings for the third step, where you can actually predict yt (really yt+1 in the 3PRF setup). The only wrinkle is you don’t use the constant terms estimated in the second step, on the grounds that these reflect “idiosyncratic” effects, according to the 2011 revision of the paper.

Note the authors describe this as a time series approach, but do not indicate how to get around some of the classic pitfalls of regression in a time series context. Obviously, first differencing might be necessary for nonstationary time series like GDP, and other data massaging might be in order.

Bottom line – this worked well in my first implementation.

To forecast, I just used the last regression for yt+1 and then added ten more cases, calculating new values for the target variable with the new values of the factors. I used the new values of the predictors to update the second step estimate of factor loadings, and applied the last third pass regression to these values.

Here are the forecast errors for these ten out-of-sample cases.
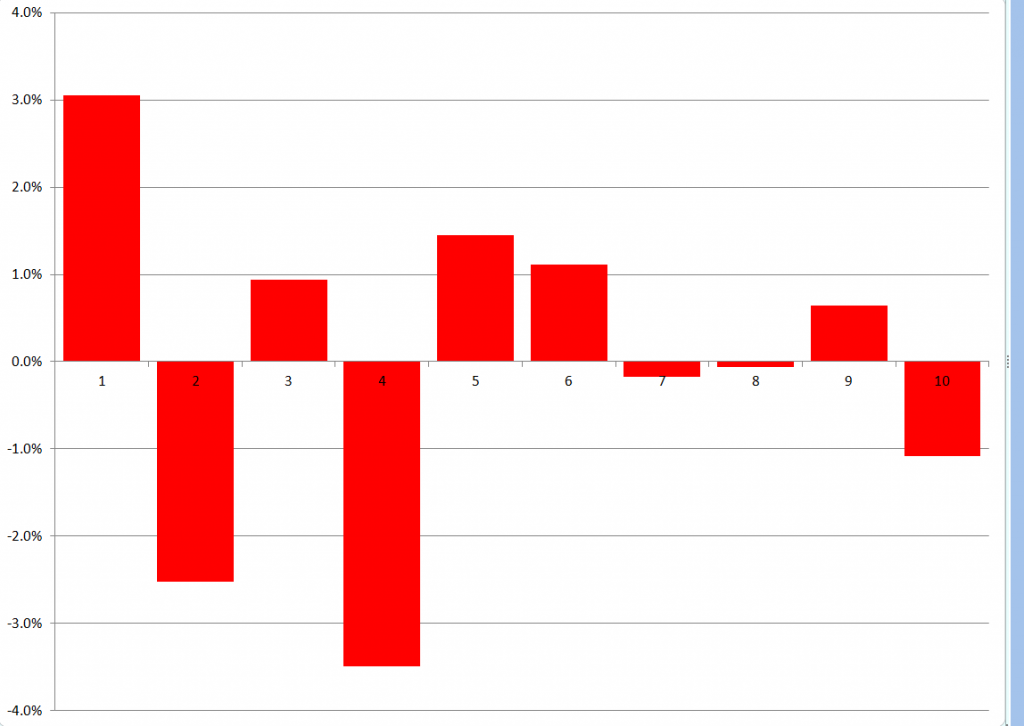
3PRFforecasterror

Not bad for a first implementation.

 Why Is Three Pass Regression Important?

3PRF is a fairly “clean” solution to an important problem, relating to the issue of “many predictors” in macroeconomics and other business research.

Noting that if the predictors number near or more than the number of observations, the standard ordinary least squares (OLS) forecaster is known to be poorly behaved or nonexistent, the authors write,

How, then, does one effectively use vast predictive information? A solution well known in the economics literature views the data as generated from a model in which latent factors drive the systematic variation of both the forecast target, y, and the matrix of predictors, X. In this setting, the best prediction of y is infeasible since the factors are unobserved. As a result, a factor estimation step is required. The literature’s benchmark method extracts factors that are significant drivers of variation in X and then uses these to forecast y. Our procedure springs from the idea that the factors that are relevant to y may be a strict subset of all the factors driving X. Our method, called the three-pass regression filter (3PRF), selectively identifies only the subset of factors that influence the forecast target while discarding factors that are irrelevant for the target but that may be pervasive among predictors. The 3PRF has the advantage of being expressed in closed form and virtually instantaneous to compute.

So, there are several advantages, such as (1) the solution can be expressed in closed form (in fact as one complicated but easily computable matrix expression), and (2) there is no need to employ maximum likelihood estimation.

Furthermore, 3PRF may outperform other approaches, such as principal components regression or partial least squares.

The paper illustrates the forecasting performance of 3PRF with real-world examples (as well as simulations). The first relates to forecasts of macroeconomic variables using data such as from the Mark Watson database mentioned previously in this blog. The second application relates to predicting asset prices, based on a factor model that ties individual assets’ price-dividend ratios to aggregate stock market fluctuations in order to uncover investors’ discount rates and dividend growth expectations.