Category Archives: forecasting asset bubbles

Rational Bubbles

A rational bubble exists when investors are willing to pay more for stocks than is justified by the discounted stream of future dividends. If investors evaluate potential gains from increases in the stock price as justifying movement away from the “fundamental value” of the stock – a self-reinforcing process of price increases can take hold, but be consistent with “rational expectations.”

This concept has been around for a while, and can be traced to eminences such as Oliver Blanchard, now Chief Economist for the International Monetary Fund (IMF), and Mark Watson, Professor of Economics at Princeton University – (See Bubbles, Rational Expectations and Financial Markets).

In terms of formal theory, Diba and Grossman offer a sophisticated analysis in The Theory of Rational Bubbles in Stock Prices. They invoke intriguing language such as “explosive conditional expectations” and the like.

Since these papers from the 1980’s, the relative size of the financial sector has ballooned, and valuation of derivatives now dwarfs totals for annual value of production on the planet (See Bank for International Settlements).

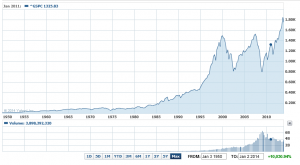
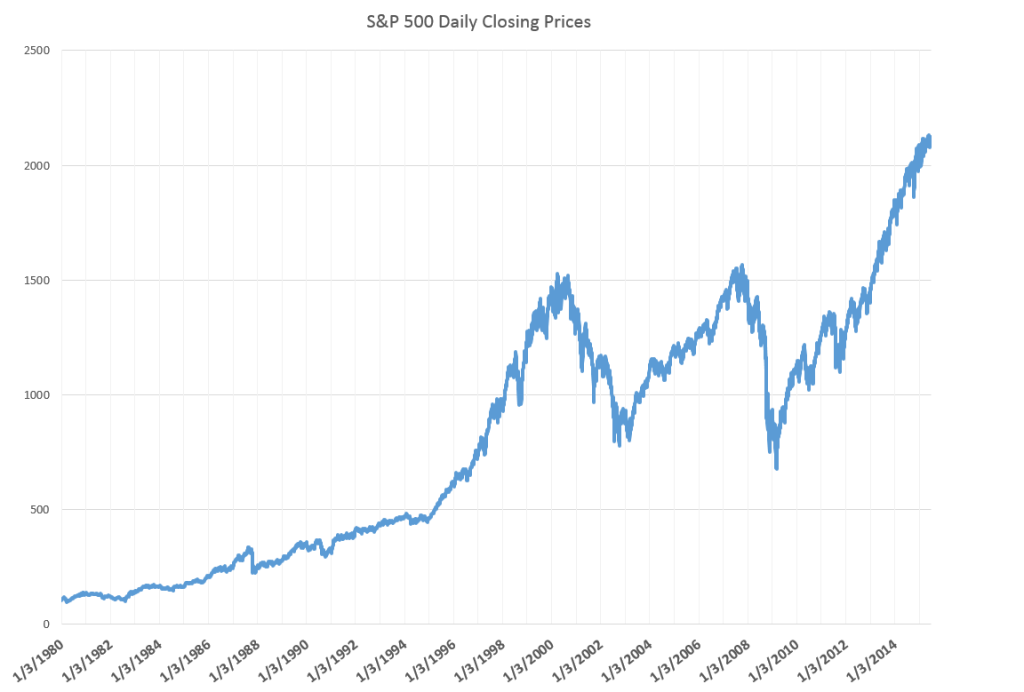
And, in the US, we have witnessed two, dramatic stock market bubbles, here using the phrase in a more popular “plain-as-the-hand-in-front-of-your-face” sense.

SP500

Following through the metaphor, bursting of the bubble leaves financial plans in shambles, and, from the evidence of parts of Europe at least, can cause significant immiseration of large segments of the population.

It would seem reasonable, therefore, to institute some types of controls, as a bubble was emerging. Perhaps an increase in financial transactions taxes, or some other tactic to cause investors to hold stocks for longer periods.

The question, then, is whether it is possible to “test” for a rational bubble pre-emptively or before-the-fact.

So I have been interested recently to come on more recent analysis of so-called rational bubbles, applying advanced statistical techniques.

I offer some notes and links to download the relevant papers.

These include ground-breaking work by Craine in a working paper Rational Bubbles: A Test.

Then, there are two studies focusing on US stock prices (I include extracts below in italics):

Testing for a Rational Bubble Under Long Memory

We analyze the time series properties of the S&P500 dividend-price ratio in the light of long memory, structural breaks and rational bubbles. We find an increase in the long memory parameter in the early 1990s by applying a recently proposed test by Sibbertsen and Kruse (2009). An application of the unit root test against long memory by Demetrescu et al. (2008) suggests that the pre-break data can be characterized by long memory, while the post-break sample contains a unit root. These results reconcile two empirical findings which were seen as contradictory so far: on the one hand they confirm the existence of fractional integration in the S&P500 log dividend-price ratio and on the other hand they are consistent with the existence of a rational bubble. The result of a changing memory parameter in the dividend-price ratio has an important implication for the literature on return predictability: the shift from a stationary dividend-price ratio to a unit root process in 1991 is likely to have caused the well-documented failure of conventional return prediction models since the 1990s. 

The bubble component captures the part of the share price that is due to expected future price changes. Thus, the price contains a rational bubble, if investors are ready to pay more for the share, than they know is justified by the discounted stream of future dividends. Since they expect to be able to sell the share even at a higher price, the current price, although exceeding the fundamental value, is an equilibrium price. The model therefore allows the development of a rational bubble, in the sense that a bubble is fully consistent with rational expectations. In the rational bubble model, investors are fully cognizant of the fundamental value, but nevertheless they may be willing to pay more than this amount… This is the case if expectations of future price appreciation are large enough to satisfy the rational investor’s required rate of return. To sustain a rational bubble, the stock price must grow faster than dividends (or cash flows) in perpetuity and therefore a rational bubble implies a lack of cointegration between the stock price and fundamentals, i.e. dividends, see Craine (1993).

Testing for rational bubbles in a co-explosive vector autoregression

We derive the parameter restrictions that a standard equity market model implies for a bivariate vector autoregression for stock prices and dividends, and we show how to test these restrictions using likelihood ratio tests. The restrictions, which imply that stock returns are unpredictable, are derived both for a model without bubbles and for a model with a rational bubble. In both cases we show how the restrictions can be tested through standard chi-squared inference. The analysis for the no-bubble case is done within the traditional Johansen model for I(1) variables, while the bubble model is analysed using a co-explosive framework. The methodology is illustrated using US stock prices and dividends for the period 1872-2000.

The characterizing feature of a rational bubble is that it is explosive, i.e. it generates an explosive root in the autoregressive representation for prices. 

This is a very interesting analysis, but involves several stages of statistical testing, all of which is somewhat dependent on assumptions regarding underlying distributions.

Finally, it is interesting to see some of these methodologies for identifying rational bubbles applied to other markets, such as housing, where “fundamental value” has a somewhat different and more tangible meaning.

Explosive bubbles in house prices? Evidence from the OECD countries

We conduct an econometric analysis of bubbles in housing markets in the OECD area, using quarterly OECD data for 18 countries from 1970 to 2013. We pay special attention to the explosive nature of bubbles and use econometric methods that explicitly allow for explosiveness. First, we apply the univariate right-tailed unit root test procedure of Phillips et al. (2012) on the individual countries price-rent ratio. Next, we use Engsted and Nielsen’s (2012) co-explosive VAR framework to test for bubbles. Wefind evidence of explosiveness in many housing markets, thus supporting the bubble hypothesis. However, we also find interesting differences in the conclusions across the two test procedures. We attribute these differences to how the two test procedures control for cointegration between house prices and rent.

Forecasting Housing Markets – 2

I am interested in business forecasting “stories.” For example, the glitch in Google’s flu forecasting program.

In real estate forecasting, the obvious thing is whether quantitative forecasting models can (or, better yet, did) forecast the collapse in housing prices and starts in the recent 2008-2010 recession (see graphics from the previous post).

There are several ways of going at this.

Who Saw The Housing Bubble Coming?

One is to look back to see whether anyone saw the bursting of the housing bubble coming and what forecasting models they were consulting.

That’s entertaining. Some people, like Ron Paul, and Nouriel Roubini, were prescient.

Roubini earned the soubriquet Dr. Doom for an early prediction of housing market collapse, as reported by the New York Times:

On Sept. 7, 2006, Nouriel Roubini, an economics professor at New York University, stood before an audience of economists at the International Monetary Fund and announced that a crisis was brewing. In the coming months and years, he warned, the United States was likely to face a once-in-a-lifetime housing bust, an oil shock, sharply declining consumer confidence and, ultimately, a deep recession. He laid out a bleak sequence of events: homeowners defaulting on mortgages, trillions of dollars of mortgage-backed securities unraveling worldwide and the global financial system shuddering to a halt. These developments, he went on, could cripple or destroy hedge funds, investment banks and other major financial institutions like Fannie Mae and Freddie Mac.

NR

Roubini was spot-on, of course, even though, at the time, jokes circulated such as “even a broken clock is right twice a day.” And my guess is his forecasting model, so to speak, is presented in Crisis Economics: A Crash Course in the Future of Finance, his 2010 book with Stephen Mihm. It is less a model than whole database of tendencies, institutional facts, areas in which Roubini correctly identifies moral hazard.

I think Ron Paul, whose projections of collapse came earlier (2003), was operating from some type of libertarian economic model.  So Paul testified before House Financial Services Committee on Fannie Mae and Freddy Mac, that –

Ironically, by transferring the risk of a widespread mortgage default, the government increases the likelihood of a painful crash in the housing market,” Paul predicted. “This is because the special privileges granted to Fannie and Freddie have distorted the housing market by allowing them to attract capital they could not attract under pure market conditions. As a result, capital is diverted from its most productive use into housing. This reduces the efficacy of the entire market and thus reduces the standard of living of all Americans.

On the other hand, there is Ben Bernanke, who in a CNBC interview in 2005 said:

7/1/05 – Interview on CNBC 

INTERVIEWER: Ben, there’s been a lot of talk about a housing bubble, particularly, you know [inaudible] from all sorts of places. Can you give us your view as to whether or not there is a housing bubble out there?

BERNANKE: Well, unquestionably, housing prices are up quite a bit; I think it’s important to note that fundamentals are also very strong. We’ve got a growing economy, jobs, incomes. We’ve got very low mortgage rates. We’ve got demographics supporting housing growth. We’ve got restricted supply in some places. So it’s certainly understandable that prices would go up some. I don’t know whether prices are exactly where they should be, but I think it’s fair to say that much of what’s happened is supported by the strength of the economy.

Bernanke was backed by one of the most far-reaching economic data collection and analysis operations in the United States, since he was in 2005 a member of the Board of Governors of the Federal Reserve System and Chairman of the President’s Council of Economic Advisors.

So that’s kind of how it is. Outsiders, like Roubini and perhaps Paul, make the correct call, but highly respected and well-placed insiders like Bernanke simply cannot interpret the data at their fingertips to suggest that a massive bubble was underway.

I think it is interesting currently that Roubini, in March, promoted the idea that Yellen Is Creating another huge Bubble in the Economy

But What Are the Quantitative Models For Forecasting the Housing Market?

In a long article in the New York Times in 2009, How Did Economists Get It So Wrong?, Paul Krugman lays the problem at the feet of the efficient market hypothesis –

When it comes to the all-too-human problem of recessions and depressions, economists need to abandon the neat but wrong solution of assuming that everyone is rational and markets work perfectly.

Along these lines, it is interesting that the Zillow home value forecast methodology builds on research which, in one set of models, assumes serial correlation and mean reversion to a long-term price trend.

Zillow

Key research in housing market dynamics includes Case and Shiller (1989) and Capozza et al (2004), who show that the housing market is not efficient and house prices exhibit strong serial correlation and mean reversion, where large market swings are usually followed by reversals to the unobserved fundamental price levels.

Based on the estimated model parameters, Capozza et al are able to reveal the housing market characteristics where serial correlation, mean reversion, and oscillatory, convergent, or divergent trends can be derived from the model parameters.

Here is an abstract from critical research underlying this approach done in 2004.

An Anatomy of Price Dynamics in Illiquid Markets: Analysis and Evidence from Local Housing Markets

This research analyzes the dynamic properties of the difference equation that arises when markets exhibit serial correlation and mean reversion. We identify the correlation and reversion parameters for which prices will overshoot equilibrium (“cycles”) and/or diverge permanently from equilibrium. We then estimate the serial correlation and mean reversion coefficients from a large panel data set of 62 metro areas from 1979 to 1995 conditional on a set of economic variables that proxy for information costs, supply costs and expectations. Serial correlation is higher in metro areas with higher real incomes, population growth and real construction costs. Mean reversion is greater in large metro areas and faster growing cities with lower construction costs. The average fitted values for mean reversion and serial correlation lie in the convergent oscillatory region, but specific observations fall in both the damped and oscillatory regions and in both the convergent and divergent regions. Thus, the dynamic properties of housing markets are specific to the given time and location being considered.

The article is not available for free download so far as I can determine. But it is based on earler research, dating back to the later 1990’s in the pdf The Dynamic Structure of Housing Markets.

The more recent Housing Market Dynamics: Evidence of Mean Reversion and Downward Rigidity by Fannie Mae researchers, lists a lot of relevant research on the serial correlation of housing prices, which is usually locality-dependent.

In fact, the Zillow forecasts are based on ensemble methods, combining univariate and multivariate models – a sign of modernity in the era of Big Data.

So far, though, I have not found a truly retrospective study of the housing market collapse, based on quantitative models. Perhaps that is because only the Roubini approach works with such complex global market phenomena.

We are left, thus, with solid theoretical foundations, validated by multiple housing databases over different time periods, that suggests that people invest in housing based on momentum factors – and that this fairly obvious observation can be shown statistically, too.

And Now – David Stockman

David Stockman, according to his new website Contra Corner,

is the ultimate Washington insider turned iconoclast. He began his career in Washington as a young man and quickly rose through the ranks of the Republican Party to become the Director of the Office of Management and Budget under President Ronald Reagan. After leaving the White House, Stockman had a 20-year career on Wall Street.

Currently, Stockman takes the contrarian view that the US Federal Reserve Bank is feeding a giant bubble which is bound to collapse

He states his opinions with humor and wit, as some of article titles on Contra Corner indicate –

Fed’s Taper Kabuki is Farce; Gong Show of Cacophony, Confusion and Calamity Coming

Or

General John McCain Strikes Again!

The Worst Bear Market in History – Guest Post

This is a fascinating case study of financial aberration, authored by Bryan Taylor, Ph.D., Chief Economist, Global Financial Data.

**********************************************************

Which country has the dubious distinction of suffering the worst bear market in history?

To answer this question, we ignore countries where the government closed down the stock exchange, leaving investors with nothing, as occurred in Russia in 1917 or Eastern European countries after World War II. We focus on stock markets that continued to operate during their equity-destroying disaster.

There is a lot of competition in this category.  Almost every major country has had a bear market in which share prices have dropped over 80%, and some countries have had drops of over 90%. The Dow Jones Industrial Average dropped 89% between 1929 and 1932, the Greek Stock market fell 92.5% between 1999 and 2012, and adjusted for inflation, Germany’s stock market fell over 97% between 1918 and 1922.

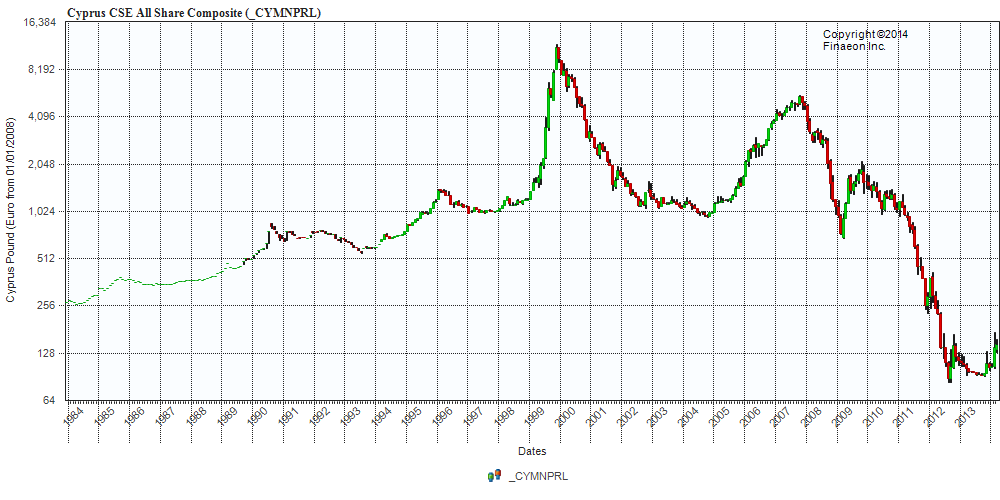
The only consolation to investors is that the maximum loss on their investment is 100%, and one country almost achieved that dubious distinction. Cyprus holds the record for the worst bear market of all time in which investors have lost over 99% of their investment! Remember, this loss isn’t for one stock, but for all the shares listed on the stock exchange.

The Cyprus Stock Exchange All Share Index hit a high of 11443 on November 29, 1999, fell to 938 by October 25, 2004, a 91.8% drop.  The index then rallied back to 5518 by October 31, 2007 before dropping to 691 on March 6, 2009.  Another rally ensued to October 20, 2009 when the index hit 2100, but collapsed from there to 91 on October 24, 2013.  The chart below makes any roller-coaster ride look boring by comparison (click to enlarge).

GFD1

The fall from 11443 to 91 means that someone who invested at the top in 1999 would have lost 99.2% of their investment by 2013.  And remember, this is for ALL the shares listed on the Cyprus Stock Exchange.  By definition, some companies underperform the average and have done even worse, losing their shareholders everything.

For the people in Cyprus, this achievement only adds insult to injury.  One year ago, in March 2013, Cyprus became the fifth Euro country to have its financial system rescued by a bail-out.  At its height, the banking system’s assets were nine times the island’s GDP. As was the case in Iceland, that situation was unsustainable.

Since Germany and other paymasters for Ireland, Portugal, Spain and Greece were tired of pouring money down the bail-out drain, they demanded not only the usual austerity and reforms to put the country on the right track, but they also imposed demands on the depositors of the banks that had created the crisis, creating a “bail-in”.

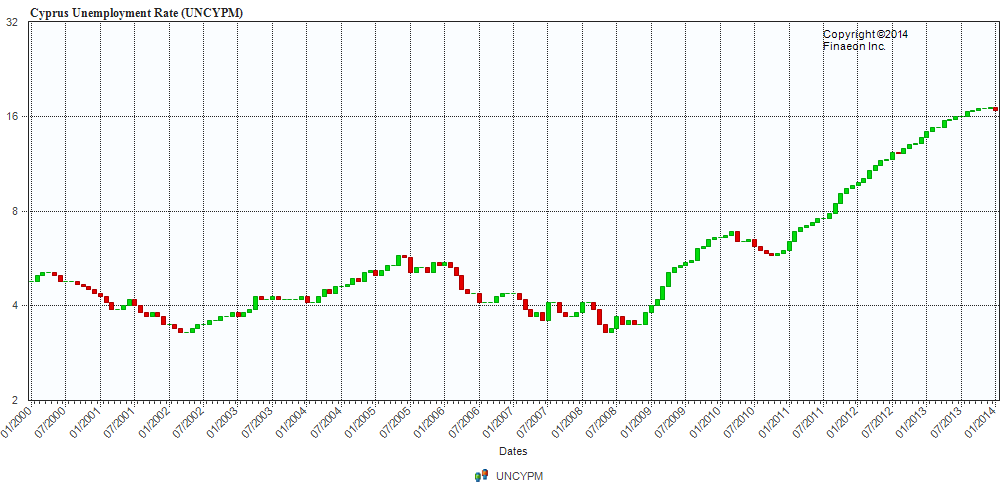
As a result of the bail-in, debt holders and uninsured depositors had to absorb bank losses. Although some deposits were converted into equity, given the decline in the stock market, this provided little consolation. Banks were closed for two weeks and capital controls were imposed upon Cyprus.  Not only did depositors who had money in banks beyond the insured limit lose money, but depositors who had money in banks were restricted from withdrawing their funds. The impact on the economy has been devastating. GDP has declined by 12%, and unemployment has gone from 4% to 17%.

GFD2

On the positive side, when Cyprus finally does bounce back, large profits could be made by investors and speculators.  The Cyprus SE All-Share Index is up 50% so far in 2014, and could move up further. Of course, there is no guarantee that the October 2013 will be the final low in the island’s fourteen-year bear market.  To coin a phrase, Cyprus is a nice place to visit, but you wouldn’t want to invest there.

Didier Sornette – Celebrity Bubble Forecaster

Professor Didier Sornette, who holds the Chair in Entreprenuerial Risks at ETH Zurich, is an important thinker, and it is heartening to learn the American Association for the Advancement of Science (AAAS) is electing Professor Sornette a Fellow.

It is impossible to look at, say, the historical performance of the S&P 500 over the past several decades, without concluding that, at some point, the current surge in the market will collapse, as it has done previously when valuations ramped up so rapidly and so far.

S&P500recent

Sornette focuses on asset bubbles and has since 1998, even authoring a book in 2004 on the stock market.

At the same time, I think it is fair to say that he has been largely ignored by mainstream economics (although not finance), perhaps because his training is in physical science. Indeed, many of his publications are in physics journals – which is interesting, but justified because complex systems dynamics cross the boundaries of many subject areas and sciences.

Over the past year or so, I have perused dozens of Sornette papers, many from the extensive list at http://www.er.ethz.ch/publications/finance/bubbles_empirical.

This list is so long and, at times, technical, that videos are welcome.

Along these lines there is Sornette’s Ted talk (see below), and an MP4 file which offers an excellent, high level summary of years of research and findings. This MP4 video was recorded at a talk before the International Center for Mathematical Sciences at the University of Edinburgh.

Intermittent criticality in financial markets: high frequency trading to large-scale bubbles and crashes. You have to download the file to play it.

By way of précis, this presentation offers a high-level summary of the roots of his approach in the economics literature, and highlights the role of a central differential equation for price change in an asset market.

So since I know everyone reading this blog was looking forward to learning about a differential equation, today, let me highlight the importance of the equation,

dp/dt = cpd

This basically says that price change in a market over time depends on the level of prices – a feature of markets where speculative forces begin to hold sway.

This looks to be a fairly simple equation, but the solutions vary, depending on the values of the parameters c and d. For example, when c>0 and the exponent d  is greater than one, prices change faster than exponentially and within some finite period, a singularity is indicated by the solution to the equation. Technically, in the language of differential equations this is called a finite time singularity.

Well, the essence of Sornette’s predictive approach is to estimate the parameters of a price equation that derives, ultimately, from this differential equation in order to predict when an asset market will reach its peak price and then collapse rapidly to lower prices.

The many sources of positive feedback in asset pricing markets are the basis for the faster than exponential growth, resulting from d>1. Lots of empirical evidence backs up the plausibility and credibility of herd and imitative behaviors, and models trace out the interaction of prices with traders motivated by market fundamentals and momentum traders or trend followers.

Interesting new research on this topic shows that random trades could moderate the rush towards collapse in asset markets – possibly offering an alternative to standard regulation.

The important thing, in my opinion, is to discard notions of market efficiency which, even today among some researchers, result in scoffing at the concept of asset bubbles and basic sabotage of research that can help understand the associated dynamics.

Here is a TED talk by Sornette from last summer.

Links – February 1, 2014

IT and Big Data

Kayak and Big Data Kayak is adding prediction of prices of flights over the coming 7 days to its meta search engine for the travel industry.

China’s Lenovo steps into ring against Samsung with Motorola deal Lenovo Group, the Chinese technology company that earns about 80 percent of its revenue from personal computers, is betting it can also be a challenger to Samsung Electronics Co Ltd and Apple Inc in the smartphone market.

5 Things To Know About Cognitive Systems and IBM Watson Rob High video on Watson at http://www.redbooks.ibm.com/redbooks.nsf/pages/watson?Open. Valuable to review. Watson is probably different than you think. Deep natural language processing.

Playing Computer Games and Winning with Artificial Intelligence (Deep Learning) Pesents the first deep learning model to successfully learn control policies directly from high-dimensional sensory input using reinforcement learning. The model is a convolutional neural network, trained with a variant of Q-learning, whose input is raw pixels and whose output is a value function estimating future rewards… [applies] method to seven Atari 2600 games from the Arcade Learning Environment, with no adjustment of the architecture or learning algorithm…outperforms all previous approaches on six of the games and surpasses a human expert on three of them.

Global Economy

China factory output points to Q1 lull Chinese manufacturing activity slipped to its lowest level in six months, with indications of slowing growth for the quarter to come in the world’s second-largest economy.

Japan inflation rises to a 5 year high, output rebounds Japan’s core consumer inflation rose at the fastest pace in more than five years in December and the job market improved, encouraging signs for the Bank of Japan as it seeks to vanquish deflation with aggressive money printing.

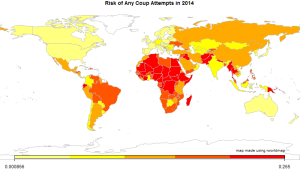
Coup Forecasts for 2014

coupforecast                       

World risks deflationary shock as BRICS puncture credit bubbles Ambrose Evans-Pritchard does some nice analysis in this piece.

Former IMF Chief Economist, Now India’s Central Bank Governor Rajan Takes Shot at Bernanke’s Destabilizing Policies

Some of his key points:

Emerging markets were hurt both by the easy money which flowed into their economies and made it easier to forget about the necessary reforms, the necessary fiscal actions that had to be taken, on top of the fact that emerging markets tried to support global growth by huge fiscal and monetary stimulus across the emerging markets. This easy money, which overlaid already strong fiscal stimulus from these countries. The reason emerging markets were unhappy with this easy money is “This is going to make it difficult for us to do the necessary adjustment.” And the industrial countries at this point said, “What do you want us to do, we have weak economies, we’ll do whatever we need to do. Let the money flow.”

Now when they are withdrawing that money, they are saying, “You complained when it went in. Why should you complain when it went out?” And we complain for the same reason when it goes out as when it goes in: it distorts our economies, and the money coming in made it more difficult for us to do the adjustment we need for the sustainable growth and to prepare for the money going out

International monetary cooperation has broken down. Industrial countries have to play a part in restoring that, and they can’t at this point wash their hands off and say we’ll do what we need to and you do the adjustment. ….Fortunately the IMF has stopped giving this as its mantra, but you hear from the industrial countries: We’ll do what we have to do, the markets will adjust and you can decide what you want to do…. We need better cooperation and unfortunately that’s not been forthcoming so far.

Science Perspective

Researchers Discover How Traders Act Like Herds And Cause Market Bubbles

Building on similarities between earthquakes and extreme financial events, we use a self-organized criticality-generating model to study herding and avalanche dynamics in financial markets. We consider a community of interacting investors, distributed in a small-world network, who bet on the bullish (increasing) or bearish (decreasing) behavior of the market which has been specified according to the S&P 500 historical time series. Remarkably, we find that the size of herding-related avalanches in the community can be strongly reduced by the presence of a relatively small percentage of traders, randomly distributed inside the network, who adopt a random investment strategy. Our findings suggest a promising strategy to limit the size of financial bubbles and crashes. We also obtain that the resulting wealth distribution of all traders corresponds to the well-known Pareto power law, while that of random traders is exponential. In other words, for technical traders, the risk of losses is much greater than the probability of gains compared to those of random traders. http://pre.aps.org/abstract/PRE/v88/i6/e062814

Blogs review: Getting rid of the Euler equation – the equation at the core of modern macro The Euler equation is one of the fundamentals, at a deep level, of dynamic stochastic general equilibrium (DSGE) models promoted as the latest and greatest in theoretical macroeconomics. After the general failures in mainstream macroeconomics with 2008-09, DGSE have come into question, and this review is interesting because it suggests, to my way of thinking, that the Euler equation linking past and future consumption patterns is essentially grafted onto empirical data artificially. It is profoundly in synch with neoclassical economic theory of consumer optimization, but cannot be said to be supported by the data in any robust sense. Interesting read with links to further exploration.

BOSTON COLLOQUIUM FOR PHILOSOPHY OF SCIENCE: Revisiting the Foundations of Statistics – check this out – we need the presentations online.

Asset Bubbles

It seems only yesterday when “rational expectations” ruled serious discussions of financial economics. Value was determined by the CAPM – capital asset pricing model. Markets reflected the operation of rational agents who bought or sold assets, based largely on fundamentals. Although imprudent, stupid investors were acknowledged to exist, it was impossible for a market in general to be seized by medium- to longer term speculative movements or “bubbles.”

This view of financial and economic dynamics is at the same time complacent and intellectually aggressive. Thus, proponents of the efficient market hypothesis contest the accuracy of earlier discussions of the Dutch tulip mania.

Now, however, there seems no doubt that bubbles in asset markets are both real and intractable to regulation and management, despite their catastrophic impacts.

But asset bubbles are so huge now that Larry Summers suggests, before the International Monetary Fund (IMF) recently, that the US is in a secular stagnation, and that the true, “market-clearing” interest rate is negative. Thus, given the unreality of implementing a negative interest rate, we face a long future of the zero bound – essentially zero interest rates.

Furthermore, as Paul Krugman highlights in a follow-on blog post – Summers says the economy needs bubbles to generate growth.

We now know that the economic expansion of 2003-2007 was driven by a bubble. You can say the same about the latter part of the 90s expansion; and you can in fact say the same about the later years of the Reagan expansion, which was driven at that point by runaway thrift institutions and a large bubble in commercial real estate.

So you might be tempted to say that monetary policy has consistently been too loose. After all, haven’t low interest rates been encouraging repeated bubbles?

But as Larry emphasizes, there’s a big problem with the claim that monetary policy has been too loose: where’s the inflation? Where has the overheated economy been visible?

So how can you reconcile repeated bubbles with an economy showing no sign of inflationary pressures? Summers’s answer is that we may be an economy that needs bubbles just to achieve something near full employment – that in the absence of bubbles the economy has a negative natural rate of interest. And this hasn’t just been true since the 2008 financial crisis; it has arguably been true, although perhaps with increasing severity, since the 1980s.

Re-enter the redoubtable “liquidity trap” stage left.

Summers and Krugman move at a fairly abstract and theoretical level, regarding asset bubbles and the current manifestation.

But more and more, the global financial press points the finger at the US Federal Reserve and its Quantitative Easing (QE) as the cause of emerging bubbles around the world.

One of the latest to chime in is the Chinese financial magazine Caixin with Heading Toward a Cliff.

The Fed’s QE policy has caused a gigantic liquidity bubble in the global economy, especially in emerging economies and asset markets. The improvement in the global economy since 2008 is a bubble phenomenon, centering around the demand from bubble goods or wealth effect. Hence, real Fed tightening would prick the bubble and trigger another recession. This is why some talk of the Fed tightening could trigger the global economy to trend down…

The odds are that the world is experiencing a bigger bubble than the one that unleashed the 2008 Global Financial Crisis. The United States’ household net wealth is much higher than at the peak in the last bubble. China’s property rental yields are similar to what Japan experienced at the peak of its property bubble. The biggest part of today’s bubble is in government bonds valued at about 100 percent of global GDP. Such a vast amount of assets is priced at a negative real yield. Its low yield also benefits other borrowers. My guesstimate is that this bubble subsidizes debtors to the tune of 10 percent of GDP or US$ 7 trillion dollars per annum. The transfer of income from savers to debtors has never happened on such a vast scale, not even close. This is the reason that so many bubbles are forming around the world, because speculation is viewed as an escape route for savers.The property market in emerging economies is the second-largest bubble. It is probably 100 percent overvalued. My guesstimate is that it is US$ 50 trillion overvalued.Stocks, especially in the United States, are significantly overvalued too. The overvaluation could be one-third or about US$ 20 trillion.There are other bubbles too. Credit risk, for example, is underpriced. The art market is bubbly again. These bubbles are not significant compared to the big three above.

The Caixin author – Andy Xie – goes on to predict inflation as the eventual outcome – a prediction I find far-fetched given the coming reaction to Fed tapering.

And the reach of the Chinese real estate bubble is highlighted by a CBS 60 Minutes video filmed some months ago.

Anatomy of a Bubble

The Great Recession of 2008-2009 alerted us – what goes up, can come down. But are there common patterns in asset bubbles? Can the identification of these patterns help predict the peak and subsequent point of rapid decline?

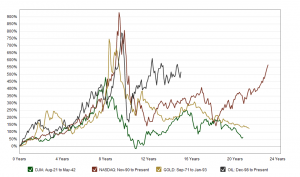
Macrotrends is an interesting resource in this regard. The following is a screenshot of a Macrotrends chart which, in the original, has interactive features.

Macrotrends.org_The_Four_Biggest_US_Bubbles              

Scaling the NASDAQ, gold, and oil prices in terms of percentage changes from points several years preceding price peaks suggests bubbles share the same cadence, in some sense.

These curves highlight that asset bubbles can occur over significant periods – several years to a decade. This is the part of the seduction. At first, when commentators cry “bubble,” prudent investors stand aside to let prices peak and crash. Yet prices may continue to rise for years, leaving investors increasingly feeling they are “being left behind.”

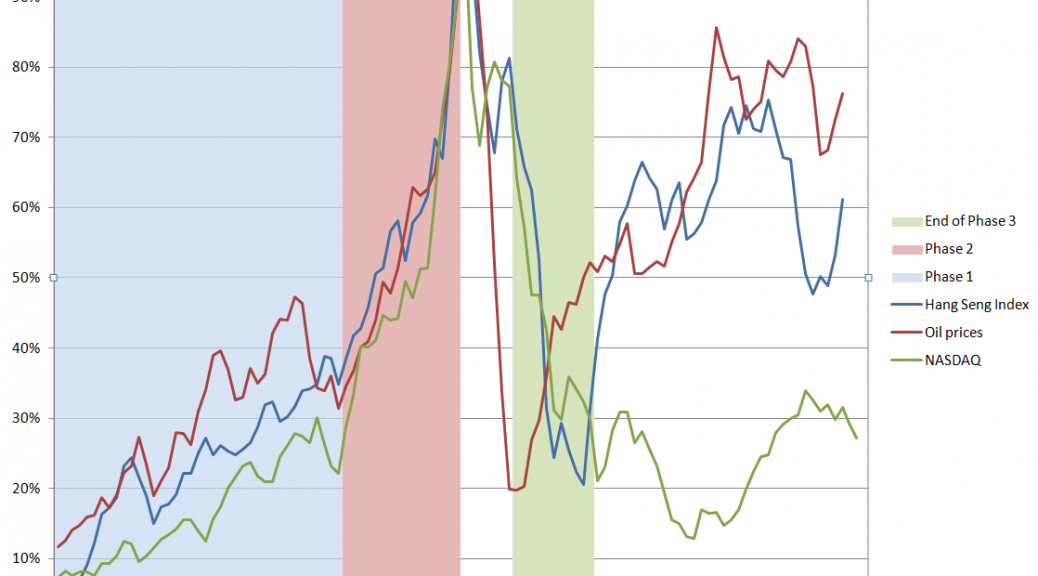
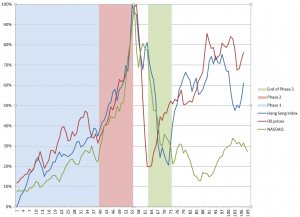
Here are data from three asset bubbles – the Hong Kong Hang Seng Index, oil prices to refiners (combined), and the NASDAQ 100 Index. Click to enlarge.

BubbleAnatomy

I arrange these time series so their peak prices – the peak of the bubble – coincide, despite the fact that these peaks occurred at different historical times (October 2007, August 2008, March 2000, respectively).

I include approximately 5 years of prior values of each time series, and scale the vertical dimensions so the peaks equal 100 percent.

This produces a chart which suggests three distinct phases to an asset bubble.

Phase 1 is a ramp-up. In this initial phase, prices surge for 2-3 years, then experience a relatively minor drop.

Phase 2 is the beginning of a sustained period of faster-than-exponential growth, culminating in the market peak, followed immediately by the market collapse. Within a few months of the peak, the rates of growth of prices in all three series are quite similar, indeed almost identical. These rates of price growth are associated with “an accelerating acceleration” of growth, in fact – as a study of first and second differences of the rates of growth show.

The critical time point, at which peak price occurs, looks like the point at which traders can see the vertical asymptote just a month or two in front of them, given the underlying dynamics.

Phase 3 is the market collapse. Prices drop maybe 80 percent of the value they rose from the initial point, and rapidly – in the course of 1-2 years. This is sometimes modeled as a “negative bubble.” It is commonly considered that the correction overshoots, and then adjusts back.

There also seems to be a Phase 4, when prices can recover some or perhaps almost all of their lost glory, but where volatility can be substantial.

Predictability

It seems reasonable that the critical point, or peak price, should be more or less predictable, a few months into Phase 2.

The extent of the drop from the peak in Phase 3 seems more or less predictable, also.

The question really is whether the dynamics of Phase 1 are truly informative. Is there something going on in Phase 1 that is different than in immediately preceding periods? Phase 1 seems to “set the stage.”

But there is no question the lure of quick riches involved in the advanced stages of an asset bubble can dazzle the most intelligent among us – and as a case in point, I give you Sir Isaac Newton, co-inventor with Liebnitz of the calculus, discoverer of the law of gravitation, and exponent of a vast new science, in his time, of mathematical physics.

SirIsaacNewton

A post on Business Insider highlights his unhappy case with the South Seas stock bubble. Newton was in this scam early, and then got out. But the Bubble kept levitating, so he entered the market again near the top – in Didier Sornette’s terminology, near the critical point of the process, only to lose what in his time was vast fortune of worth $2.4 million dollars in today’s money.