US Surge in 2nd Quarter GDP

Statistica put together this graphic showing quarter-over-quarter growth in US real GDP from 2009 to the 2nd quarter of 2014.

QoQRGDPGr

The last bar in the chart, showing 4.2 percent growth, is the 2nd quarter 2014 estimate, released by The Bureau of Economic Analysis (BEA) August 28. This represents a slight upward revision from the 4.0 percent “advance estimate” released in July.

Notice these are quarter-over-quarter growth rates, and, as the Statistica chart shows, are fairly volatile.

Thus, a 4.1 percent real or inflation-adjusted growth rate for the April through June 2014 period does not mean 2014 growth will roll in at this rate.

In fact, as the Forbes item on this release highlights,

Dan North, chief economist at Euler Hermes North America… warns GDP watchers should not get too excited…since the economy contracted 2.1% in the first quarter of this year the large jump is payback and in the first half of 2014 the economy gained just 1%. North expects third and fourth quarter GDP to gain around 3% which would round out to an uninspiring roughly 2% growth for the year.

The BEA presents the following detail on the growth estimate (click to enlarge).

BEAtab

Personal consumption expenditures are the largest component in the real GDP series, and bounced back to 2.5 percent growth in the 2nd quarter. Gross private domestic investment surged 17.5 percent for Q2 over Q1, and included healthy 10.7 Q-over-Q growth in investment in equipment. Exports also showed solid Q-over-Q growth.

Europe and Japan

Europe and Japan numbers for the 2nd Quarter are more pessimistic.

Here’s a comparison with European Q-over-Q real growth rates from Eurostat .

eurostat

The EA 18 is the Euro Area, which includes Belgium, Germany, Estonia, Ireland, Greece, Spain, France, Italy, Cyprus, Latvia, Luxembourg, Malta, the Netherlands, Austria, Portugal, Slovenia, Slovakia and Finland.

Germany and Italy report -0.2 percent declines Q-over-Q growth in the 2nd quarter.

Trading Economics compiles the following chart of Japanese Q-over-Q real GDP growth, which tanked the 2nd quarter.

Japan

From this data, I think it is safe to say the recovery from 2008-2009 is still under-performing.

Whether these data will be followed on by year-over-year declines in future quarters remains to be seen.

Recession and Economic Projections

I’ve been studying the April 2014 World Economic Outlook (WEO) of the International Monetary Fund (IMF) with an eye to its longer term projections of GDP.

Downloading the WEO database and summing the historic and projected GDP’s suggests this chart.

GlobalGDP

The WEO forecasts go to 2019, almost to our first benchmark date of 2020. Global production is projected to increase from around $76.7 trillion in current US dollar equivalents to just above $100 trillion. An update in July marked the estimated 2014 GDP growth down from 3.7 to 3.4 percent, leaving the 2015 growth estimate at a robust 4 percent.

The WEO database is interesting, because it’s country detail allows development of charts, such as this.

gbobalproout

So, based on this country detail on GDP and projections thereof, the BRIC’s (Brazil, Russia, India, and China) will surpass US output, measured in current dollar equivalents, in a couple of years.

In purchasing power parity (PPP) terms, China is currently or will soon pass the US GDP, incidentally. Thus, according to the Big Mac index, a hamburger is 41 percent undervalued in China, compared to the US. So boosting Chinese production 41 percent puts its value greater than US output. However, the global totals would change if you take this approach, and it’s not clear the Chinese proportion would outrank the US yet.

The Impacts of Recession

The method of caging together GDP forecasts to the year 2030, the second benchmark we want to consider in this series of posts, might be based on some type of average GDP growth rate.

However, there is a fundamental issue with this, one I think which may play significantly into the actual numbers we will see in coming years.

Notice, for example, the major “wobble” in the global GDP curve historically around 2008-2009. The Great Recession, in fact, was globally synchronized, although it only caused a slight inflection in Chinese and BRIC growth. Europe and Japan, however, took a major hit, bringing global totals down for those years.

Looking at 2015-2020 and, certainly, 2015-2030, it would be nothing short of miraculous if there were not another globally synchronized recession. Currently, for example, as noted in an earlier post here, the Eurozone, including Germany, moved into zero to negative growth last quarter, and there has been a huge drop in Japanese production. Also, Chinese economic growth is ratcheting down from it atmospheric levels of recent years, facing a massive real estate bubble and debt overhang.

But how to include a potential future recession in economic projections?

One guide might be to look at how past projections have related to these types of events. Here, for example, is a comparison of the 2008 and 2014 US GDP projections in the WEO’s.

WEOUS

So, according to the IMF, the Great Recession resulted in a continuing loss of US production through until the present.

This corresponds with the concept that, indeed, the GDP time series is, to a large extent, a random walk with drift, as Nelson and Plosser suggested decades ago (triggering a huge controversy over unit roots).

And this chart highlights a meaning for potential GDP. Thus, the capability to produce things did not somehow mysteriously vanish in 2008-2009. Rather, there was no point in throwing up new housing developments in a market that was already massively saturated, Not only that, but the financial sector was unable to perform its usual duties because it was insolvent – holding billions of dollars of apparently worthless collateralized mortgage securities and other financial innovations.

There is a view, however, that over a long period of time some type of mean reversion crops up.

This is exemplified in the 2014 Congressional Budget Office (CBO) projections, as shown in this chart from the underlying detail.

CBOpotentialGDP

This convergence on potential GDP, which somehow is shown in the diagram with a weaker growth rate just after 2008, is based on the following forecasts of underlying drivers, incidentally.

CBOdrivers

So again, despite the choppy historical detail for US real GDP growth in the chart on the upper left, the forecast adopted by the CBO blithely assumes no recession through 2024 as well as increase in US interest rates back to historic levels by 2019.

I think this clearly suggests the Congressional Budget Office is somewhere in la-la land.

But the underlying question still remains.

How would one incorporate the impacts of an event – a recession – which is probably almost a certainty by the end of these forecast horizons, but whose timing is uncertain?

Of course, there are always scenarios, and I think, particularly for budget discussions, it would be good to display one or two of these.

I’m interested in reader suggestions on this.

Links – Labor Day Weekend

Tech

Amazon’s Cloud Is So Pervasive, Even Apple Uses It

Your iCloud storage is apparently on Amazon.

Amazon’s Cloud Is The Fastest Growing Software Business In History

AWS

AWS is Amazon Web Services. The author discounts Google growth, since it is primarily a result of selling advertising. 

How Microsoft and Apple’s Ads Define Their Strategy

Microsoft approaches the market from the top down, while Apple goes after the market from the bottom up.

Mathematical Predictions for the iPhone 6

Can you predict features of the iPhone6 scheduled to be released September 6?

iphoneplot

Predictive Analytics

Comparison of statistical software

Good links for R, Matlab, SAS, Stata, and SPSS.

Types and Uses of Predictive Analytics, What they are and Where You Can Put Them to Work

Gartner says that predictive analytics is a mature technology yet only one company in eight is currently utilizing this ability to predict the future of sales, finance, production, and virtually every other area of the enterprise. What is the promise of predictive analytics and what exactly are they [types and uses of predictive analytics]? Good highlighting of main uses of predictive analytics in companies.

The Four Traps of Predictive Analytics

Magical thinking/ Starting at the Top/ Building Cottages, not Factories/ Seeking Purified Data. Good discussion. This short article in the Sloan Management Review is spot on, in my opinion. The way to develop good predictive analytics is to pick an area, indeed, pick the “low-handing fruit.” Develop workable applications, use them, improve them, broaden the scope. The “throw everything including the kitchen sink” approach of some early Big Data deployments is almost bound to fail. Flashy, trendy, but, in the final analysis, using “exhaust data” to come up with obscure customer metrics probably will not cut in the longer run.

Economic Issues

The Secular Stagnation Controversy

– discusses the e-book Secular Stagnation: Facts, Causes and Cures. The blogger Timothy Taylor points out that “secular” here has no relationship to lacking a religious context, but refers to the idea that market economies, or, if you like, capitalist economies, can experience long periods (decade or more) of desultory economic growth. Check the e-book for Larry Summer’s latest take on the secular stagnation hypothesis.

Here’s how much aid the US wants to send foreign countries in 2015, and why (INFOGRAPHIC

foreignaid

Video Friday – The Present Can Influence the Past?

In forecasting, the common assumption is that the present influences the future, but the opposite does not occur.

Oh to be sure, one develops expectations and, yes, predictions which may influence present actions. But these are not realized, but projected. What actually occurs tomorrow, however, is not usually considered to directly influence what transpires today, particularly chance events. Thus, if Roger flips a coin tomorrow and it comes up heads, that is not supposed to have any material effect on physical processes occurring today.

But this turns out to happen at the level of quantum reality – in other words, at a more fundamental level of physical reality, as the quantum eraser experiment proves.

OK, it is a good idea to begin with the classic double slit experiment, as a lead-in. Here are two videos, one with a comic strip professor, and the second with Professor Brian Greene of Columbia University and several of his collegues.


So you immediately get into what I would call metaphysics – issues of whether consciousness can impinge on what is being observed, thus changing it.

Again, Professor Brian Greene on the double slit experiment, another narrative.

 OK, so then there is the “quantum eraser.”

 I’m still thinking about this. It’s profound, experimental metaphysics. Time is not what we think it is, just as space is not what it seems.

Quantum entanglement, incidentally, is what Einstein called “spooky action at a distance.”

Population Forecasts, 2020 and 2030

The United Nations population division produces widely-cited forecasts with country detail on a number of key metrics, such as age structure and median age.

The latest update (2012 revision) estimates 2010 base population at 6.9 billion persons, projecting global population at 7.7 billion and 8.4 billion in 2020 and 2030, respectively, in a medium fertility scenario.

The low fertility scenario projects 7.5 billion persons for 2020 and approximately 8.0 billion for 2030.

So, bottom line, global population is unlikely to peak during this forecast period to 2030, although it is likely to decline, under all fertility scenarios, for key players in the global economy – such as Japan and Germany.

Population decline is even possible, according to the 2012 revision, in a low fertility scenario for China, although not with higher birth rates, as indicated in the following chart.

ChinaIndia

Some rudimentary data analytics shows the importance of the estimate of median age in a country for its projected population growth in the 2012 revision.

For example, here is a scatter diagram of the median age within a country (horizontal or x-axis) and the percentage increase or decrease 2010-2030 in the medium fertility scenario of the UN projections. Thus, just to clarify, a 60 percent “percentage growth” on the vertical axis means 2030 population is 60 percent larger than the estimated base year 2010 population.

scatter

Note that a polynomial regression fits this scatter of points with a relatively high R2. This indicates that the median age is negatively related to the projected population change for a country in this period with drop-offs in the earliest and oldest median ages in the population of countries.

Thus, in the first chart, Chinese growth includes the possibility of a decline over this period, and India’s does not. This is related to the fact that the median age of China in 2010 is estimated at 34.6 years, while the median age in 2010 in India is estimated at 25.5 years of age.

China and India, of course, are the world’s two most populous countries.

Here are some other interesting charts from the UN projections.

Russia, Japan, and Germany

RJG

The comparison for these countries is between the high fertility and low fertility scenarios. The middle fertility scenario lies pretty squarely between these curves for each nation.

Indonesia, Brazil, and Nigeria

IBN

Nigeria has the highest population growth rates for any larger country for this period, again because its 2010 median age is listed as around 18 years of age.

Accuracy of UN Population Forecasts

The accuracy of UN population forecasts has improved over the past several decades, with improved estimates of base population (See for example. Data quality and accuracy of UN Population Projections, 1950-1995). Needless to say forecasts for industrially developed counties usually have been better than for nations in the developing world.

Changes in migration account for significant errors in national population forecasts, as when a large contingent, some legal, some side-stepping legal immigration channels, came from Mexico and other Spanish-speaking areas “South of the Border,” changing birth patterns in the US from the early 1990’s to the years after 2000. In fact, during the early 1990’s, Census was predicting peak population for the US might occur as early as 2025. This idea went by the wayside, however, as younger, more fertile Hispanic families took their place in the country.

Current UN forecasts indicate US population should increase in the medium fertility scenario from 312 million to 338 million and 363 million, respectively, by 2020 and 2030.

2020 and 2030 – Forecasts and Projections

I’d like to establish a context for discussing longer term forecasts, in this case to 2020 and 2030.

So, just below, I give you my take on 1990-2005. A lot happened that was unanticipated at the beginning of this period. One should expect, I think, the same to be true for 2015-2030.

Along those lines, I also suggest Big Picture factors that may come into play over the next fifteen or so years.

In coming posts, I want to summarize forecasts and projections I have seen for this period.

And I’m a little unusual in the technical forecasting community, since I’m equipped to do matrix programming, discuss boosting and bagging and so forth, and, on the other side of the aisle, weave together these stories and scenarios about process, causes, and factors. The quantitative is usually where I get paid, but, at the same time, I think it is easy to underestimate the benefit of trying to keep track of the Big Picture, the global dynamics, the political economy, and so forth.

1990-2005

The 1990’s rolled out with a nasty little recession in 1991 and voters throwing the first George Bush out of office, in favor of a clarinet-playing former Governor of Arkansas with a penchant for the ladies. Then, the United States experienced the longest period of economic prosperity since the 1960’s, fueled by the tech revolution and rise of the Internet. The breakup of the Soviet Union became official with democratic forms struggling to take root in Russia and former Soviet Republics. The US defense budget was cut about 40 percent from 1980 levels. Deregulation became a theme, and deregulation of telecoms led to burgeoning investments in telecom systems. The end of the decade saw the absurd Y2K problem, where details of computer clocks were supposed to stop everything at midnight, the turn of the century.

The New Millennium saw another recession in 2001, which was particularly sharp for the tech industry. Another Bush took the Presidency, after the Supreme Court intervened in the disputed General Election. Then there was 9/11 – September 11, 2001, with the destruction of the World Trade Center by large airliners being flown into the upper stories. This was a pivotal event. There was immediate surge in the military budget and in US military action in Afghanistan and then the invasion of Iraq, putatively because Saddam Hussein possessed “weapons of mass destruction.”

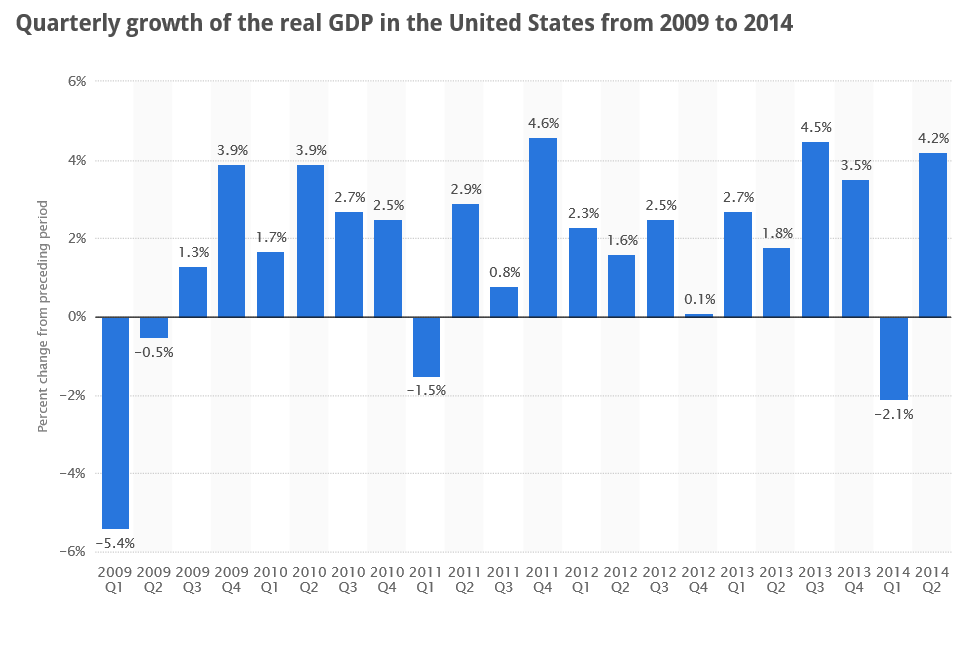
The US economy pretty much languished after the 2001-2002 recession, being stimulated to an extent by the rise in the defense budget, then by housing activity triggered by continued lowering of interest rates by the US Federal Reserve Bank under the redoubtable Alan Greenspan.

Another development that became especially noticeable after 2000 was the rise of China as a manufacturing and export power. The construction of the Shanghai skyline from the late 1990’s to the middle of the last decade was nothing less than stupendous.

The Importance of Technical Change

So what is important over a span of time? Are there underlying determinants?

I’ve got to believe technical change is an important element in historical process. If we take the fifteen year period sketched above, for example, a lot of the story is driven, at some level, by technical developments, especially in information technology (IT).

My favorite explanation of the collapse of the Soviet Union, for example, includes Silicon Valley as a key driver. The Soviet planned economy was a huge lumbering machine, compared to the nimble, change-oriented shops in the Valley, innovating new computer setups every few months. One immediate consequence was the US fighter aircraft came to totally dominate the old MIG planes, with their electronically guided missiles and tracking systems.

And to go on in this vein, focusing on the rise of US tech and then the movement of production to China is a strategic process for understanding the past couple of decades.

Big Picture Factors

Suffice it to say – new technology will be as much a driver of change in the next fifteen years, as it has been over the past fifteen.

Indeed, according to the futurist Ray Kurzweil, something called The Singularity stalks the human future. Perhaps around 2045, somewhat outside our forecast horizon in this discussion, technology will converge to completely outperform human intelligence. Commentators ranging from Stanislaus Ulam to Kurzweil believe that it is impossible to project human history beyond this point – hence the name.

Conventionally, this will involve biotechnology, computer technology, and robotics – but also could involve nanotechnology.

In any case, hefty doses of new technology may be necessary just to keep on a level course. I’m thinking, for example, of the diminishing effectiveness of antibiotics. So we have the evolution of “superbugs,” as well as the emergence of new epidemics through mutation or disease vectors jumping species lines. Ebola is a particularly gruesome example.

And while on technology, it is fair to observe that complex technologies just at or beyond the boundary of human control present deep challenges. Deep-sea oil drilling and the Gulf of Mexico oil spill, under British Petroleum, and the Fukishima nuclear disaster, still leaking radioactivity into the Pacific, are two examples.

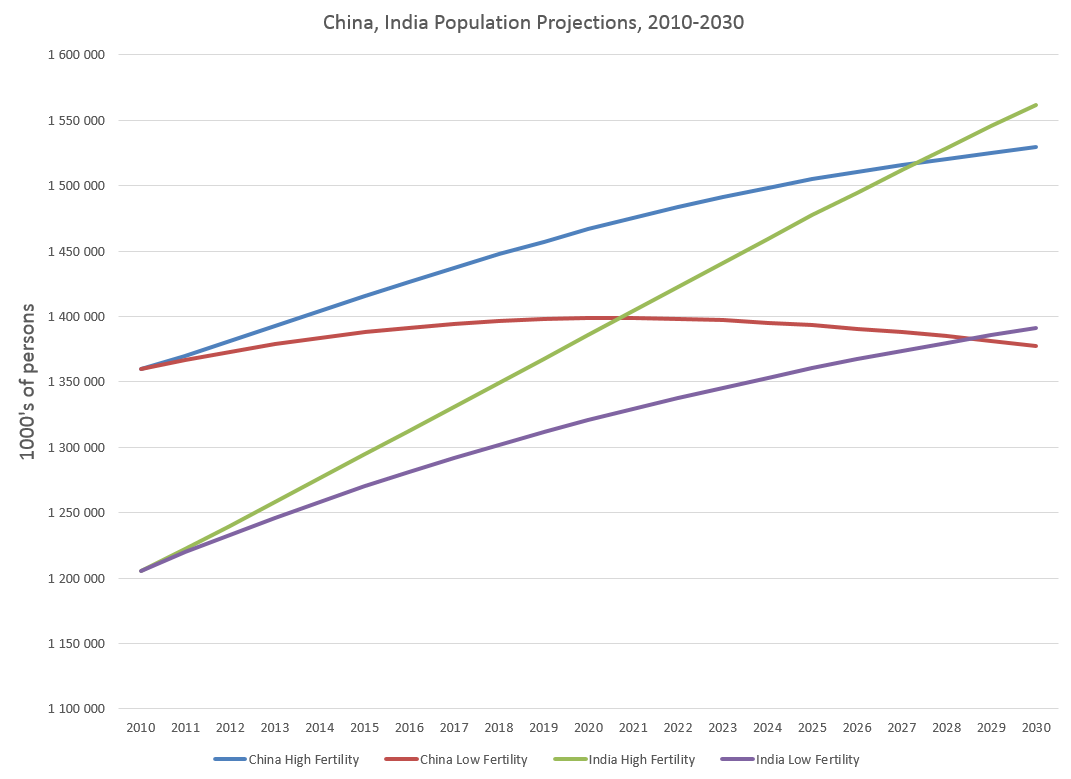
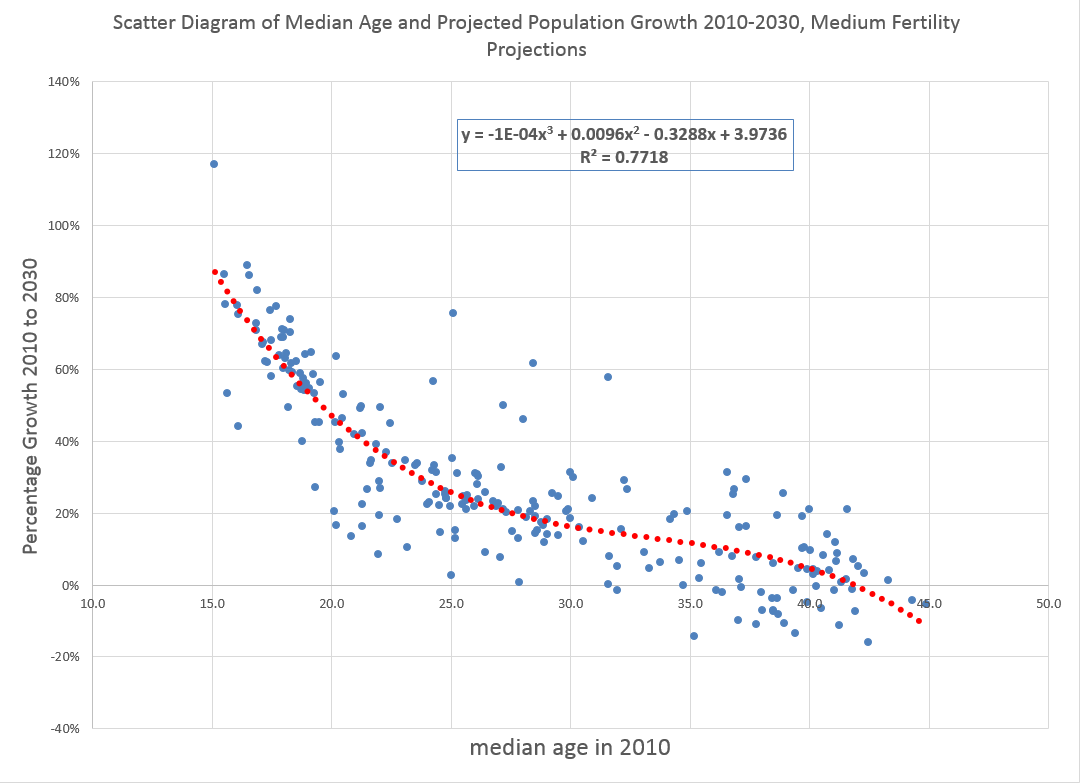
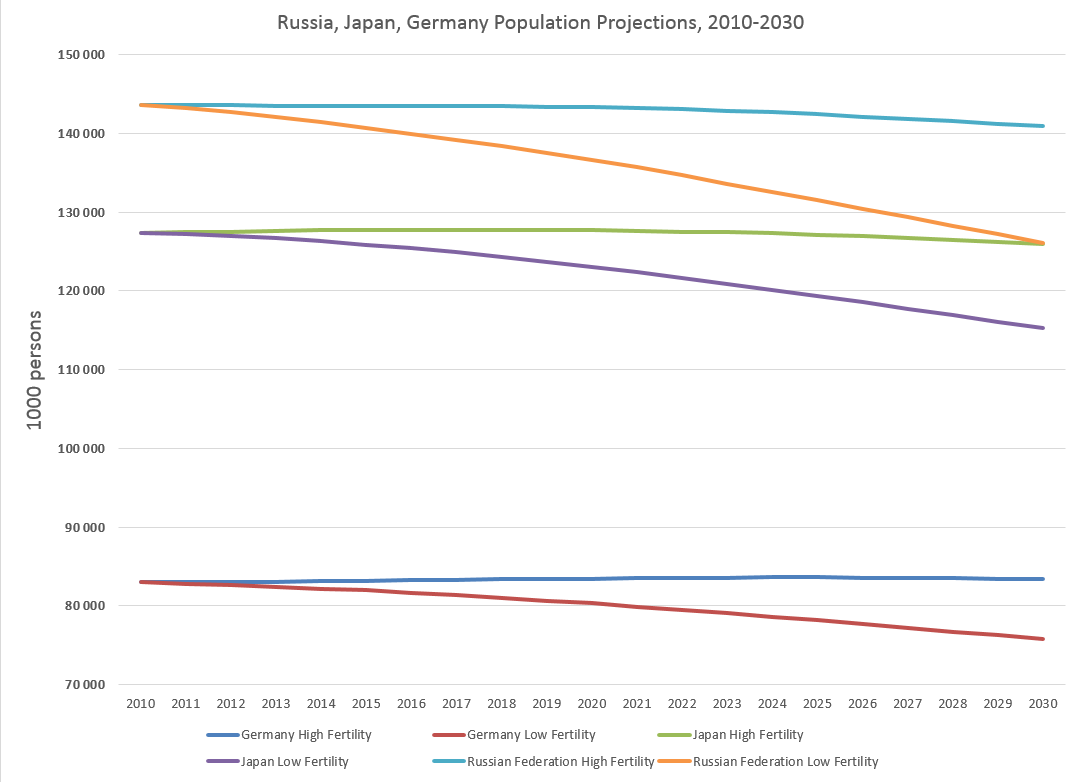
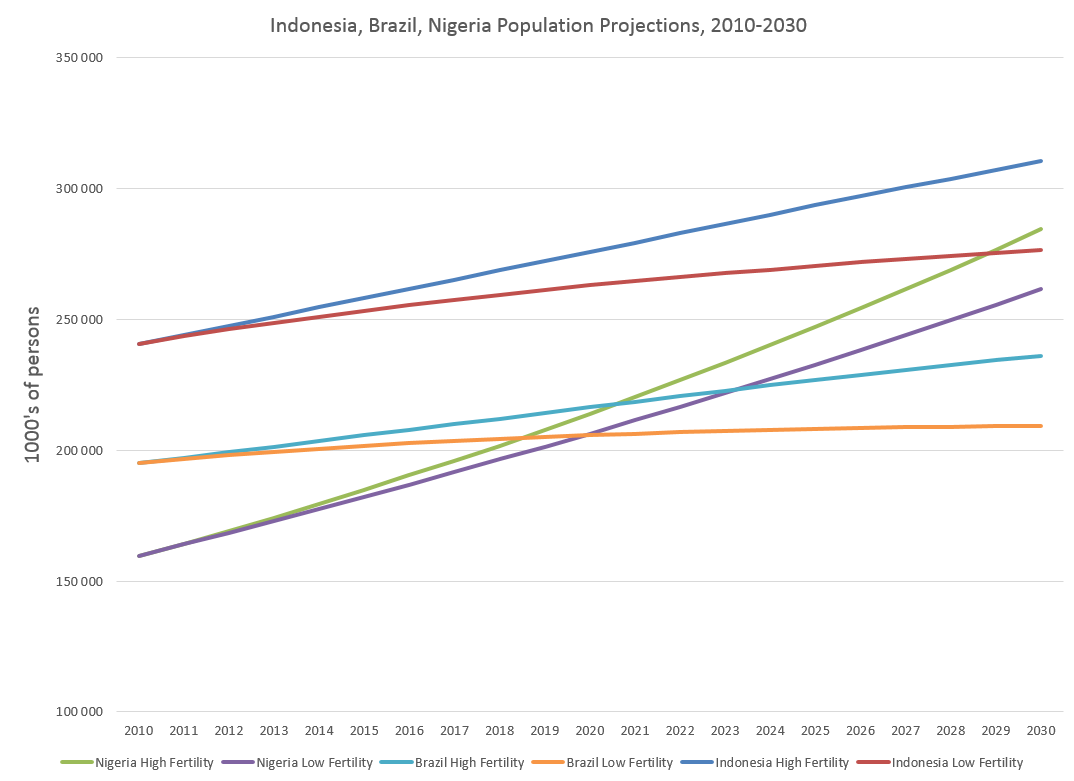
Population or more generally demography is another Big Picture factor. Populations are aging in the United States, Europe, and Japan, but also in China. And global population continues to grow, possibly by another billion by 2030.

Climate change is another Big Picture factor.

The global climate is a complex, dynamic system. There is lots of noise in the discussion and uncertainties, such as whether there may be a cooling interval, as carbon dioxide and methane concentrations continue to rise globally. A number of studies commissioned by US and other intelligence agencies, though, highlight the potential for massive impacts from, say, basic changes in monsoon patterns in South Asia.

In terms of geopolitics, I suspect the shift in the economic center of gravity to somewhere along the Asian rim is another Big Picture development.

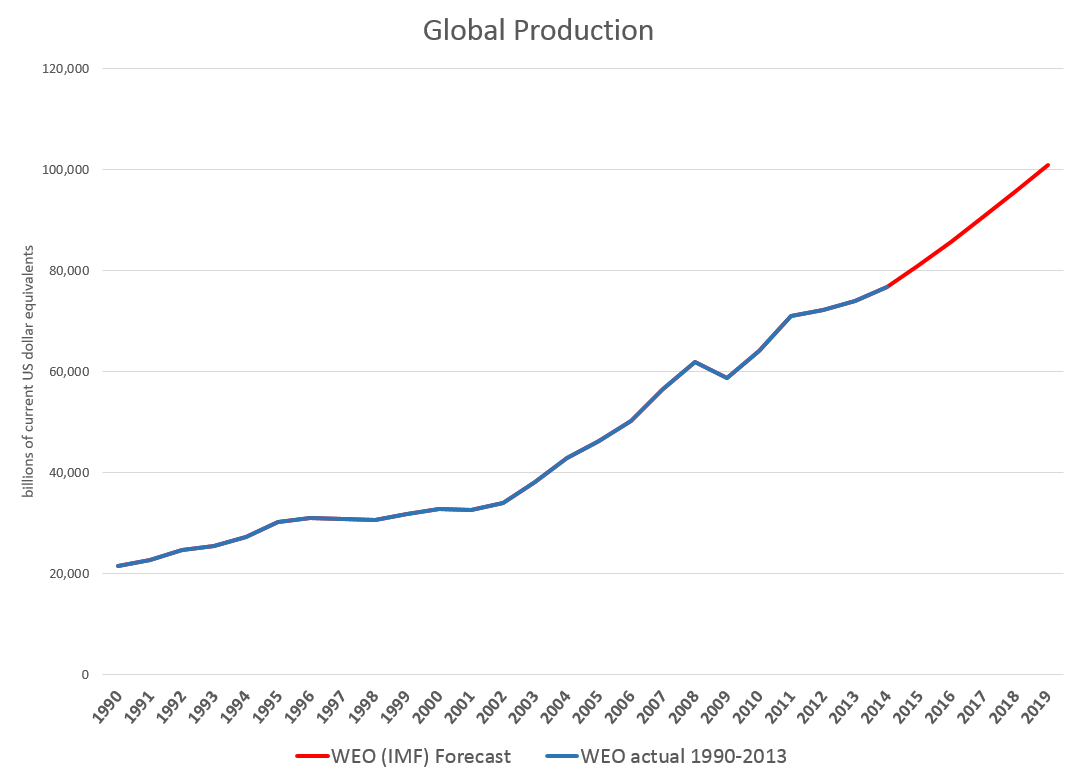
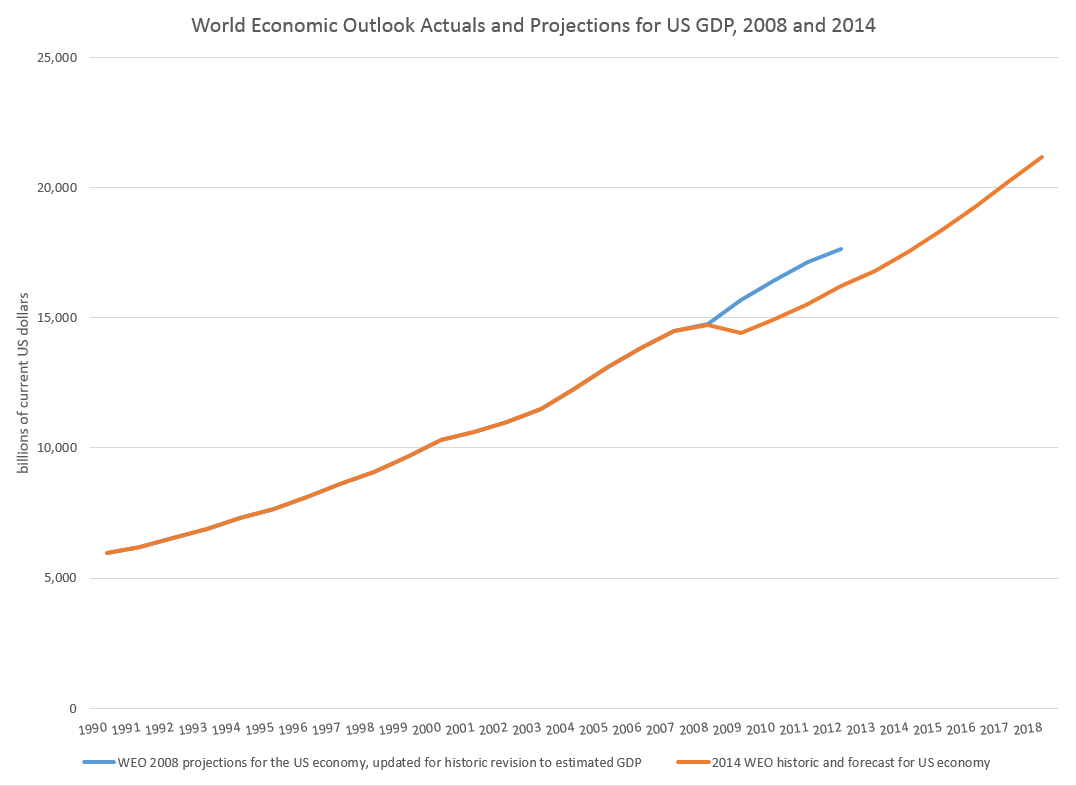
There are many relevant metrics. The proportion of global output produced by the United States, according to the World Economic Outlook (WEO) of the International Monetary Fund (IMF), will continue to diminuish, as Chinese growth in the worst case is projected to exceed levels of economic growth in the US and, certainly, in Europe.

Then, there is the issue of the US being the policeman of the world. At some point, the cost of maintaining a global span of military bases and force readiness for multiple theatres of action will weigh heavily on the US – as one could argue is already happening to some degree.

Challenges to the global dominance of the US dollar can be predicted, also, in the next fifteen years.

Sustainability

Whether any of the above “Big Picture” factors actually come into play by 2020 or 2030 is, of course, a speculation. But I think the basic technique of long term forecasting is to inventory possible influences like these. Then, you construct scenarios.

One thing appears certain. And that is there will be surprises.

In looking at forecasts for the next five to fifteen years, I also want to give thought to sustainability. Are there institutions and arrangements which could offer a backup to the various types of instabilities which could emerge?

And there is apparently an increasing chance of an increase in the general level of warfare, perhaps with linking of action in various theatres. I have to say, too, that I am poorly equipped to comment on these conflicts, although, as they ramp up, I attempt to learn more about the players and underlying dynamics.

I’ll be using this venue as a scratch-pad to record the projections of others and some thoughts I might have in response vis a vis 2020 and 2030.

Links – late August 2014

Economics Articles, Some Theoretical, Some Applied

Who’s afraid of inflation? Not Fed Chair Janet Yellen At Jackson Hole, Yellen speech on labor market conditions states that 2 percent inflation is not a hard ceiling for the Fed.

Economist’s View notes a new paper which argues that deflation is simply unnecessary, because the conditions for a “helicopter drop” of money (Milton Friedman’s metaphor) are widely met.

Three conditions must be satisfied for helicopter money always to boost aggregate demand. First, there must be benefits from holding fiat base money other than its pecuniary rate of return. Second, fiat base money is irredeemable – viewed as an asset by the holder but not as a liability by the issuer. Third, the price of money is positive. Given these three conditions, there always exists – even in a permanent liquidity trap – a combined monetary and fiscal policy action that boosts private demand – in principle without limit. Deflation, ‘lowflation’ and secular stagnation are therefore unnecessary. They are policy choices.

Stiglitz: Austerity ‘Dismal Failure,’ New Approach Needed

US housing market loses momentum

Fannie Mae economists have downgraded their expectations for the U.S. housing market in the second half of this year, even though they are more optimistic about the prospects for overall economic growth.

How Detroit’s Water Crisis Is Part Of A Much Bigger Problem

“Have we truly become a society to where we’ll go and build wells and stuff in third world countries but we’ll say to hell with our own right here up under our nose, our next door neighbors, the children that our children play with?”

Economic harassment and the Ferguson crisis

According to .. [ArchCity Defenders] recent report .. the Ferguson court is a “chronic offender” in legal and economic harassment of its residents….. the municipality collects some $2.6 million a year in fines and court fees, typically from small-scale infractions like traffic violations…the second-largest source of income for that small, fiscally-strapped municipality….

And racial profiling appears to be the rule. In Ferguson, “86% of vehicle stops involved a black motorist, although blacks make up just 67% of the population,” the report states. “After being stopped in Ferguson, blacks are almost twice as likely as whites to be searched (12.1% vs. 7.9%) and twice as likely to be arrested.” But those searches result in the discovery of contraband at a much lower rate than searches of whites.

Once the process begins, the system begins to resemble the no-exit debtors’ prisons of yore. “Clients reported being jailed for the inability to pay fines, losing jobs and housing as a result of the incarceration, being refused access to the Courts if they were with their children or other family members….

“By disproportionately stopping, charging, and fining the poor and minorities, by closing the Courts to the public, and by incarcerating people for the failure to pay fines, these policies unintentionally push the poor further into poverty, prevent the homeless from accessing the housing, treatment, and jobs they so desperately need to regain stability in their lives, and violate the Constitution.” And they increase suspicion and disrespect for the system.

… the Ferguson court processed the equivalent of three warrants and $312 in fines per household in 2013.

Science

Astronauts find living organisms clinging to the International Space Station, and aren’t sure how they got there

international-space-station-complete-640x408

A Mathematical Proof That The Universe Could Have Formed Spontaneously From Nothing

What caused the Big Bang itself? For many years, cosmologists have relied on the idea that the universe formed spontaneously, that the Big Bang was the result of quantum fluctuations in which the Universe came into existence from nothing.

1_INtAsuxJF7cMqoCBmesz-w

Big Data Trends In 2014 (infographic – click to enlarge)

Aureus-analytics-infographic-option-2

Video Friday – Ecommerce Trends

Trends for 2014

Matt made this at the end of 2013, but it hits the mark for what we are seeing this year. It’s only two minutes! Part of a series called ’Two Minute Tuesdays’, but of course we are showing it on a Friday.

But a lot of what you find on ecommerce is US-centric. This leads to the question –

Should We Be Afraid of Alibaba?

Alibaba is bigger than Amazon and eBay combined, leading to an alarmist Bloomberg article earlier this month Alibaba’s IPO May Herald the End of U.S. E-Commerce Dominance

Ecommerce Trends in China

This YouTube video is a test run of a talk given May 2014 in China, and contains some material at the beginning which I consider to be superfluous – biography of the presenter, etc. However, if you get beyond that, there are a lot of key stats presented in the slides and presentation. Valuable.

Will Online Retail Cannibalize Brick-and-mortar Sales?

Online retail or ecommerce is growing at three times the rate of retails sales generally (15 percent compared with 5 percent). And within online sales, mobile ecommerce is rocketing ahead by growth rates on the order of 25 percent per year in the US. Are these faster growing elements complementary to or cannibalizing conventional retail sales?

First, some stores – such as Blockbuster, Movie Gallery, Borders, and stores selling records and CD’s – are clearly casualties of Internet competition.

Other brick-and-mortar operations are following a multi-channel strategy, opening up online sales divisions parallel and in addition to their stores with goods on the shelves.

But the handwriting may be on the wall.

For one thing, in the 2013 holiday season, U.S. retailers saw approximately half the holiday foot traffic they experienced just three years ago.

And some of the foot traffic in brick-and-mortar stores is “showrooming” with practices highlighted in this infographic from Adweek (click to enlarge).

data-bargain-hunting-01-2013

And it’s significant a pure-play ecommerce provider like Amazon has risen to one of the ten largest retailers in the United States, with 2013 sales of $44 billion.

While Amazon is still back in the pack (see Table below), its annual growth rate is unsurpassed.

ranking

Bottom line – the “fulfillment center” may become a growing trend.

People like to see the product, especially if it is a larger ticket item.

Interestingly, Amazon is now opening fulfillment centers in key urban markets. Other formerly brick-and-mortar stores may repurpose some of their floor area to warehousing and fulfillment of customer orders.

Recognize, however, that we’re talking about $3-4 trillion in retail sales in the US, and the game on the ground is likely to change relatively slowly – over five or ten years.

Mobile e-commerce

Mobile ecommerce is no longer just another means consumers use to buy products online. It’s now the predominant way buyers visit ecommerce sites.

And mobile applications are radically changing the nature of shopping. The Emeritus founder of comScore, for example, highlights the two aspects of mobile ecommerce,

comScoreslide1

Examples of m-Shopping, according to Internet Retailer, include –

Online consumers use their smartphones and tablets for many shopping-related activities. In Q2 2013, 57% of smartphone users while in a retailer’s store visited that retailer’s site or app compared with 43% who consulted another company’s site or app, comScore says. The top reason consumers consulted retailers’ sites or apps was to compare prices. Among those smartphone users who went to the same retailer’s site, 59% wanted to see if there was an online discount available, the report says. Similarly, among those who checked a different retailer’s site, 92% wanted to see if they could get a better deal on price.

Smartphone owners also used their devices while in stores to take a picture of a product (23%), text or call family or friends about a product (17%), and send a picture of a product to family and friends (17%).

According to Gian Fulgoni, “m-Buying” is the predominant way shoppers now engage with retail brands online in the US.

comScore2

Growth, Adoption, and Use of Mobile E-Commerce explores patterns of mobile ecommerce with extensive data on eBay transactions.

One of the more interesting findings is that,

..adoption of the mobile shopping application is associated with both an immediate and sustained increase in total platform purchasing. The data also do not suggest that mobile application purchases are simply purchases that would have been made otherwise on the regular Internet platform.

The following chart illustrates this effect.

mobileplus

Finally. responsive web design seems to be a key to optimizing for mobile ecommerce.

Responsive web design is a process of making your website content adaptable to the size of the screen you are viewing it on. By doing so, you can optimise your site for mobile and tablet traffic, without the need to manage multiple templates, or separate content.

Sales and new product forecasting in data-limited (real world) contexts