Tag Archives: Global Business Forecasts

Mid-Year Economic Projections and Some Fireworks

Greetings and Happy Fourth of July! Always one of my favorite holidays.

Practically every American kid loves the Fourth, because there are fireworks. Of course, back in the day, we had cherry bombs and really big firecrackers. Lots of thumbs and fingers were blown off. But it’s still fun for kids, and safer no doubt.

Before that, here are two mid-year forecasts from Goldman Sachs’ Chief Economist Jan Hatzius and an equity outlook from Wells Fargo Bank.

Jan Hatzius Goldman Sachs – mid-year forecast (June 12) 

And Wells Fargo (June 23rd). 

Both these, unfortunately, did not have the information about the additional write-down of the 1st quarter real GDP that came out June 25, so we will be looking for futher updates.

Meanwhile, some fireworks.

First, Happy Fourth from the US Navy. 

And some ordinary fireworks from the National Mall, US Capitol, 2012. 

Links – early July 2014

While I dig deeper on the current business outlook and one or two other issues, here are some links for this pre-Fourth of July week.

Predictive Analytics

A bunch of papers about the widsom of smaller, smarter crowds I think the most interesting of these (which I can readily access) is Identifying Expertise to Extract the Wisdom of Crowds which develops a way by eliminating poorly performing individuals from the crowd to improve the group response.

Application of Predictive Analytics in Customer Relationship Management: A Literature Review and Classification From the Proceedings of the Southern Association for Information Systems Conference, Macon, GA, USA March 21st–22nd, 2014. Some minor problems with writing English in the article, but solid contribution.

US and Global Economy

Nouriel Roubini: There’s ‘schizophrenia’ between what stock and bond markets tell you Stocks tell you one thing, but bond yields suggest another. Currently, Roubini is guardedly optimistic – Eurozone breakup risks are receding, US fiscal policy is in better order, and Japan’s aggressively expansionist fiscal policy keeps deflation at bay. On the other hand, there’s the chance of a hard landing in China, trouble in emerging markets, geopolitical risks (Ukraine), and growing nationalist tendencies in Asia (India). Great list, and worthwhile following the links.

The four stages of Chinese growth Michael Pettis was ahead of the game on debt and China in recent years and is now calling for reduction in Chinese growth to around 3-4 percent annually.

Because of rapidly approaching debt constraints China cannot continue what I characterize as the set of “investment overshooting” economic polices for much longer (my instinct suggests perhaps three or four years at most). Under these policies, any growth above some level – and I would argue that GDP growth of anything above 3-4% implies almost automatically that “investment overshooting” policies are still driving growth, at least to some extent – requires an unsustainable increase in debt. Of course the longer this kind of growth continues, the greater the risk that China reaches debt capacity constraints, in which case the country faces a chaotic economic adjustment.

Politics

Is This the Worst Congress Ever? Barry Ritholtz decries the failure of Congress to lower interest rates on student loans, observing –

As of July 1, interest on new student loans rises to 4.66 percent from 3.86 percent last year, with future rates potentially increasing even more. This comes as interest rates on mortgages and other consumer credit hovered near record lows. For a comparison, the rate on the 10-year Treasury is 2.6 percent. Congress could have imposed lower limits on student-loan rates, but chose not to.

This is but one example out of thousands of an inability to perform the basic duties, which includes helping to educate the next generation of leaders and productive citizens. It goes far beyond partisanship; it is a matter of lack of will, intelligence and ability.

Hear, hear.

Climate Change

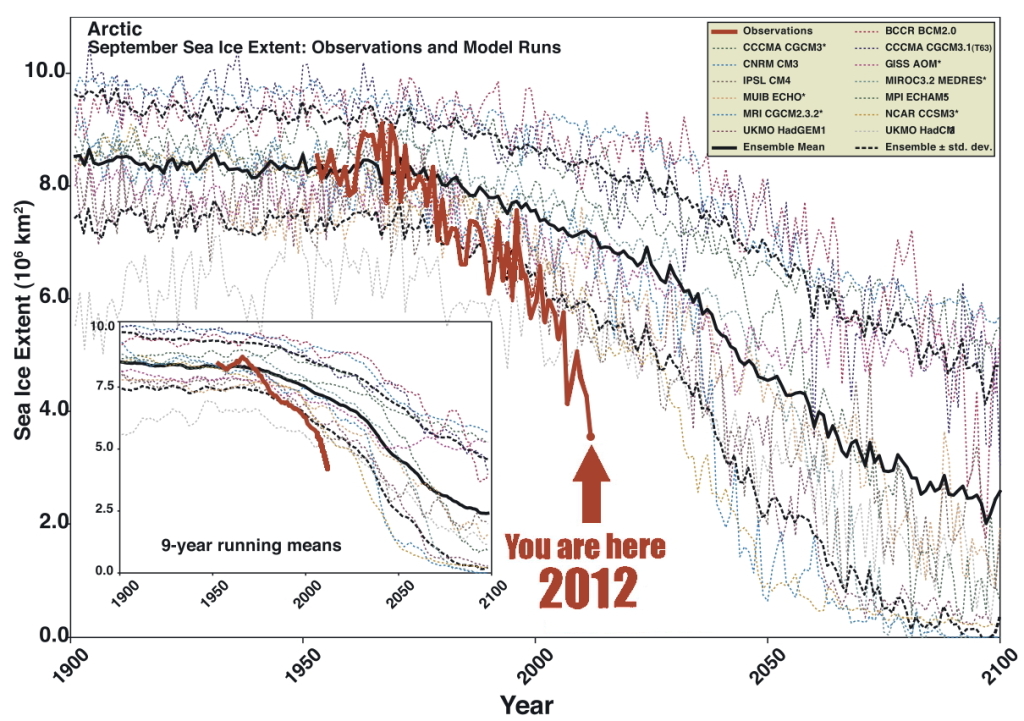
Climate news: Arctic seafloor methane release is double previous estimates, and why that matters This is a ticking time bomb. Article has a great graphic (shown below) which contrasts the projections of loss of Artic sea ice with what actually is happening – underlining that the facts on the ground are outrunning the computer models. Methane has more than an order of magnitude more global warming impact that carbon dioxide, per equivalent mass.

ArcticSeaIce

Dahr Jamail | Former NASA Chief Scientist: “We’re Effectively Taking a Sledgehammer to the Climate System”

I think the sea level rise is the most concerning. Not because it’s the biggest threat, although it is an enormous threat, but because it is the most irrefutable outcome of the ice loss. We can debate about what the loss of sea ice would mean for ocean circulation. We can debate what a warming Arctic means for global and regional climate. But there’s no question what an added meter or two of sea level rise coming from the Greenland ice sheet would mean for coastal regions. It’s very straightforward.

Machine Learning

EG

Computer simulating 13-year-old boy becomes first to pass Turing test A milestone – “Eugene Goostman” fooled more than a third of the Royal Society testers into thinking they were texting with a human being, during a series of five minute keyboard conversations.

The Milky Way Project: Leveraging Citizen Science and Machine Learning to Detect Interstellar Bubbles Combines Big Data and crowdsourcing.

Prospects for the 2nd Quarter 2014 and the Rest of the Year

Well, it’s the first day of the 3rd quarter 2014, and time to make an assessment of what happened in Q2 and also what is likely to transpire the rest of the year.

The Big Write-Down

Of course, the 1st quarter 2014 numbers were surprisingly negative – and almost no one saw that coming. Last Wednesday (June 25) the Bureau of Economic Analysis (BEA) revised last estimates of 1st quarter real GDP down a -2.9 percent decrease on a quarter-by-quarter basis.

The Accelerating Growth Meme

Somehow media pundits and the usual ranks of celebrity forecasters seem heavily invested in the “accelerating growth” meme in 2014.

Thus, in mid-June Mark Zandi of Moody’s tries to back up Moody’s Analytics U.S. Macro Forecast calling for accelerating growth the rest of the year, writing,

The economy’s strength is increasingly evident in the job market. Payroll employment rose to a new high in May as the U.S. finally replaced all of the 8.7 million jobs lost during the recession, and job growth has accelerated above 200,000 per month since the start of the year. The pace of job creation is almost double that needed to reduce unemployment, even with typical labor force gains. More of the new positions are also better paying than was the case earlier in the recovery.

After the BEA released its write-down numbers June 25, the Canadian Globe and Mail put a happy face on everything, writing that The US Economy is Back on Track since,

Hiring, retail sales, new-home construction and consumer confidence all rebounded smartly this spring. A separate government report Wednesday showed inventories for non-defense durable goods jumped 1 per cent in May after a 0.4-per-cent increase the previous month.

Forecasts for the Year Being Cut-Back

On the other hand, the International Monetary Fund (IMF) cut its forecast for US growth,

In its annual review of the U.S. economy, the IMF cut its forecast for U.S. economic growth this year by 0.8 percentage point to 2%, citing a harsh winter, a struggling housing market and weak international demand for the country’s products.

Some Specifics

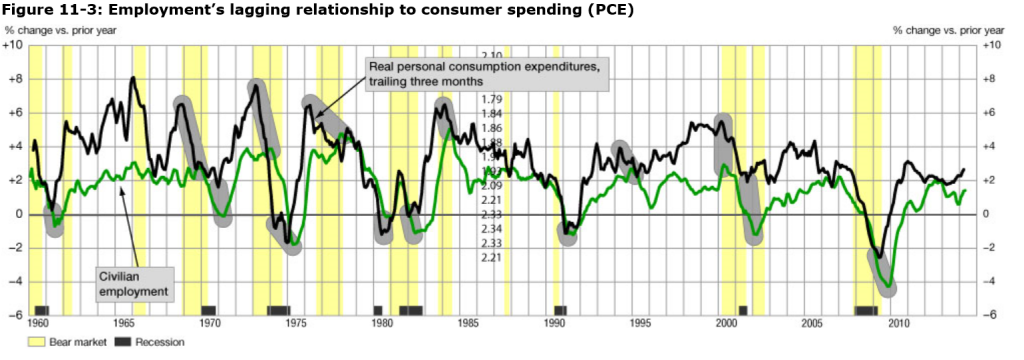
The first thing to understand in this context is that employment is usually a lagging indicator of the business cycle. Ahead of the Curve makes this point dramatically with the following chart.

employment

The chart shows employment change and growth lag changes in the business cycle. Thus, note that the green line peaks after growth in personal consumption expenditures in almost every case, where these growth rates are calculated on a year-over-year basis.

So Zandi’s defense of the Moody’s Analytics accelerating growth forecast for the rest of 2014 has to be taken with a grain of salt.

It really depends on other things – whether for example, retail sales are moving forward, what’s happening in the housing market (to new-home construction and other variables), also to inventories and durable goods spending. Also have exports rebounded, and imports (a subtraction from GDP) been reined in?

Retail Sales

If there is going to be accelerating economic growth, consumer demand, which certainly includes retail sales, has to improve dramatically.

However, the picture is mixed with significant rebound in sales in April, but lower-than-expected retail sales growth in May.

Bloomberg’s June take on this is in an article Cooling Sales Curb Optimism on U.S. Growth Rebound: Economy.

The US Census report estimates U.S. retail and food services sales for May, adjusted for seasonal variation and holiday and trading-day differences, but not for price changes, were $437.6 billion, an increase of 0.3 percent (±0.5)* from the previous month.

Durable Goods Spending

In the Advance Report on Durable Goods Manufacturers’ Shipments, Inventories and Orders May 2014 we learn that,

New orders for manufactured durable goods in May decreased $2.4 billion or 1.0 percent to $238.0 billion, the U.S. Census Bureau announced today.

On the other hand,

Shipments of manufactured durable goods in May, up four consecutive months, increased $0.6 billion or 0.3 percent to $238.6 billion

Of course, shipments are a lagging indicator of the business cycle.

Finally, inventories are surging –

Inventories of manufactured durable goods in May, up thirteen of the last fourteen months, increased $3.8 billion or 1.0 percent to $397.8 billion. This was at the highest level since the series was first published on a NAICS basis and followed a 0.3 percent April increase.

Inventory accumulation is a coincident indicator (in a negative sense) of the business cycle, according to NBER documents.

New Home Construction

From the Joint Release U.S. Department of Housing and Urban Development,

Privately-owned housing units authorized by building permits in May were at a seasonally adjusted annual rate of 991,000. This is 6.4 percent (±0.8%) below the revised April rate of 1,059,000 and is 1.9 percent (±1.4%) below the May 2013 estimate of 1,010,000…

Privately-owned housing starts in May were at a seasonally adjusted annual rate of 1,001,000. This is 6.5 percent (±10.2%)* below the

revised April estimate of 1,071,000, but is 9.4 percent (±11.0%)* above the May 2013 rate of 915,000.

Single-family housing starts in May were at a rate of 625,000; this is 5.9 percent (±12.7%)* below the revised April figure of 664,000.

No sign of a rebound in new home construction in these numbers.

Exports and Imports

The latest BEA report estimates,

April exports were $0.3 billion less than March exports of $193.7 billion. April imports were $2.7 billion more than March imports of $237.8 billion

Here is a several month perspective.

XM

Essentially, the BEA trade numbers suggest the trade balance deteriorated March to April with a sharp uptick in imports and a slight drop in exports.

Summary

Well, it’s not a clear picture. The economy is teetering on the edge of a downturn, which it may still escape.

Clearly, real growth in Q2 has to be at least 2.9 percent in order to counterbalance the drop in Q1, or else the first half of 2014 will show a net decrease.

CNN offers this with an accompanying video

Goldman Sachs economists trimmed second quarter tracking GDP to 3.5 percent from 4.1 percent, and Barclays economists said tracking GDP for the second quarter fell to 2.9 percent from 4 percent. At a pace below 3 percent, the economy could show contraction for the first half due to the steep first quarter decline of 2.9 percent.

top picture http://www.bbc.com/news/magazine-24045598

Surprising Revision of First Quarter GDP

I showed a relative this blog a couple of days ago, and, wanting “something spicy,” I pulled up The Record of Failure to Predict Recessions is Virtually Unblemished. The lead picture, as for this post, is Peter Sellers in his role as “Chauncey Gardiner” in Being There. Sellers played a simpleton mistaken for a savant, who would say things that everyone thought was brilliant, such as “There will be growth in the Spring.”

Well, last Wednesday, the US Bureau of Economic Analysis released a third revision of its estimate of the 1st quarter 2014 real GDP growthdown from an initial estimate of a positive .1 percent to -2.9 percent growth at an annual rate.

The BEA News Release says,

Real gross domestic product — the output of goods and services produced by labor and property located in the United States — decreased at an annual rate of 2.9 percent in the first quarter of 2014 according to the “third” estimate released by the Bureau of Economic Analysis….

The decrease in real GDP in the first quarter primarily reflected negative contributions from private inventory investment, exports, state and local government spending, nonresidential fixed investment, and residential fixed investment that were partly offset by a positive contribution from PCE. Imports, which are a subtraction in the calculation of GDP, increased.

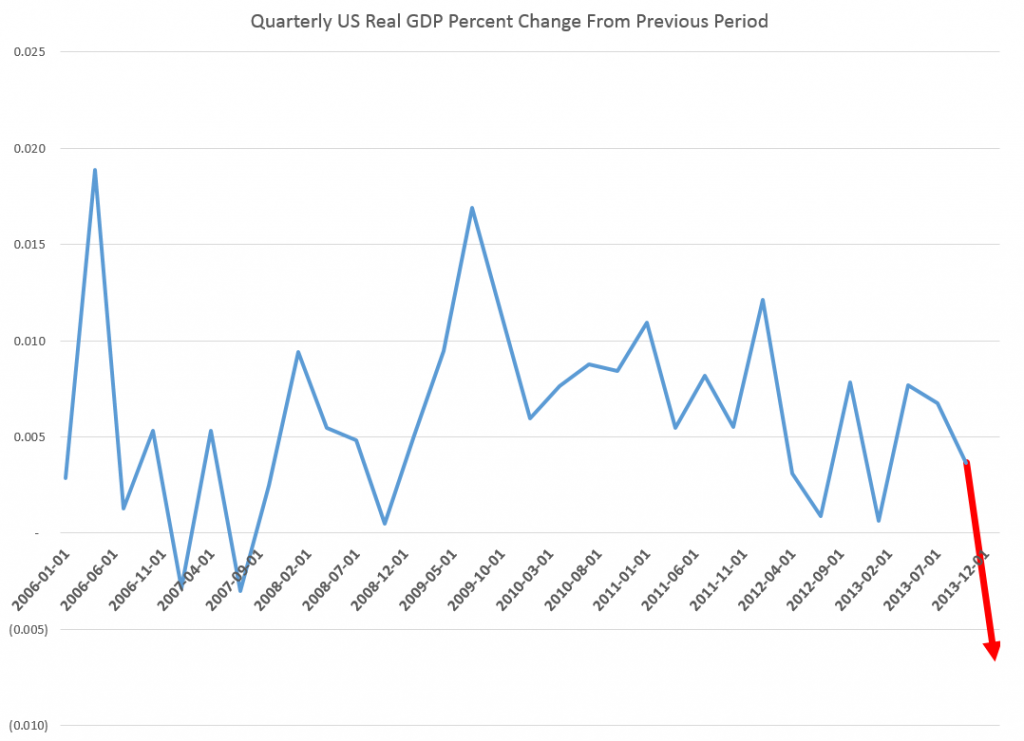
Looking at this graph of quarterly real GDP growth rates for the past several years, it’s clear that a -2.9 percent quarter-over-quarter change is a significant size.

usgdpchartcustom

Again, macroeconomic forecasters were caught off guard.

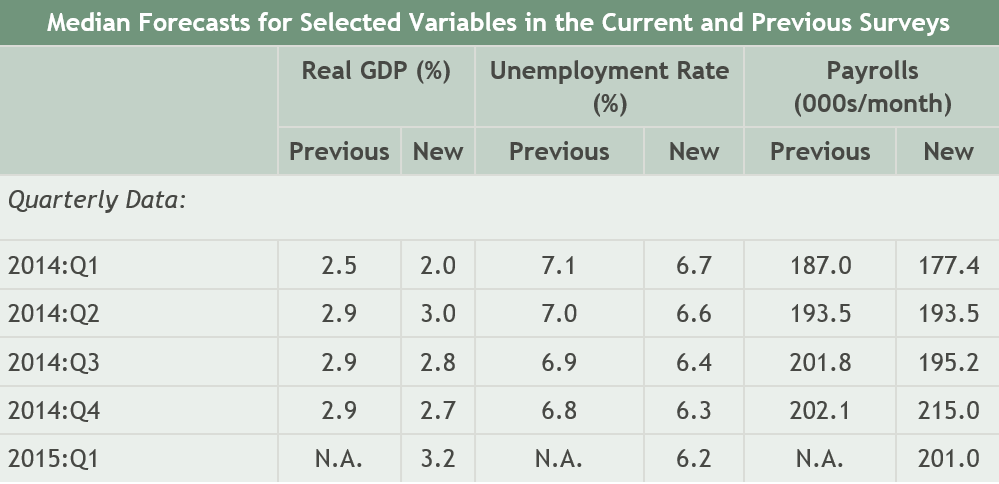
In February of this year, the Survey of Professional Forecasters released its 1st Quarter 2014 consensus forecasts with numbers like –

SPF

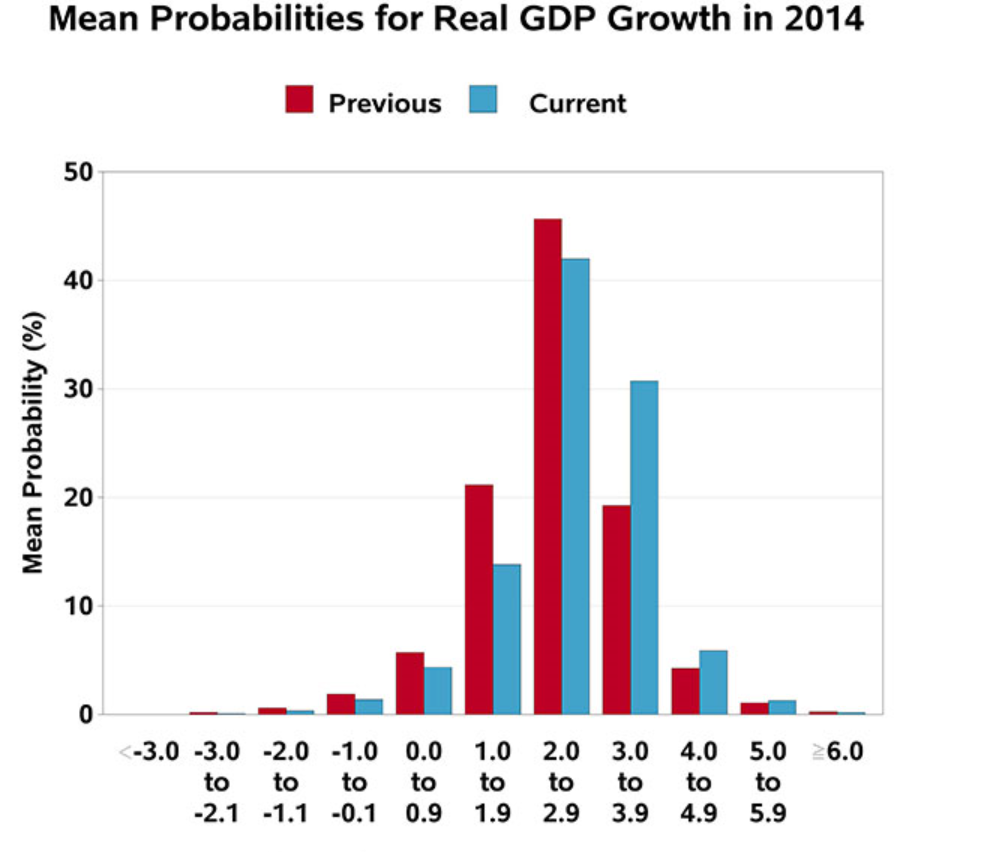
Some SPF participants do predict 2014 overall will be a year of recession, as the following chart shows, but they are a tiny minority.

spfrange

A downward revision of almost 3 percentage points on the part of the BEA and almost 5 percent change for the median SPF forecast is poor performance indeed.

One hears things sped up in Q2, but on what basis I do not really know – and I am thinking of tracking key markets in future posts, such as housing, consumer spending, and so forth.

My feeling is that the quandary of the Fed – its desperate need to wind down asset purchases and restore interest rates to historic levels –creates an environment for a kind of “happy talk.”

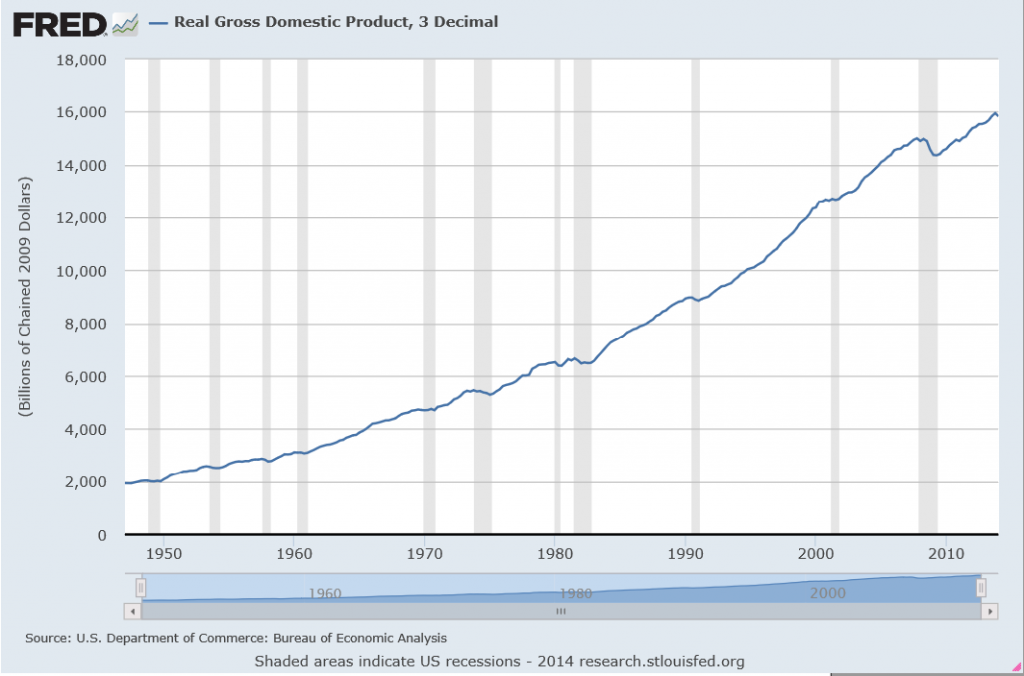
Here’s some history on the real GDP.

USGDPnew


Business Forecasting – Some Thoughts About Scope

In many business applications, forecasting is not a hugely complex business. For a sales forecasting, the main challenge can be obtaining the data, which may require sifting through databases compiled before and after mergers or other reorganizations. Often, available historical data goes back only three or four years, before which time product cycles make comparisons iffy. Then, typically, you plug the sales data into an automatic forecasting program, one that can assess potential seasonality, and probably employing some type of exponential smoothing, and, bang, you produce forecasts for one to several quarters going forward.

The situation becomes more complex when you take into account various drivers and triggers for sales. The customer revenues and income are major drivers, which lead into assessments of business conditions generally. Maybe you want to evaluate the chances of a major change in government policy or the legal framework – both which are classifiable under “triggers.” What if the Federal Reserve starts raising the interest rates, for example.

For many applications, a driver-trigger matrix can be useful. This is a qualitative tool for presentations to management. Essentially, it helps keep track of assumptions about the scenarios which you expect to unfold from which you can glean directions of change for the drivers – GDP, interest rates, market conditions. You list the major influences on sales in the first column. In the second column you indicate the direction of this influences (+/-) and in the third column you put in the expected direction of change, plus, minus, or no change.

The next step up in terms of complexity is to collect historical data on the drivers and triggers – “explanatory variables” driving sales in the company. This opens the way for a full-blown multivariate model of sales performance. The hitch is to make this operational, you have to forecast the explanatory variables. Usually, this is done by relying, again, on forecasts by other organizations, such as market research vendors, consensus forecasts such as available from the Survey of Professional Forecasters and so forth. Sometimes it is possible to identify “leading indicators” which can be built into multivariate models. This is really the best of all possible worlds, since you can plug in known values of drivers and get a prediction for the target variable.

The value of forecasting to a business is linked with benefits of improvements in accuracy, as well as providing a platform to explore “what-if’s,” supporting learning about the business, customers, and so forth.

With close analysis, it is often possible to improve the accuracy of sales forecasts by a few percentage points. This may not sound like much, but in a business with $100 million or more in sales, competent forecasting can pay for itself several times over in terms of better inventory management and purchasing, customer satisfaction, and deployment of resources.

Time Horizon

When you get a forecasting assignment, you soon learn about several different time horizons. To some extent, each forecasting time horizon is best approached with certain methods and has different uses.

Conventionally, there are short, medium, and long term forecasting horizons.

In general business applications, the medium term perspective of a few quarters to a year or two is probably the first place forecasting is deployed. The issue is usually the budget, and allocating resources in the organization generally. Exponential smoothing, possibly combined with information about anticipated changes in key drivers, usually works well in this context. Forecast accuracy is a real consideration, since retrospectives on the budget are a common practice. How did we do last year? What mistakes were made? How can we do better?

The longer term forecast horizons of several years or more usually support planning, investment evaluation, business strategy. The M-competitions suggest the issue has to be being able to pose and answer various “what-if’s,” rather than achieving a high degree of accuracy. Of course, I refer here to the finding that forecast accuracy almost always deteriorates in direct proportion to the length of the forecast horizon.

Short term forecasting of days, weeks, a few months is an interesting application. Usually, there is an operational focus. Very short term forecasting in terms of minutes, hours, days is almost strictly a matter of adjusting a system, such as generating electric power from a variety of sources, i.e. combining hydro and gas fired turbines, etc.

As far as techniques, short term forecasting can get sophisticated and mathematically complex. If you are developing a model for minute-by-minute optimization of a system, you may have several months or even years of data at your disposal. There are, thus, more than a half a million minutes in a year.

Forecasting and Executive Decisions

The longer the forecasting horizon, the more the forecasting function becomes simply to “inform judgment.”

A smart policy for an executive is to look at several forecasts, consider several sources of information, before determining a policy or course of action. Management brings judgment to bear on the numbers. It’s probably not smart to just take the numbers on blind faith. Usually, executives, if they pay attention to a presentation, will insist on a coherent story behind the model and the findings, and also checking the accuracy of some points. Numbers need to compute. Round-off-errors need to be buried for purposes of the presentation. Everything should add up exactly.

As forecasts are developed for shorter time horizons and more for direct operation control of processes, acceptance and use of the forecast can become more automatic. This also can be risky, since developers constantly have to ask whether the output of the model is reasonable, whether the model is still working with the new data, and so forth.

Shiny New Techniques

The gap between what is theoretically possible in data analysis and what is actually done is probably widening. Companies enthusiastically take up the “Big Data” mantra – hiring “Chief Data Scientists.” I noticed with amusement an article in a trade magazine quoting an executive who wondered whether hiring a data scientist was something like hiring a unicorn.

There is a lot of data out there, more all the time. More and more data is becoming accessible with expansion of storage capabilities and of course storage in the cloud.

And really the range of new techniques is dazzling.

I’m thinking, for example, of bagging and boosting forecast models. Or of the techniques that can be deployed for the problem of “many predictors,” techniques including principal component analysis, ridge regression, the lasso, and partial least squares.

Probably one of the areas where these new techniques come into their own is in target marketing. Target marketing is kind of a reworking of forecasting. As in forecasting sales generally, you identify key influences (“drivers and triggers”) on the sale of a product, usually against survey data or past data on customers and their purchases. Typically, there is a higher degree of disaggregation, often to the customer level, than in standard forecasting.

When you are able to predict sales to a segment of customers, or to customers with certain characteristics, you then are ready for the sales campaign to this target group. Maybe a pricing decision is involved, or development of a product with a particular mix of features. Advertising, where attitudinal surveys supplement customer demographics and other data, is another key area.

Related Areas

Many of the same techniques, perhaps with minor modifications, are applicable to other areas for what has come to be called “predictive analytics.”

The medical/health field has a growing list of important applications. As this blog tries to show, quantitative techniques, such as logistic regression, have a lot to offer medical diagnostics. I think the extension of predictive analytics to medicine and health care ism at this point, merely a matter of access to the data. This is low-hanging fruit. Physicians diagnosing a guy with an enlarged prostate and certain PSA and other metrics should be able to consult a huge database for similarities with respect to age, health status, collateral medical issues and so forth. There is really no reason to suspect that normally bright, motivated people who progress through medical school and come out to practice should know the patterns in 100,000 medical records of similar cases throughout the nation, or have read all the scientific articles on that particular niche. While there are technical and interpretive issues, I think this corresponds well to what Nate Silver identifies as promising – areas where application of a little quantitative analysis and study can reap huge rewards.

And cancer research is coming to be closely allied with predictive analytics and data science. The paradigmatic application is the DNA assay, where a sample of a tumor is compared with healthy tissue from the same individual to get an idea of what cancer configuration is at play. Indeed, at that fine new day when big pharma will develop hundreds of genetically targeted therapies for people with a certain genetic makeup with a certain cancer – when that wonderful new day comes – cancer treatment may indeed go hand in hand with mathematical analysis of the patient’s makeup.

Energy Forecasts – Parting Shots

There is obviously a big difference between macro and micro, when it comes to energy forecasting.

At the micro-level – for example, electric utility load forecasting – considerable precision often can be attained in the short run, or very short run, when seasonal, daily, and holiday usage patterns are taken into account.

At the macro level, on the other hand – for global energy supply, demand, and prices – big risks are associated with projections beyond a year or so. Many things can intervene, such as supply disruptions which in 2013, occurred in Nigeria, Iraq, and Lybia. And long range energy forecasts – forget it. Even well-funded studies with star researchers from the best universities and biggest companies show huge errors ten or twenty years out (See A Half Century of Long-Range Energy Forecasts: Errors Made, Lessons Learned, and Implications for Forecasting).

Peak Oil

This makes big picture concepts such as peak oil challenging to evaluate. Will there be a time in the future when global oil production levels peak and then decline, triggering a frenzied search for substitutes and exerting pressure on the whole structure of civilization in what some have called the petrochemical age?

Since the OPEC Oil Embargo of 1974, there have been researchers, thinkers, and writers who point to this as an eventuality. Commentators and researchers associated with the post carbon institute carry on the tradition.

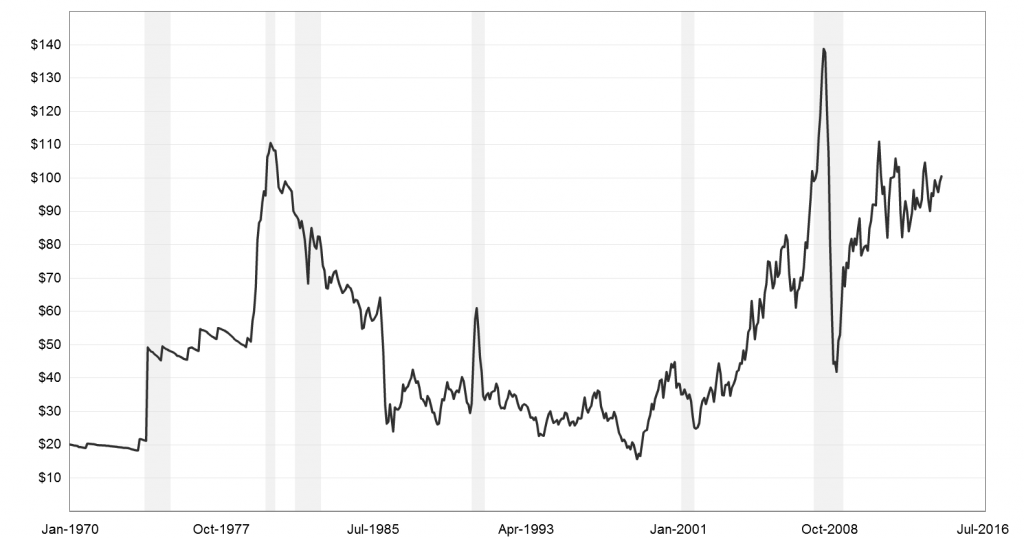
Oil prices have not always cooperated, as the following CPI-adjusted price of crude oil suggests.

oilprice

The basic axiom is simply that natural resource reserves and availability are always conditional on price. With high enough prices, more oil can be extracted from somewhere – from deeper wells, from offshore platforms that are expensive and dangerous to erect, from secondary recovery, and now, from nonconventional sources, such as shale oil and gas.

Note this axiom of resource economics does not really say that there will never be a time when total oil production begins to decline. It just implies that oil will never be totally exhausted, if we loosen the price constraint.

Net Energy Analysis

Net energy analysis provides a counterpoint to the peak oil conversation. In principle, we can calculate the net energy contributions of various energy sources today. No forecasting is really necessary. Just a deep understanding of industrial process and input-output relationships.

Along these lines, several researchers and again David Hughes with the post carbon institute project that the Canadian tar sands have a significantly lower net energy contribution that, say, oil from conventional wells.

Net energy analysis resembles life cycle cost analysis, which has seen widespread application in environmental assessment. Still neither technique is foolproof, or perhaps I should say that both techniques would require huge research investments, including on-site observation and modeling, to properly implement.

Energy Conservation

Higher energy prices since the 1970’s also have encouraged increasing energy efficiency. This is probably one of the main reasons why long range energy projections from, say, the 1980’s usually look like wild overestimates by 2000.

The potential is still there, as a 2009 McKinsey study documents –

The research shows that the US economy has the potential to reduce annual non-transportation energy consumption by roughly 23 percent by 2020, eliminating more than $1.2 trillion in waste—well beyond the $520 billion upfront investment (not including program costs) that would be required. The reduction in energy use would also result in the abatement of 1.1 gigatons of greenhouse-gas emissions annually—the equivalent of taking the entire US fleet of passenger vehicles and light trucks off the roads.

The McKinsey folks are pretty hard-nosed, tough-minded, not usually given to gross exaggerations.

A Sense In Which We May Already Have Reached Peak Oil

Check this YouTube out. Steven Kopits’ view of supply-constrained markets in oil is novel, but his observations about dollar investment to conventional oil output seem to hit the mark. The new oil production is from the US in large part, and comes from nonconventional sources, i.e. shale oil. This requires more effort, as witnessed by the poor financials of a lot of these players, who are speculating on expansion of export markets, but who would go bust at current domestic prices.

For Kopits slides go here. Check out these graphs from the recent BP report, too.

Highlights of National and Global Energy Projections

Christof Rühl – Group Chief Economist at British Petroleum (BP) just released an excellent, short summary of the global energy situation, focused on 2013.

Ruhl

Rühl’s video is currently only available on the BP site at –

http://www.bp.com/en/global/corporate/about-bp/energy-economics/statistical-review-of-world-energy.html

Note the BP Statistical Review of World Energy June 2014 was just released (June 16).

Highlights include –

  • Economic growth is one of the biggest determinants of energy growth. This means that energy growth prospects in Asia and other emerging markets are likely to dominate slower growth in Europe – where demand is actually less now than in 2005 – and the US.
  • Tradeoffs and balancing are a theme of 2013. While oil prices remained above $100/barrel for the third year in a row, seemingly stable, underneath two forces counterbalanced one another – expanding production from shale deposits in the US and an increasing number of supply disruptions in the Middle East and elsewhere.
  • 2013 saw a slowdown in natural gas demand growth with coal the fastest growing fuel. Growth in shale gas is slowing down, partly because of a big price differential between gas and oil.
  • While CO2 emissions continue to increase, the increased role of renewables or non-fossil fuels (including nuclear) have helped hold the line.
  • The success story of the year is that the US is generating new fuels, improving its trade position and trade balance with what Rühl calls the “shale revolution.”

The BP Statistical Reviews of World Energy are widely-cited, and, in my mind, rank alongside the Energy Information Agency (EIA) Annual Energy Outlook and the International Energy Agency’s World Energy Outlook. The EIA’s International Energy Outlook is another frequently-cited document, scheduled for update in July.

Price is the key, but is difficult to predict

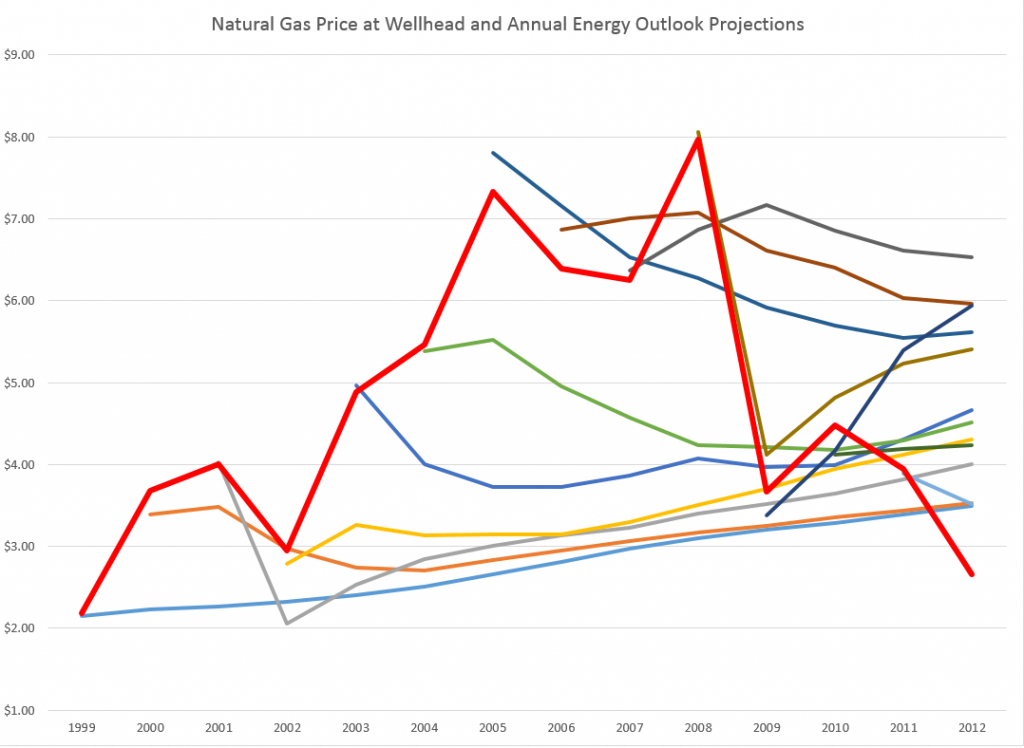
The EIA, to its credit, publishes a retrospective on the accuracy of its forecasts of prices, demand and production volumes. The latest is on a page called Annual Energy Outlook Retrospective Review which has a revealing table showing the EIA projections of the price of natural gas at wellhead and actual figures (as developed from the Monthly Energy Review).

I pulled together a graph showing the actual nominal price at the wellhead and the EIA forecasts.

natgasforecasterrorgraph

The solid red line indicates actual prices. The horizontal axis shows the year for which forecasts are made. The initial value in any forecast series is nowcast, since wellhead prices are available at only a year lag. The most accurate forecasts were for 2008-2009 in the 2009 and 2010 AEO documents, when the impact of the severe recession was already apparent.

Otherwise, the accuracy of the forecasts is completely underwhelming.

Indeed, the EIA presents another revealing chart showing the absolute percentage errors for the past two decades of forecasts. Natural gas prices show up with more than 30 percent errors, as do imported oil prices to US refineries.

Predicting Reserves Without Reference to Prices

Possibly as a result of the difficulty of price projections, the EIA apparently has decoupled the concept of Technically Recoverable Resources (TRR) from price projections.

This helps explain how you can make huge writedowns of TRR in the Monterey Shale without affecting forecasts of future shale oil and gas production.

Thus in Assumptions to AEO2014 and the section called the Oil and Gas Supply Module, we read –

While technically recoverable resources (TRR) is a useful concept, changes in play-level TRR estimates do not necessarily have significant implications for projected oil and natural gas production, which are heavily influenced by economic considerations that do not enter into the estimation of TRR. Importantly, projected oil production from the Monterey play is not a material part of the U.S. oil production outlook in either AEO2013 or AEO2014, and was largely unaffected by the change in TRR estimates between the 2013 and 2014 editions of the AEO. EIA estimates U.S. total crude oil production averaged 8.3 million barrels/day in April 2014. In the AEO2014 Reference case, economically recoverable oil from the Monterey averaged 57,000 barrels/day between 2010 and 2040, and in the AEO2013 the same play’s estimated production averaged 14,000 barrels/day. The difference in production between the AEO2013 and AEO2014 is a result of data updates for currently producing wells which were not previously linked to the Monterey play and include both conventionally-reservoired and continuous-type shale areas of the play. Clearly, there is not a proportional relationship between TRR and production estimates – economics matters, and the Monterey play faces significant economic challenges regardless of the TRR estimate.

This year EIA’s estimate for total proved and unproved U.S. technically recoverable oil resources increased 5.4 billion barrels to 238 billion barrels, even with a reduction of the Monterey/Santos shale play estimate of unproved technically recoverable tight oil resources from 13.7 billion barrels to 0.6 billion barrels. Proved reserves in EIA’s U.S. Crude Oil and Natural Gas Proved Reserves report for the Monterey/Santos shale play are withheld to avoid disclosure of individual company data. However, estimates of proved reserves in NEMS are 0.4 billion barrels, which result in 1 billion barrels of total TRR.

Key factors driving the adjustment included new geology information from a U. S. Geological Survey review of the Monterey shale and a lack of production growth relative to other shale plays like the Bakken and Eagle Ford. Geologically, the thermally mature area is 90% smaller than previously thought and is in a tectonically active area which has created significant natural fractures that have allowed oil to leave the source rock and accumulate in the overlying conventional oil fields, such as Elk Hills, Cat Canyon and Elwood South (offshore). Data also indicate the Monterey play is not over pressured and thus lacks the gas drive found in highly productive tight oil plays like the Bakken and Eagle Ford. The number of wells per square mile was revised down from 16 to 6 to represent horizontal wells instead of vertical wells. TRR estimates will likely continue to evolve over time as technology advances, and as additional geologic information and results from drilling activity provide a basis for further updates.

So the shale oil in the Monterey formation may have “migrated” from that convoluted geologic structure to sand deposits or elsewhere, leaving the productive potential much less.

I still don’t understand how it is possible to estimate any geologic reserve without reference to price, but there you have it.

I plan to move on to more manageable energy aggregates, like utility power loads and time series forecasts of consumption in coming posts.

But the shale oil and gas scene in the US is fascinating and a little scary. Part of the gestalt is the involvement of smaller players – not just BP and Exxon, for example. According to Chad Moutray, Economist for the National Association of Manufacturers, the fracking boom is a major stimulus to manufacturing jobs up and down the supply chain. But the productive life of a fracked oil or gas well is typically shorter than a conventional oil or gas well. So some claim that the increases in US production cannot be sustained or will not lead to any real period of “energy independence.” For my money, I need to watch this more before making that kind of evaluation, but the issue is definitely there.

The Next Recession – Will It Be A Global Meltdown?

One my focuses is the global economy and any cracks in the firmament which might presage the next recession. I rely a lot on my Twitter account to keep me on the crest of the wave, in this regard.

I’m really concerned, as are many of my colleagues and contacts in business and government.

We’ve hardly escaped the effects of last recession 2008-2009. Those are US dates, of course, set by the National Bureau of Economic Research (NBER) the official recession “dater” in this country.

There have been a series of rolling impacts and consequences of this so-called “Great Recession.”

Europe

Housing or real estate bubbles were present in Europe, too, particularly in Spain and Ireland. Then, there was the problem of the Greek economy and state, which did not support the level of public debt that had been garnered by, in some cases, corrupt public officials. And European problems were complicated by the currency union of the euro in a context where there is not, as yet, a centralized EU state. Anyway, not to reprise the whole matter blow-by-blow, but most of Europe, with the exception of Germany, plunged into recession and struggled with austerity policies that made things worse for Main Street or, as they like to say in Britain, “High Street.”

Many European countries are just now coming out of recession, and overall, the growth rate in the EU area is almost indistinguishable from zero.

So another recession in the next one to two years would really set them back.

China

Part of the problem China has been experiencing is related to the persisting downturn in most of Europe, since Europe is a big trading partner. And so, for that matter is the United States, which bought less from China during the recession years.

But another problem is that China now is experiencing a mojo big property bubble of its own.

Newly wealthy Chinese do not really have any place to put their money, except real estate. The Chinese, like the Japanese, are big savers, and for many middle class families, buying the second apartment or even a house is an investment for the future. Yet Chinese real estate prices have skyrocketed, leaving the average Chinese wage earner in the dust, with less and less hope of ever owning a residence.

Apparently, in connection with this real estate speculation, a large shadow banking system has emerged. Some estimates circulate on Twitter suggesting this rivals the size of the official Chinese banking system.

Can “market socialism” or “market Leninism” experience a financial crisis, based on too many debts that cannot be paid?

I’ve been to China a few times, and done some business there – all the while trying to understand how things are set up. My feeling is that one should not impute banking practices that seem pro forma in, say, Great Britain or the US, to the Chinese. I think they are much more ready to “break the rules” in order to keep the party going (which is sort of a pun).

Having said that, I do think a Chinese crisis could develop if property values collapse, as they are wont to do in bubble mode.

Again, it’s hard to say how this might play out, since the victims and suffering would be among the nouveau riche of China, of whom there are millions, and many more average families who have invested their nest egg in a hot property.

But I can’t think that collapse of real estate values in modern China would not have worldwide repurcussions.

The Rest of the World

Regrettably, I cannot go through other major regions, one-by-one, but I’d have to say that things are not so good. The BRIC’s as a group all have more problems than a few years back, when they were hailed as the bright new centers of economic growth by that Goldman Sachs analyst. That’s Brazil, Russia, India, and China, of course.

Possibilities of Increased Conflict

There is a kind of axiom of geopolitics and social interaction that when the pie is growing and everybody can get more, even though their slice may not have been very big to begin with, there is a tendency for people to make do, go about their business and so forth. Reverse this and you have the concept that shrinking the pie – as austerity policies and the Great Recession have done – tends to increase levels of conflict. At first, to the extent that people have the idea that “we are all in this together” there may be increased cooperation. But that is not the current situation in almost any society. Quite the contrary, as Piketty and the Occupy Movement highlight, there is growing awareness of inequality of wealth and income.

There are armed conflicts in Syria, the Ukraine, Afghanistan (resurgent Taliban), and areas and regions in Africa. The Indian elections recently installed a Hindu nationalist who hopefully will be a reformer, but may, if the going gets tough, revert or acquiesce to more conflict with Pakistan and with non-Hindu populations within India. Pakistan, one of the world’s nuclear powers, appears to be extremely unstable politically. There are deep civil divisions in Thailand between city and rural areas that parallel class divisions. China is flexing its muscles in the South China Sea.

And we may be moving from an era of US-centric global capitalism to a time when the Eurasian supercontinent will become significantly more important and perhaps decoupled from Wall Street and the City of London. Already, there are threats to dollar supremacy, and, historically, as US economic power is eclipsed by the more rapidly growing economies of Asia, some adjustment seems predictable.

In all this, Hollywood can be counted on to roll out some really corking new international intrigue films, perhaps (although I doubt it) with more complex plots.

The Situation with the US Federal Reserve Bank

The point of this international survey and reprise of recent business history is to highlight areas where surprises may originate, shaking the markets, and perhaps triggering the next recession.

But the most likely suspect is the US Federal Reserve Bank.

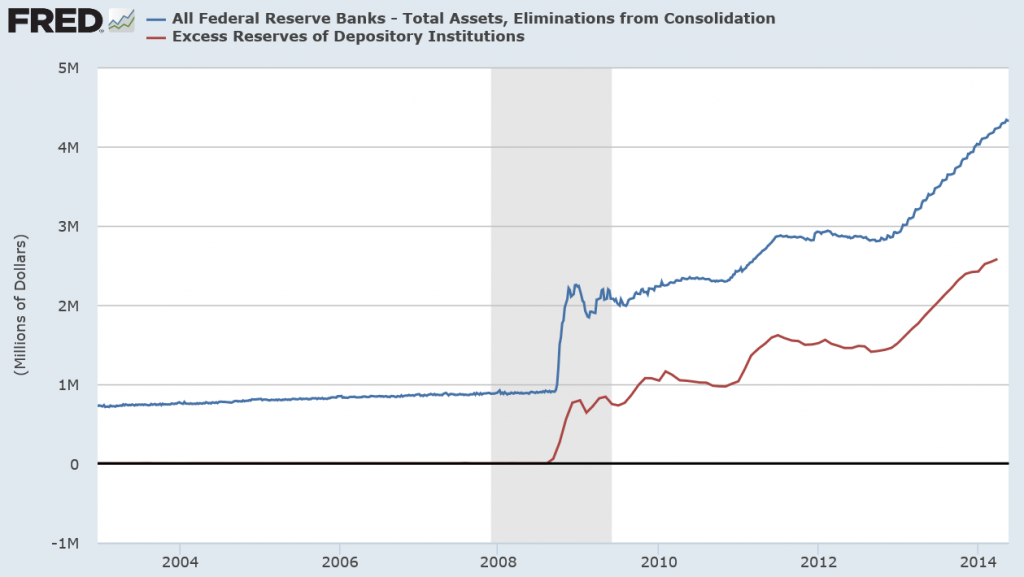
Two graphs speak volumes.
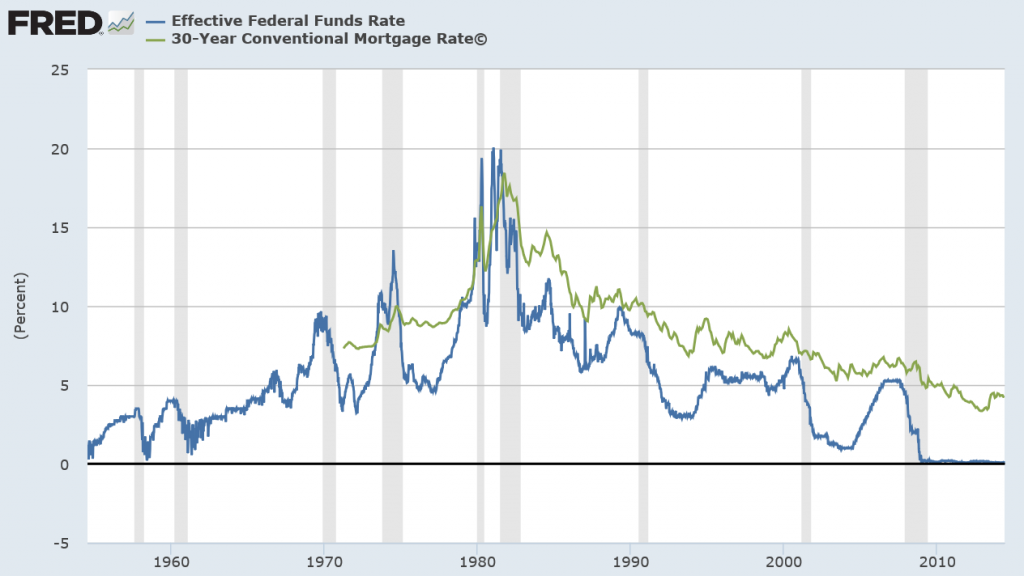
interestratesnew

Fedassets

Seeking to encourage economic recovery, the US Federal Reserve dropped the federal funds rate to a number effectively almost zero – a historically low number. This zero bound federal funds rate has persisted since the end of 2009, or for about five years.

The Fed also has engaged in new policies, whereby it goes into private bond markets and buys long term bonds – primarily mortgage-backed securities. The second chart tracks this inasmuch as a good portion of the more than 4 trillion in Fed assets (for which there are corresponding liabilities, of course) are these mortgage-backed securities. In effect, the Fed has purchased a sizeable portion of the US housing market – one might say “nationalize” except that would be forgetting the fact that the Fed is actually a private institution whose governance is appointed by the Executive Branch of the US government.

In any case, this bond-buying is the famous “quantitative easing” (QE) and is mirrored in the accumulation of excess reserves by the banking system. Generally, that is, banks and financial institutions issue mortgages, sell them among themselves to be packaged in mortgage-backed securities, and the Fed has been buying these.

Banks can easily loan these excess reserves, but they consistently have not. Why is an interesting question beyond the scope of this discussion, but the consequence is that the Fed’s actions are “firewalled” from increasing the rate of inflation, which is what ordinarily you might think would occur given that various metrics of money supply also have surged upward.

Now “Fed-watching” is its own little cottage industry among financial commentators, and I am not going to second-guess the media here. The Fed has announced a plan to “taper” these purchases of long term bonds. This is likely to increase the mortgage rates and, probably to some extent, based on expectations already has.

So, the long and the short of it are that this set of policies – zero federal funds rate and bond buying cannot go on forever.

If economic growth has been low-grade since 2010 with these low interest rates, what is the reasonable outlook for a higher interest rate regime?

Timing of the Next Recession

When is the most likely time for a recession, for example? Would it be later in 2014, in 2015, or thereafter, maybe in 2016.

Here is a table of all the recessions in the US since the middle 1850’s along with facts about their duration (source: NBER).
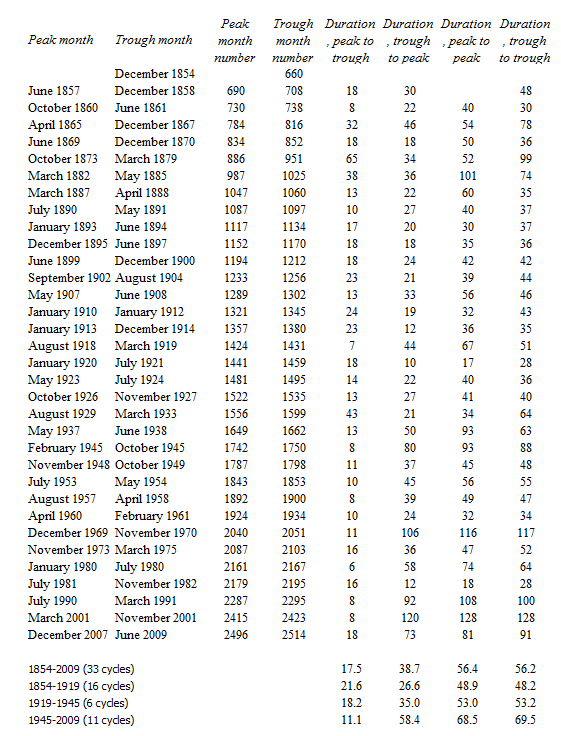
NBERRecess

Without even considering averages, the maximum period of trough to trough – that is, from the bottom of one recession to the bottom of the next – has been 128 months or ten years and eight months. Here, incidentally, the month numbers begin January 1800, for what that’s worth.

Thus, at the outside, based on these empirics, the trough of the next recession is likely to occur no later than early 2020.

Note that we have already blown through the average length from trough to trough of about 58.4 months or about five years from June 2009.

On a simple probabilistic basis, therefore, we are moving into the tail of the distribution of business cycle durations, suggesting that the chances of a downturn are in some sense already above 50 percent.

And note that the experience of the current business recovery is nothing like this historically maximum span in the 1990’s between the trough of the recession of 1990-1991 and the trough of November 2001.

This business recovery persistently seems to move ahead just above or, in the last quarter of 2013, below “stall speed.”

Seemingly, a fairly minor perturbation could set off a chain reaction, given the advanced frothiness in the stock market and softness in housing prices.

More of the Same, Worse

Neil Baroifsky was special inspector with oversight authority for the TARP during the bailout phase of the Great Recession, and currently is a partner in the Litigation Department of national law firm Jenner & Block LLP.

He’s also an author and often is called on for his opinion about developments in malfeasance writ large among the finance giants – such as the Credit Suisse settlement. In connection with a recent NPR interview, Barofsky said,

Although it is good that we averted a catastrophe back in 2008, the way that we did so I believe has unfortunately set the stage for an even more devastating financial crisis in the future.

HOBSON: In the future? How far?

BAROFSKY: Well, if I knew that, Michael Lewis would be writing his next book about people who made billions on timing the markets perfectly about me, which would be great.

(LAUGHTER)

BAROFSKY: But if you look, a lot of the same broken incentives from 2008 are still there. It’s just a question of when, not if. You can’t look at the fundamental broken incentives in the financial system and really come to a conclusion other than that we’re headed down the same dangerous path that we were that culminated in the explosion of ’08.

Barofsky’s point is readily supported by facts, such as –

The US and global financial system is even more concentrated today than in 2007, making “too big to fail”and even bigger potential problem now, than before the Great Recession. Even Alan Greenspan has taken note.

And the “pass the buck” system, whereby bond rating agencies are paid by the originators to evaluate exotic securities (“financial innovations”) created by the banking and shadow banking industries, securities which are then passed on to pension funds and hapless investors – this system appears to still be completely in place. Talk about the concept of “moral hazard.”

Global Impact

I think you get the picture.

For one reason or another, some fairly minor event is likely to set off a cascade of consequences in US and global financial markets, leading to the next recession. Probably, within one, two, or three years, as a matter of fact. Because the US Fed, and, for that matter, other central banks will still be working their way out of the last recession, there may be fewer “policy tools” to halt the stampede to sell, cutback, and so forth. Governments could respond with aggressive fiscal policy, but that option appears limited unless there are major changes in the political climate in the US and Europe.

Personally, I think wholly new directions of policy should be contemplated at the personal, local, regional, and of course at national levels.

We need to create what I have started to call “islands of stability.” This is the old idea of local self-reliance, but in new packaging. I really think there should be discussions widely across the US at least about how to decouple from the global economy and, indeed, from the financial concentrations on Wall Street. As a matter of self-preservation, until such time as more courageous national policies can be undertaken to reign in such obvious risks.

The “Hollowing Out” of Middle Class America

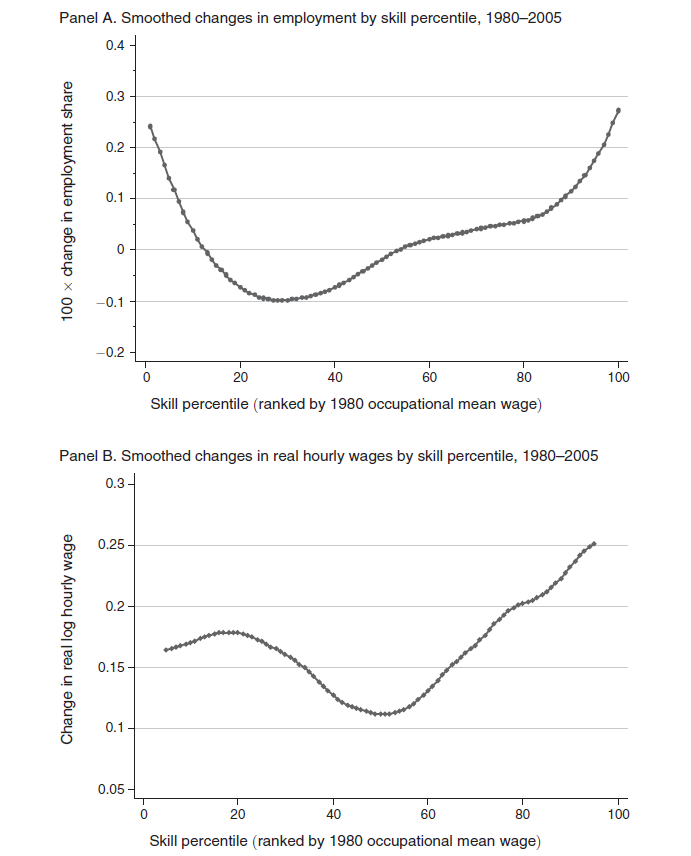
Two charts in a 2013 American Economic Review (AER) article put numbers to the “hollowing out” of middle class America – a topic celebrated with profuse anecdotes in the media.

Autor1

The top figure shows the change in employment 1980-2005 by skill level, based on Census IPUMS and American Community Survey (ACS) data. Occupations are ranked by skill level, approximated by wages in each occupation in 1980.

The lower figure documents the changes in wages of these skill levels 1980-2005.

These charts are from David Autor and David Dorn – The Growth of Low-Skill Service Jobs and the Polarization of the US Labor Market – who write that,

Consistent with the conventional view of skill-biased technological change, employment growth is differentially rapid in occupations in the upper two skill quartiles. More surprising in light of the canonical model are the employment shifts seen below the median skill level. While occupations in the second skill quartile fell as a share of employment, those in the lowest skill quartile expanded sharply. In net, employment changes in the United States during this period were strongly U-shaped in skill level, with relative employment declines in the middle of the distribution and relative gains at the tails. Notably, this pattern of employment polarization is not unique to the United States. Although not recognized until recently, a similar “polarization” of employment by skill level has been underway in numerous industrialized economies in the last 20 to 30 years.

So, employment and wage growth has been fastest in the past three or so decades (extrapolating to the present) in low skill and high skill occupations.

Among lower skill occupations, such as food service workers, security guards, janitors and gardeners, cleaners, home health aides, child care workers, hairdressers and beauticians, and recreational workers, employment grew 30 percent 1980-2005.

Among the highest paid occupations – classified as managers, professionals, technicians, and workers in finance, and public safety – the share of employment also grew by about 30 percent, but so did wages – which increased at about double the pace of the lower skill occupations over this period.

Professor Autor is in the MIT economics department, and seems to be the nexus of a lot of interesting research casting light on changes in US labor markets.

DavidAutor

In addition to “doing Big Data” as the above charts suggest, David Autor is closely associated with a new, common sense model of production activities, based on tasks and skills.

This model of the production process, enables Autor and his coresearchers to conclude that,

…recent technological developments have enabled information and communication technologies to either directly perform or permit the offshoring of a subset of the core job tasks previously performed by middle skill workers, thus causing a substantial change in the returns to certain types of skills and a measurable shift in the assignment of skills to tasks.

So it’s either a computer (robot) or a Chinaman who gets the middle-class bloke’s job these days.

And to drive that point home – (and, please, I consider the achievements of the PRC in lifting hundreds of millions out of extreme poverty to be of truly historic dimension) Autor with David Dorn and Gordon Hansen publihsed another 2013 article in the AER titled The China Syndrome: Local Labor Market Effects of Import Competition in the United States.

This study analyzes local labor markets and trade shocks to these markets, according to initial patterns of industry specialization.

The findings are truly staggering – or at least have been equivocated or obfuscated for years by special pleaders and lobbyists.

Dorn et al write,

The value of annual US goods imports from China increased by a staggering 1,156 percent from 1991 to 2007, whereas US exports to China grew by much less…. 

Our analysis finds that exposure to Chinese import competition affects local labor markets not just through manufacturing employment, which unsurprisingly is adversely affected, but also along numerous other margins. Import shocks trigger a decline in wages that is primarily observed outside of the manufacturing sector. Reductions in both employment and wage levels lead to a steep drop in the average earnings of households. These changes contribute to rising transfer payments through multiple federal and state programs, revealing an important margin of adjustment to trade that the literature has largely overlooked,

This research – conducted in terms of ordinary least squares (OLS), two stage least squares (2SLS) as well as “instrumental” regressions – is definitely not something a former trade unionist is going to ponder in the easy chair after work at the convenience store. So it’s kind of safe in terms of arousing the ire of the masses.

But I digress.

For my purposes here, Autor and his co-researchers put pieces of the puzzle in place so we can see the picture.

The US occupational environment has changed profoundly since the 1980’s. Middle class jobs have simply vanished over large parts of the landscape. More specifically, good-paying production jobs, along with a lot of other more highly paid, but routinized work, has been the target of outsourcing, often to China it seems it can be demonstrated. Higher paid work by professionals in business and finance benefits from complementarities with the advances in data processing and information technology (IT) generally. In addition, there are a small number of highly paid production workers whose job skills have been updated to run more automated assembly operations which seem to be the chief beneficiaries of new investment in production in the US these days.

There you have it.

Market away, and include these facts in any forecasts you develop for the US market.

Of course, there are issues of dynamics.

LInks – late May

US and Global Economic Prospects

Goldman’s Hatzius: Rationale for Economic Acceleration Is Intact

We currently estimate that real GDP fell -0.7% (annualized) in the first quarter, versus a December consensus estimate of +2½%. On the face of it, this is a large disappointment. It raises the question whether 2014 will be yet another year when initially high hopes for growth are ultimately dashed.

 Today we therefore ask whether our forecast that 2014-2015 will show a meaningful pickup in growth relative to the first four years of the recovery is still on track. Our answer, broadly, is yes. Although the weak first quarter is likely to hold down real GDP for 2014 as a whole, the underlying trends in economic activity are still pointing to significant improvement….

 The basic rationale for our acceleration forecast of late 2013 was twofold—(1) an end to the fiscal drag that had weighed on growth so heavily in 2013 and (2) a positive impulse from the private sector following the completion of the balance sheet adjustments specifically among US households. Both of these points remain intact.

Economy and Housing Market Projected to Grow in 2015

Despite many beginning-of-the-year predictions about spring growth in the housing market falling flat, and despite a still chugging economy that changes its mind quarter-to-quarter, economists at the National Association of Realtors and other industry groups expect an uptick in the economy and housing market through next year.

The key to the NAR’s optimism, as expressed by the organization’s chief economist, Lawrence Yun, earlier this week, is a hefty pent-up demand for houses coupled with expectations of job growth—which itself has been more feeble than anticipated. “When you look at the jobs-to-population ratio, the current period is weaker than it was from the late 1990s through 2007,” Yun said. “This explains why Main Street America does not fully feel the recovery.”

Yun’s comments echo those in a report released Thursday by Fitch Ratings and Oxford Analytica that looks at the unusual pattern of recovery the U.S. is facing in the wake of its latest major recession. However, although the U.S. GDP and overall economy have occasionally fluctuated quarter-to-quarter these past few years, Yun said that there are no fresh signs of recession for Q2, which could grow about 3 percent.

Report: San Francisco has worse income inequality than Rwanda

If San Francisco was a country, it would rank as the 20th most unequal nation on Earth, according to the World Bank’s measurements.

Googlebus

Climate Change

When Will Coastal Property Values Crash And Will Climate Science Deniers Be The Only Buyers?

sea

How Much Will It Cost to Solve Climate Change?

Switching from fossil fuels to low-carbon sources of energy will cost $44 trillion between now and 2050, according to a report released this week by the International Energy Agency.

Natural Gas and Fracking

How The Russia-China Gas Deal Hurts U.S. Liquid Natural Gas Industry

This could dampen the demand – and ultimately the price for – LNG from the United States. East Asia represents the most prized market for producers of LNG. That’s because it is home to the top three importers of LNG in the world: Japan, South Korea and China. Together, the three countries account for more than half of LNG demand worldwide. As a result, prices for LNG are as much as four to five times higher in Asia compared to what natural gas is sold for in the United States.

The Russia-China deal may change that.

If LNG prices in Asia come down from their recent highs, the most expensive LNG projects may no longer be profitable. That could force out several of the U.S. LNG projects waiting for U.S. Department of Energy approval. As of April, DOE had approved seven LNG terminals, but many more are waiting for permits.

LNG terminals in the United States will also not be the least expensive producers. The construction of several liquefaction facilities in Australia is way ahead of competitors in the U.S., and the country plans on nearly quadrupling its LNG capacity by 2017. More supplies and lower-than-expected demand from China could bring down prices over the next several years.

Write-down of two-thirds of US shale oil explodes fracking mythThis is big!

Next month, the US Energy Information Administration (EIA) will publish a new estimate of US shale deposits set to deal a death-blow to industry hype about a new golden era of US energy independence by fracking unconventional oil and gas.

EIA officials told the Los Angeles Times that previous estimates of recoverable oil in the Monterey shale reserves in California of about 15.4 billion barrels were vastly overstated. The revised estimate, they said, will slash this amount by 96% to a puny 600 million barrels of oil.

The Monterey formation, previously believed to contain more than double the amount of oil estimated at the Bakken shale in North Dakota, and five times larger than the Eagle Ford shale in South Texas, was slated to add up to 2.8 million jobs by 2020 and boost government tax revenues by $24.6 billion a year.

China

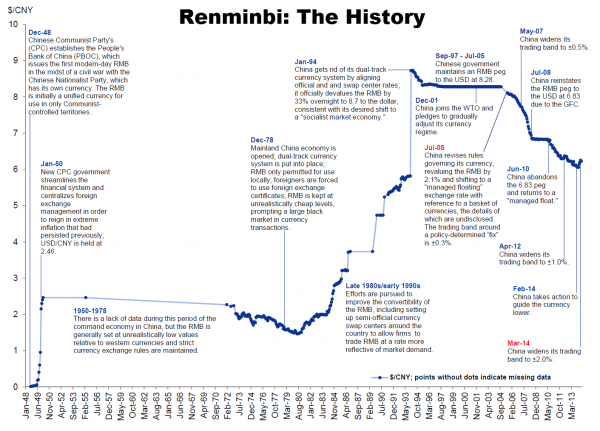
The Annotated History Of The World’s Next Reserve Currency

yuanhistory

Goldman: Prepare for Chinese property bust

…With demand poised to slow given a tepid economic backdrop, weaker household affordability, rising mortgage rates and developer cash flow weakness, we believe current construction capacity of the domestic property industry may be excessive. We estimate an inventory adjustment cycle of two years for developers, driving 10%-15% price cuts in most cities with 15% volume contraction from 2013 levels in 2014E-15E. We also expect M&A activities to take place actively, favoring developers with strong balance sheet and cash flow discipline.

China’s Shadow Banking Sector Valued At 80% of GDP

The China Banking Regulatory Commission has shed light on the country’s opaque shadow banking sector. It was as large as 33 trillion yuan ($5.29 trillion) in mid-2013 and equivalent to 80% of last year’s GDP, according to Yan Qingmin, a vice chairman of the commission.

In a Tuesday WeChat blog sent by the Chong Yang Institute for Financial Studies, Renmin University, Yan wrote that his calculation is based on shadow lending activities from asset management businesses to trust companies, a definition he said was very broad.  Yan said the rapid expansion of the sector, which was equivalent to 53% of GDP in 2012, entailed risks of some parts of the shadow banking business, but not necessarily the Chinese economy.

Yan’s estimation is notably higher than that of the Chinese Academy of Social Sciences. The government think tank said on May 9 that the sector has reached 27 trillion yuan ($4.4 trillion in 2013) and is equivalent to nearly one fifth of the domestic banking sector’s total assets.

Massive, Curvaceous Buildings Designed to Imitate a Mountain Forest

Chinamassive

Information Technology (IT)

I am an IT generalist. Am I doomed to low pay forever? Interesting comments and suggestions to this question on a Forum maintained by The Register.

I’m an IT generalist. I know a bit of everything – I can behave appropriately up to Cxx level both internally and with clients, and I’m happy to crawl under a desk to plug in network cables. I know a little bit about how nearly everything works – enough to fill in the gaps quickly: I didn’t know any C# a year ago, but 2 days into a project using it I could see the offshore guys were writing absolute rubbish. I can talk to DB folks about their DBs; network guys about their switches and wireless networks; programmers about their code and architects about their designs. Don’t get me wrong, I can do as well as talk, programming, design, architecture – but I would never claim to be the equal of a specialist (although some of the work I have seen from the soi-disant specialists makes me wonder whether I’m missing a trick).

My principle skill, if there is one – is problem resolution, from nitty gritty tech details (performance and functionality) to handling tricky internal politics to detoxify projects and get them moving again.

How on earth do I sell this to an employer as a full-timer or contractor? Am I doomed to a low income role whilst the specialists command the big day rates? Or should I give up on IT altogether

Crowdfunding is brutal… even when it works

China bans Windows 8

China has banned government use of Windows 8, Microsoft Corp’s latest operating system, a blow to a US technology company that has long struggled with sales in the country.

The Central Government Procurement Center issued the ban on installing Windows 8 on Chinese government computers as part of a notice on the use of energy-saving products, posted on its website last week.

Data Analytics

Statistics of election irregularities – good forensic data analytics.