Tag Archives: Global Business Forecasts

Links – February 14

Global Economy

Yellen Says Recovery in Labor Market Far From Complete – Highlights of Fed Chair Yellen’s recent testimony before the House Financial Services Committee. Message – continuity, steady as she goes unless a there is a major change in outlook.

OECD admits overstating growth forecasts amid eurozone crisis and global crash The Paris-based organisation said it repeatedly overestimated growth prospects for countries around the world between 2007 and 2012. The OECD revised down forecasts at the onset of the financial crisis, but by an insufficient degree, it said….

The biggest forecasting errors were made when looking at the prospects for the next year, rather than the current year.

10 Books for Understanding China’s Economy

Information Technology (IT)

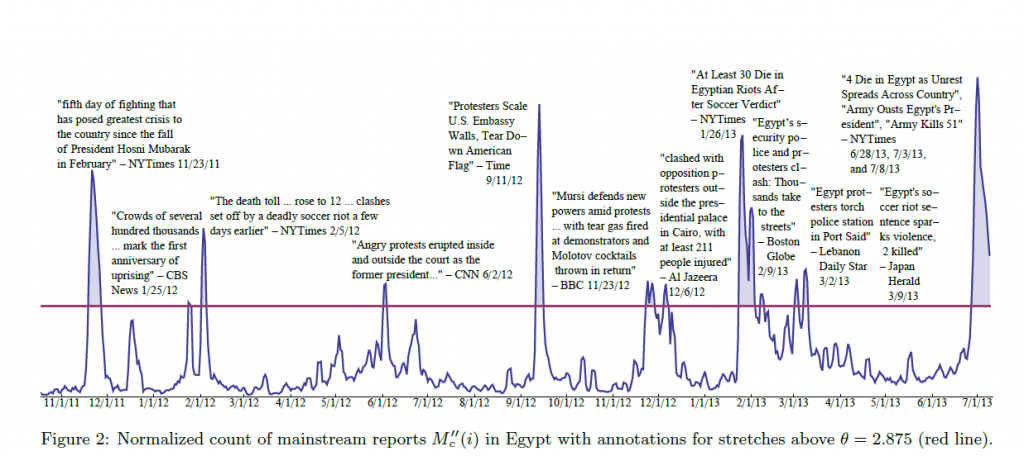
Predicting Crowd Behavior with Big Public Data

SocialMediaEgypt

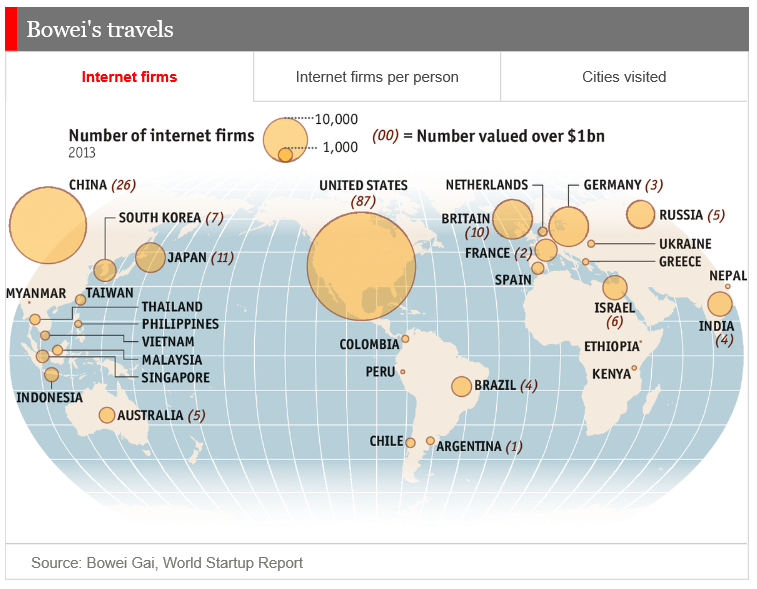
Internet startups

WorldStartups

Alternative Technology

World’s Largest Rooftop Farm Documents Incredible Growth High Above Brooklyn

Rhino and Tapers in the Room – Janet Yellen’s Menagerie

Michael Hirsh highlights Janet Yellen as an “old school progressive economist” in a recent piece in the National Journal. Her personal agenda supposedly includes serious concern with increasing employment and regulatory control of Wall Street.

But whether she can indulge these “personal passions” in the face of the extraordinary strategic situation of the current Fed is another question.

There is, for example, the taper – with apologies to my early English teachers who would admonish me there is a “i” rather than “e” at the end of that word.

tapir

After testing the waters mid-year 2013 and then pulling back, when initial reaction seemed over-the-top, the Federal Reserve announced onset of a program to “taper” bond purchases December 2013. So far, there have been two reductions by $10 billion a month, leaving bond purchases running $65 billion a month. This relatively modest pace, however, has been fingered as a prime cause of precipitous currency impacts by problem emerging countries (India, for example).

But taper (or tapir) not-withstanding, the real rhino in the room is the Fed balance sheet with its sort of crystalized excess reserve balances of US banks.

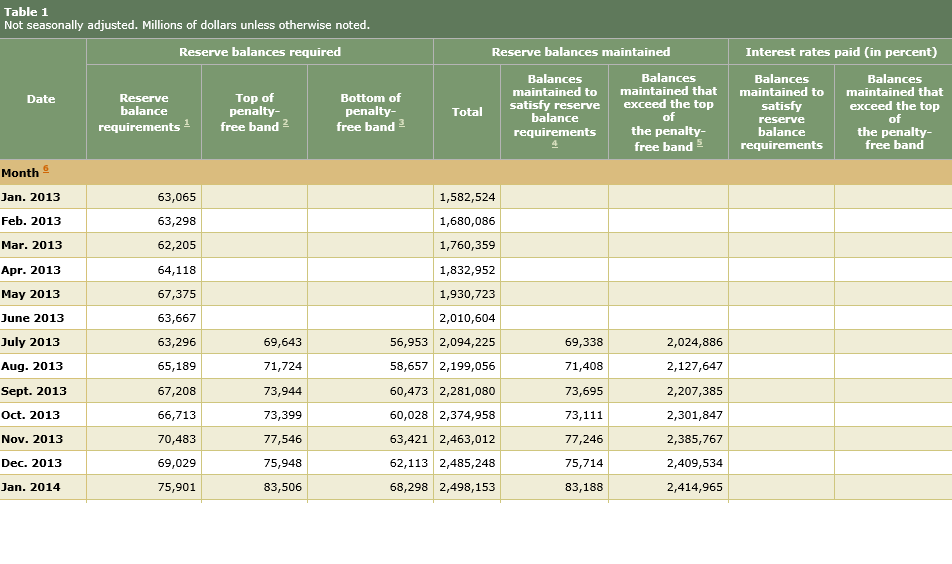
Currently US banks hold about $2.5 trillion in excess reserves. Here’s a Treasury Department table which shows how these excess reserves continue to skyrocket, and the level of reserves required by Fed authorities as security for the level of bank deposits.

FedReserveTableSo excess reserves held in the Fed have surged by $1 trillion over the last year, and required reserves are more than an order of magnitude less than these excess reserves.

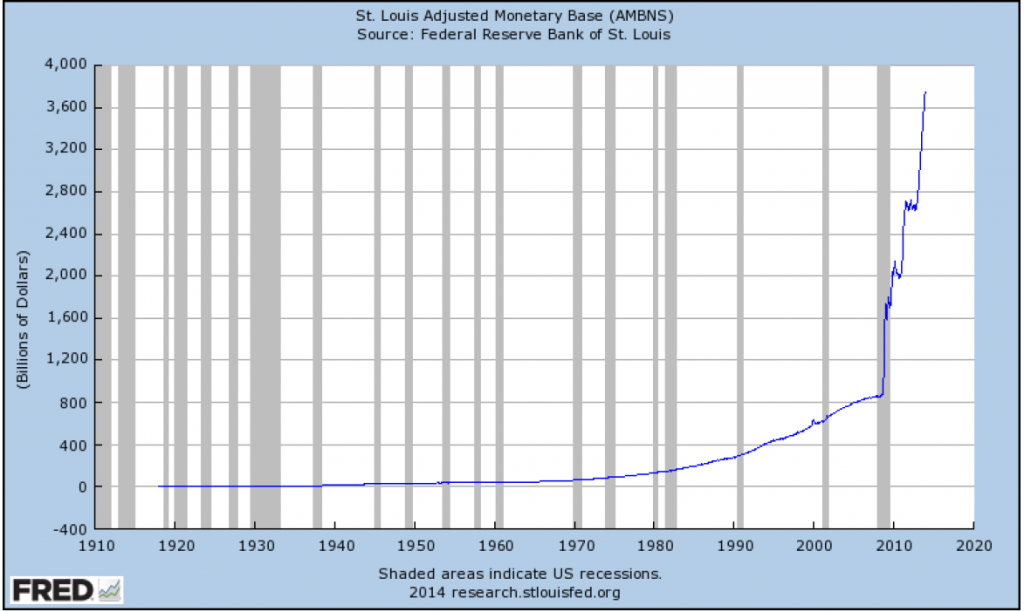
The flip side of these excess reserves is expansion in the US monetary base.

StLouisAdjMonBase

The monetary base series above shows total bank reserves and the currency stock, plus adjustments. This is what Milton Friedman often called “high powered money,” since it is available immediately for bank loans.

But there have been few loans, and that is one important point.

Barry Ritholz has been following this dramatic surge in the US money supply and bank excess reserves. See, for example, his post from mid-2013 81.5% of QE Money Is Not Helping the Economy, where he writes,

We’ve repeatedly pointed out that the Federal Reserve has been intentionally discouraged banks from lending to Main Street – in a misguided attempt to curb inflation – which has increased unemployment and stalled out the economy.

Ritholz backs this claim with careful research into and citation of Fed documents and other pertinent materials.

Bottom line – there is strong evidence the new Fed policy of paying interest on bank reserves is a deliberate attempt to create a firewall between the impacts of quantitative easing and inflation. The only problem is that all this new money that has been created misses Main Street, for the most part, but fuels financial speculation here and abroad.

Some Credit Where Credit Is Due

Admittedly, though, the Federal Reserve has done a lot of heavy lifting since the financial crises in 2008.

Created in 1913, the Federal Reserve Bank is a “bank of banks,” whose primary depositors are commercial banks. The Fed is charged with maintaining stable prices and employment, objectives not always in synch with each other.

Under the previous Chairman, Ben Bernacke, the Fed led the way into new policy responses to problems such as potential global financial collapse and high, persisting levels of unemployment.

The core innovation has been purchase of assets apart from conventional US Treasury securities – formerly the policy core of Open Market Operations. With the threat of global financial collapse surrounding the bankruptcies of Bear Stearns and then Lehman Brothers in 2008, the Treasury and the Fed swung into action with programs like the TARP and the bailout of AIG, a giant insurance concern which made a lot of bad bets (mainly credit default swaps) and was “too big to fail.”

Other innovations followed, such as payment of interest by the Fed on reserve deposits of commercial banks, as well as large purchases of mortgage securities, bolstering the housing market and tamping down long term interest rates.

The Fed has done this in a political context generally unfavorable to the type of fiscal stimulus which might be expected, given the severity of the unemployment problems. The new Chair, Janet Yellen, for example, has noted that cutbacks at the state level following on the recession of 2008-2009 might well have been the occasion for more ambitious federal economic stimulus. This, however, was blocked by Congress.

As a result, the Fed has borne a disproportionate share of the burden of rebuilding the balance sheets of US banks, stabilizing housing markets, and pushing forward at least some type of economic recovery.

This is not to lionize the Fed, since many criticisms can be made.

The Rhino

In terms of forecasting, however, the focus must be on the rhino in the room growing bigger all the time. Can it be led peaceably outside to pasture, for a major weight reduction to something like a pony, again?

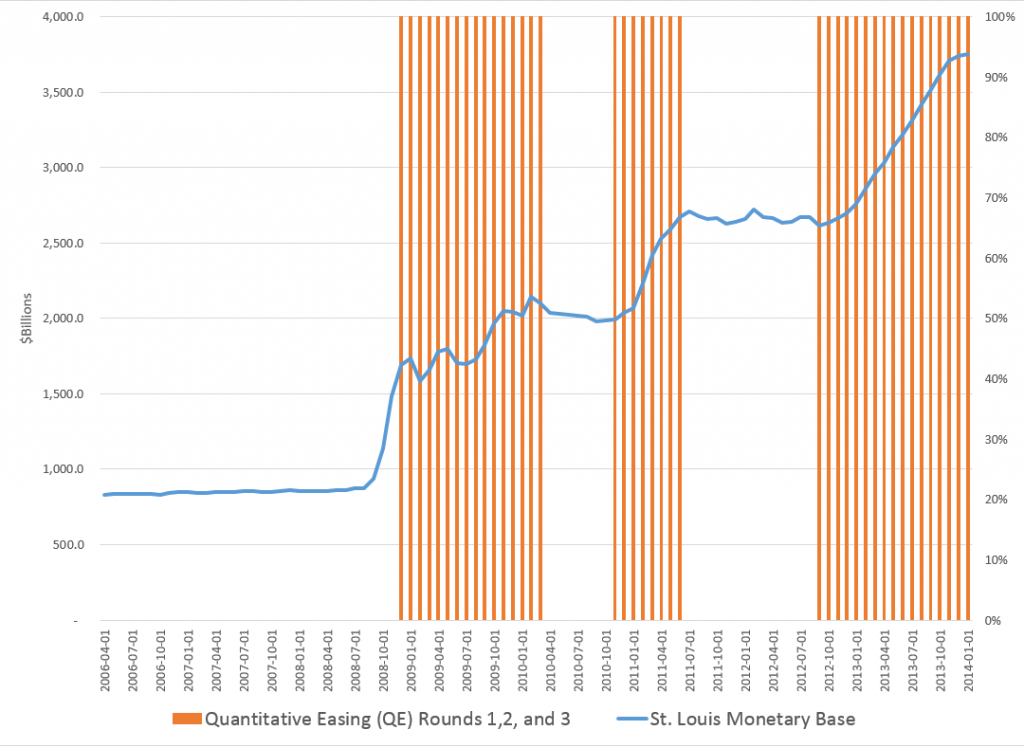
With apologies for mixed metaphors, the following chart highlights the issue.

FedMBandQEgraph

This shows the total of the “monetary base” dating from the beginning of 2006. The red shaded areas of the graph indicate the time windows in which the various “Quantitative Easing” (QE) policies have been in effect – now three QE’s, QE1, QE2, and QE3.

Another problem concerns the composition of the Fed holdings which balance off against these reserves. The Fed has invested and is investing heavily in mortgage-backed securities, and has other sorts of non-traditional assets in its portfolio. In fact, given the lack-luster growth and employment in the US economy since 2008, the Fed has been one of the primary forces supporting “recovery” and climbing prices in the housing market.

So there are really two problems. First, the taper. Then, the “winding down” of Fed positions in these assets.

Chairperson Yellen has her hands full – and this is not even to mention the potential hair-rending that would unfold, were another recession to start later this year or in 2015 – perhaps due to political wars over the US debt limit, upheavals in emerging markets, or further self-defeating moves by the “leadership” of the EU.

Sayings of the Top Macro Forecasters

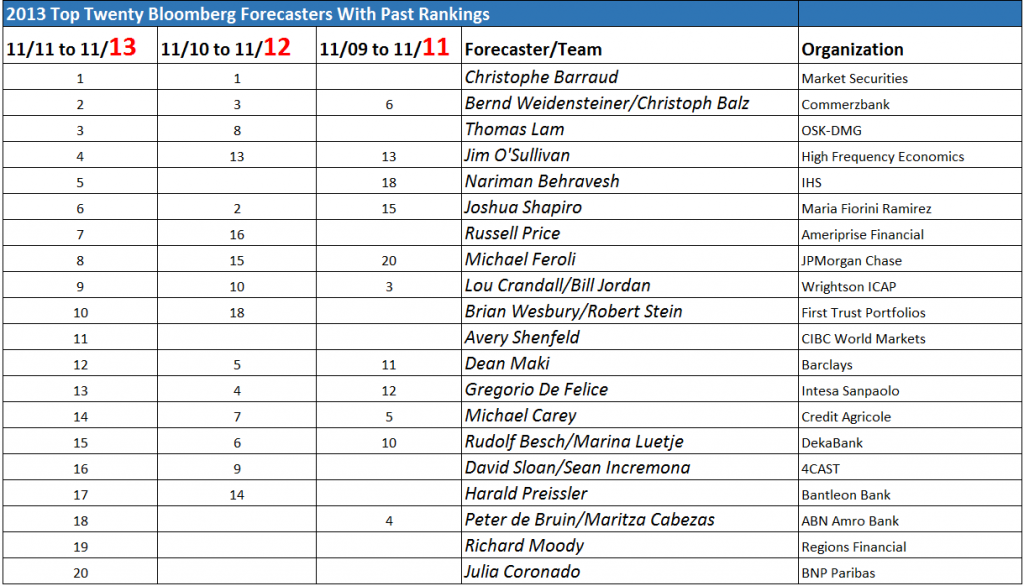
Yesterday, I posted the latest Bloomberg top twenty US macroeconomic forecaster rankings, also noting whether this current crop made it into the top twenty in previous “competitions” for November 2010-November 2012 or November 2009-November 2011.

It turns out the Bloomberg top twenty is relatively stable. Seven names or teams on the 2014 list appear in both previous competitions. Seventeen made it into the top twenty at least twice in the past three years.

But who are these people and how can we learn about their forecasts on a real-time basis?

Well, as you might guess, this is a pretty exclusive club. Many are Chief Economists and company Directors in investment advisory organizations serving private clients. Several did a stint on the staff of the Federal Reserve earlier in their career. Their public interface is chiefly through TV interviews, especially Bloomberg TV, or other media coverage.

I found a couple of exceptions, however – Michael Carey and Russell Price.

Michael Carey and Crédit Agricole

Michael Carey is Chief Economist North America Crédit Agricole CIB. He ranked 14, 7, and 5, based on his average scores for his forecasts of the key indicators in these three consecutive competitions. He apparently is especially good on employment forecasts.

MikeCarey

Carey is a lead author for a quarterly publication from Crédit Agricole called Prospects Macro.

The Summary for the current issue (1st Quarter 2014) caught my interest –

On the economic trend front, an imperfect normalisation seems to be getting underway. One may talk about a normalisation insofar as – unlike the two previous financial years – analysts have forecast a resumption of synchronous growth in the US, the Eurozone and China. US growth is forecast to rise from 1.8% in 2013 to 2.7%; Eurozone growth is slated to return to positive territory, improving from -0.4% to +1.0%; while Chinese growth is forecast to dip slightly, from 7.7% to 7.2%, which does not appear unwelcome nor requiring remedial measures. The imperfect character of the forecast normalisation quickly emerges when one looks at the growth predictions for 2015. In each of the three regions, growth is not gathering pace, or only very slightly. It is very difficult to defend the idea of a cyclical mechanism of self-sustaining economic acceleration. This observation seems to echo an ongoing academic debate: growth in industrialised countries seems destined to be weak in the years ahead. Partly, this is because structural growth drivers seem to be hampered (by demographics, debt and technology shocks), and partly because real interest rates seem too high and difficult to cut, with money-market rates that are already virtually at zero and low inflation, which is likely to last. For the markets, monetary policies can only be ‘reflationist’. Equities prices will rise until they come upagainst the overvaluation barrier and long-term rates will continue to climb, but without reaching levels justified by growth and inflation fundamentals.

I like that – an “imperfect normalization” (note the British spelling). A key sentence seems to be “It is very difficult to defend the idea of a cyclical mechanism of self-sustaining economic acceleration.”

So maybe the issue is 2015.

The discussion of emerging markets prospects is well-worth quoting also.

At 4.6% (and 4.2% excluding China), average growth in 2013 across all emerging countries seems likely to have been at its lowest since 2002, apart from the crisis year of 2009. Despite the forecast slowdown in China (7.2%, after 7.7%), the overall pace of growth for EMs is likely to pick up slightly in 2014 (to 4.8%, and 4.5% excluding China). The trend is likely to continue through 2015. This modest rebound, despite the poor growth figures expected from Brazil, is due to the slightly improved performance of a few other large emerging economies such as India, and above all Mexico, South Korea and some Central European countries. As regards the content of this growth, it is investment that should improve, on the strength of better growth prospects in the industrialised countries…

The growth differential with the industrialised countries has narrowed to around 3%, whereas it had stood at around 5% between 2003 and 2011…

This situation is unlikely to change radically in 2014. Emerging markets should continue to labour under two constraints. First off, the deterioration in current accounts has worsened as a result of fairly weak external demand, stagnating commodity prices, and domestic demand levels that are still sticky in many emerging countries…Commodity-exporting countries and most Asian exporters of manufactured goods are still generating surpluses, although these are shrinking. Conversely, large emerging countries such as India, Indonesia, Brazil, Turkey and South Africa are generating deficits that are in some cases reaching alarming proportions – especially in Turkey. These imbalances could restrict growth in 2014-15, either by encouraging governments to tighten monetary conditions or by limiting access to foreign financing.

Secondly, most emerging countries are now paying the price for their reluctance to embrace reform in the years of strong global growth prior to the great global financial crisis. This price is today reflected in falling potential growth levels in some emerging countries, whose weaknesses are now becoming increasingly clear. Examples are Russia and its addiction to commodities; Brazil and its lack of infrastructure, low savings rate and unruly inflation; India and its lack of infrastructure, weakening rate of investment and political dependence of the Federal state on the federated states. Unfortunately, the less favourable international situation (think rising interest rates) and local contexts (eg, elections in India and Brazil in 2014) make implementing significant reforms more difficult over the coming quarters. This is having a depressing effect on prospects for growth

I’m subscribing to notices of updates to this and other higher frequency reports from Crédit Agricole.

Russell Price and Ameriprise

Russell Price, younger than Michael Carey, was Number 7 on the current Bloomberg list of top US macro forecasters, ranking 16 the previous year. He has his own monthly publication with Ameriprise called Economic Perspectives.

RussellPrice

The current issue dated January 28, 2014 is more US-centric, and projects a “modest pace of recovery” for the “next 3 to 5 years.” Still, the current issue warns that analyst projections of company profits are probably “overly optimistic.”

I need to read one or two more of the issues to properly evaluate, but Economic Perspectives is definitely a cut above the average riff on macroeconomic prospects.

Another Way To Tap Into Forecasts of the Top Bloomberg Forecasters

The Wall Street Journal’s Market Watch is another way to tap into forecasts from names and teams on the top Bloomberg lists.

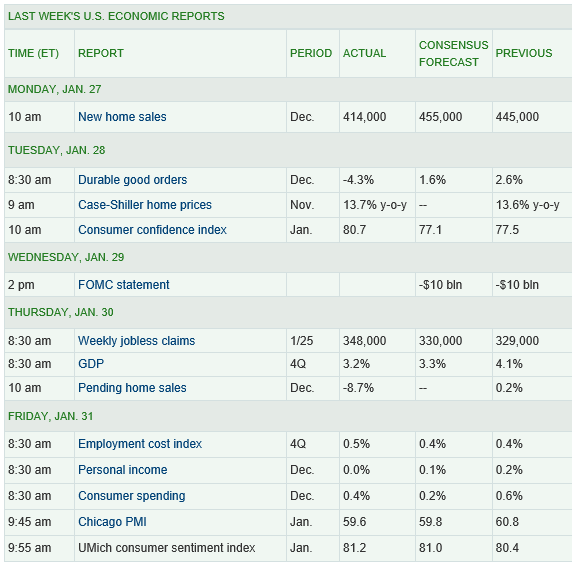
The Market Watch site publishes weekly median forecasts based on the 15 economists who have scored the highest in our contest over the past 12 months, as well as the forecasts of the most recent winner of the Forecaster of the Month contest.

The economists in the Market Watch consensus forecast include many currently or recently in the top twenty Bloomberg list – Jim O’Sullivan of High Frequency Economics, Michael Feroli of J.P. Morgan, Paul Edelstein of IHS Global Insight, Brian Jones of Société Générale, Spencer Staples of EconAlpha, Ted Wieseman of Morgan Stanley, Jan Hatzius’s team at Goldman Sachs, Stephen Stanley of Pierpont Securities, Avery Shenfeld of CIBC, Maury Harris’s team at UBS, Brian Wesbury and Robert Stein of First Trust, Jeffrey Rosen of Briefing.com, Paul Ashworth of Capital Economics, Julia Coronado of BNP Paribas, and Eric Green’s team at TD Securities.

And I like the format of doing retrospectives on these consensus forecasts, in tables such as this:

MarketWatchTable

So what’s the bottom line here? Well, to me, digging deeper into the backgrounds of these top ranked forecasters, finding access to their current thinking is all part of improving competence.

I can think of no better mantra than Malcolm Gladwell’s 10,000 Hour Rule –

Top Bloomberg Macro Forecaster Rankings for 2014

Bloomberg compiles global rankings for forecasters of US macro variables, based on their forecasts of a range of key monthly indicators. The rankings are based on performance over two year periods, ending November in the year the rankings are announced.

Here is a summary sheet for the past three years for the top twenty US macroeconomic forecasters or forecasting teams, with their organizational affiliation (click to enlarge).

Top Bloomberg rankings

SOURCES: http://www.christophe-barraud.com/wp-content/uploads/2014/01/Classement-Bloomberg-janvier-20141.pdf, http://www.bloomberg.com/bb/avfile/r5M7ODl4WNms, https://www.economy.com/home/products/samples/2012-01-20-Bloomberg.pdf

The list of top forecasters for the US economy has been fairly stable recently. At least seventeen out of the top twenty forecasters for the US are listed twice; six forecasters or forecasting teams made the top list in all three periods.

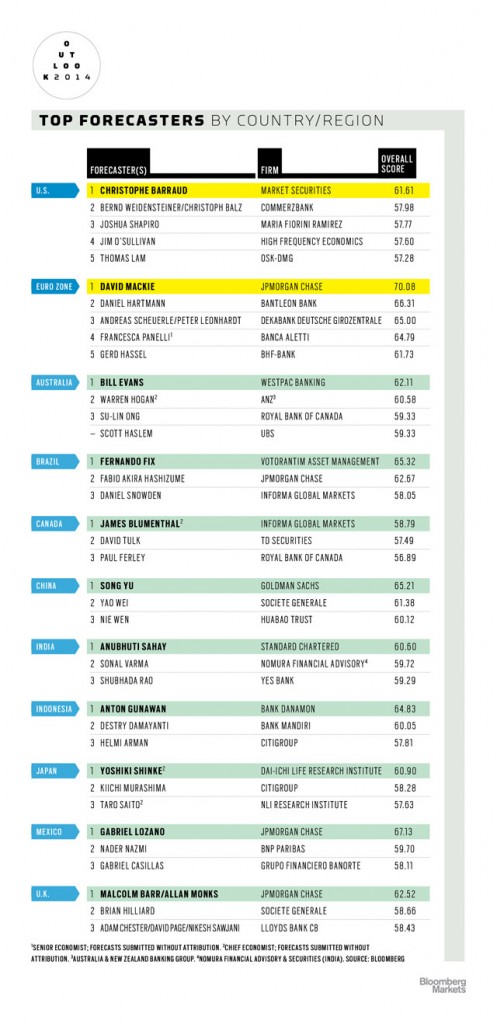
Interestingly, European forecasters have recently taken the lead. Bloomberg News notes Number One – Christophe Barraud is only 27 years old, and developed an interest in forecasting, apparently, as a teenager, when he and his dad bet on horses at tracks near Nice, France.

In the most recent ranking, key indicators include CPI, Durable Goods Orders, Existing Home Sales, Housing Starts, IP, ISM Manufacturing, ISM Nonmanufacturing, New Home Sales, Nonfarm Payrolls, Personal Income, Personal Spending, PPI, Retail Sales, Unemployment and GDP. A total of 68 forecasters or forecasting teams qualified for and participated in the ranking exercise.

Bloomberg Markets also announced other regional rankings, shown in this infographic

Bloombergmarkets And as a special treat this Friday, for the collectors among readers, here is the Ben Bernacke commemorative baseball card, developed at the Fed as a going away present.

Bernacke

Links – February 1, 2014

IT and Big Data

Kayak and Big Data Kayak is adding prediction of prices of flights over the coming 7 days to its meta search engine for the travel industry.

China’s Lenovo steps into ring against Samsung with Motorola deal Lenovo Group, the Chinese technology company that earns about 80 percent of its revenue from personal computers, is betting it can also be a challenger to Samsung Electronics Co Ltd and Apple Inc in the smartphone market.

5 Things To Know About Cognitive Systems and IBM Watson Rob High video on Watson at http://www.redbooks.ibm.com/redbooks.nsf/pages/watson?Open. Valuable to review. Watson is probably different than you think. Deep natural language processing.

Playing Computer Games and Winning with Artificial Intelligence (Deep Learning) Pesents the first deep learning model to successfully learn control policies directly from high-dimensional sensory input using reinforcement learning. The model is a convolutional neural network, trained with a variant of Q-learning, whose input is raw pixels and whose output is a value function estimating future rewards… [applies] method to seven Atari 2600 games from the Arcade Learning Environment, with no adjustment of the architecture or learning algorithm…outperforms all previous approaches on six of the games and surpasses a human expert on three of them.

Global Economy

China factory output points to Q1 lull Chinese manufacturing activity slipped to its lowest level in six months, with indications of slowing growth for the quarter to come in the world’s second-largest economy.

Japan inflation rises to a 5 year high, output rebounds Japan’s core consumer inflation rose at the fastest pace in more than five years in December and the job market improved, encouraging signs for the Bank of Japan as it seeks to vanquish deflation with aggressive money printing.

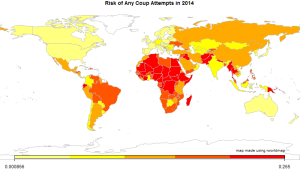
Coup Forecasts for 2014

coupforecast                       

World risks deflationary shock as BRICS puncture credit bubbles Ambrose Evans-Pritchard does some nice analysis in this piece.

Former IMF Chief Economist, Now India’s Central Bank Governor Rajan Takes Shot at Bernanke’s Destabilizing Policies

Some of his key points:

Emerging markets were hurt both by the easy money which flowed into their economies and made it easier to forget about the necessary reforms, the necessary fiscal actions that had to be taken, on top of the fact that emerging markets tried to support global growth by huge fiscal and monetary stimulus across the emerging markets. This easy money, which overlaid already strong fiscal stimulus from these countries. The reason emerging markets were unhappy with this easy money is “This is going to make it difficult for us to do the necessary adjustment.” And the industrial countries at this point said, “What do you want us to do, we have weak economies, we’ll do whatever we need to do. Let the money flow.”

Now when they are withdrawing that money, they are saying, “You complained when it went in. Why should you complain when it went out?” And we complain for the same reason when it goes out as when it goes in: it distorts our economies, and the money coming in made it more difficult for us to do the adjustment we need for the sustainable growth and to prepare for the money going out

International monetary cooperation has broken down. Industrial countries have to play a part in restoring that, and they can’t at this point wash their hands off and say we’ll do what we need to and you do the adjustment. ….Fortunately the IMF has stopped giving this as its mantra, but you hear from the industrial countries: We’ll do what we have to do, the markets will adjust and you can decide what you want to do…. We need better cooperation and unfortunately that’s not been forthcoming so far.

Science Perspective

Researchers Discover How Traders Act Like Herds And Cause Market Bubbles

Building on similarities between earthquakes and extreme financial events, we use a self-organized criticality-generating model to study herding and avalanche dynamics in financial markets. We consider a community of interacting investors, distributed in a small-world network, who bet on the bullish (increasing) or bearish (decreasing) behavior of the market which has been specified according to the S&P 500 historical time series. Remarkably, we find that the size of herding-related avalanches in the community can be strongly reduced by the presence of a relatively small percentage of traders, randomly distributed inside the network, who adopt a random investment strategy. Our findings suggest a promising strategy to limit the size of financial bubbles and crashes. We also obtain that the resulting wealth distribution of all traders corresponds to the well-known Pareto power law, while that of random traders is exponential. In other words, for technical traders, the risk of losses is much greater than the probability of gains compared to those of random traders. http://pre.aps.org/abstract/PRE/v88/i6/e062814

Blogs review: Getting rid of the Euler equation – the equation at the core of modern macro The Euler equation is one of the fundamentals, at a deep level, of dynamic stochastic general equilibrium (DSGE) models promoted as the latest and greatest in theoretical macroeconomics. After the general failures in mainstream macroeconomics with 2008-09, DGSE have come into question, and this review is interesting because it suggests, to my way of thinking, that the Euler equation linking past and future consumption patterns is essentially grafted onto empirical data artificially. It is profoundly in synch with neoclassical economic theory of consumer optimization, but cannot be said to be supported by the data in any robust sense. Interesting read with links to further exploration.

BOSTON COLLOQUIUM FOR PHILOSOPHY OF SCIENCE: Revisiting the Foundations of Statistics – check this out – we need the presentations online.

Mergers and Acquisitions

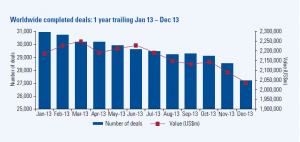
Are we on the threshold of a rise in corporate mergers and acqusitions (M&A)?

According to the KPMA Mergers & Acquisitions Predictor, the answer is ‘yes.’

The world’s largest corporates are expected to show a greater appetite for deals in 2014 compared to 12 months ago, according to analyst predictions. Predicted forward P/E ratios (our measure of corporate appetite) in December 2013 were 16 percent higher than in December 2012. This reflects the last half of the year, which saw a 17 percent increase in forward P/E between June and December 2013. This was compared to a 1 percent fall in the previous 6 months, after concerns over the anticipated mid-year tapering of quantitative easing in the US. The increase in appetite is matched by an anticipated increase of capacity of 12 percent over the next year.

This prediction is based on

..tracking and projecting important indicators 12 months forward. The rise or fall of forward P/E (price/earnings) ratios offers a good guide to the overall market confidence, while net debt to EBITDA (earnings before interest, tax, depreciation and amortization) ratios helps gauge the capacity of companies to fund future acquisitions.

KPMGM&A

Similarly, JPMorgan forecasts 30% rebound in mergers and acquisitions in Asia for 2014.

Waves and Patterns in M&A Activity

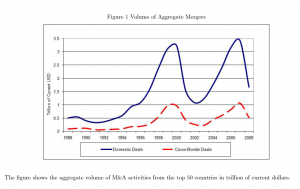
Mergers and acquisitions tend to occur in waves, or clusters.

GlobalM&A

Source: Waves
of International Mergers and Acquisitions

It’s not exactly clear what the underlying drivers of M&A waves are, although there is a rich literature on this.

Riding the wave, for example – an Economist article – highlights four phases of merger activity, based on a recent book Masterminding the Deal: Breakthroughs in M&A Strategy and Analysis,

In the first phase, usually when the economy is in poor shape, just a handful of deals are struck, often desperation sales at bargain prices in a buyer’s market. In the second, an improving economy means that finance is more readily available and so the volume of M&A rises—but not fast, as most deals are regarded as risky, scaring away all but the most confident buyers. It is in the third phase that activity accelerates sharply, because the “merger boom is legitimised; chief executives feel it is safe to do a deal, that no one is going to criticise them for it,” says Mr Clark.

This is when the premiums that acquirers are willing to pay over the target’s pre-bid share price start to rise rapidly. In the merger waves since 1980, bid premiums in phase one have averaged just 10-18%, rising in phase two to 20-35%. In phase three, they surge past 50%, setting the stage for the catastrophically frothy fourth and final phase. This is when premiums rise above 100%, as bosses do deals so bad they are the stuff of legend. Thus, the 1980s merger wave ended soon after the disastrous debt-fuelled hostile bid for RJR Nabisco by KKR, a private-equity fund. A bestselling book branded the acquirers “Barbarians at the Gate”. The turn-of-the-century boom ended soon after Time Warner’s near-suicidal (at least for its shareholders) embrace of AOL.

This typology comes from Clark And Mills book’ ‘Masterminding The Deal’, which suggests that two-thirds of mergers fail.

In their attempt to assess why some mergers succeed while most fail, the authors offer a ranking scheme by merger type. The most successful deals are made by bottom trawlers (87%-92%). Then, in decreasing order of success, come bolt-ons, line extension equivalents, consolidation mature, multiple core related complementary, consolidation-emerging, single core related complementary, lynchpin strategic, and speculative strategic (15%-20%). Speculative strategic deals, which prompt “a collective financial market response of ‘Is this a joke?’ have included the NatWest/Gleacher deal, Coca-Cola’s purchase of film producer Columbia Pictures, AOL/Time Warner, eBay/Skype, and nearly every deal attempted by former Vivendi Universal chief executive officer Jean-Marie Messier.” (pp. 159-60)

More simply put, acquisitions fail for three key reasons. The acquirer could have selected the wrong target (Conseco/Green Tree, Quaker Oats/Snapple), paid too much for it (RBS Fortis/ABN Amro, AOL/Huffington Press), or poorly integrated it (AT&T/NCR, Terra Firma/EMI, Unum/Provident).

Be all this as it may, the signs point to a significant uptick in M&A activity in 2014. Thus, Dealogic reports that Global Technology M&A volume totals $22.4bn in 2014 YTD, up from $6.4bn in 2013 YTD and the highest YTD volume since 2006 ($34.8bn).

Global Economy Outlook – Some Problems

There seems to be a meme evolving around the idea that – while the official business outlook for 2014 is positive – problems with Chinese debt, or more generally, emerging markets could be the spoiler.

The encouraging forecasts posted by bank and financial economists (see Hatzius, for example) present 2014 as a balance of forces, with things tipping in the direction of faster growth in the US and Europe. Austerity constraints, sequestration in the US and draconian EU policies, will loosen, allowing the natural robustness of the underlying economy to assert itself – after years of sub-par performance. In the meanwhile, growth in the emerging economies is admittedly slowing, but is still is expected at much higher rates than in heartland areas of the industrial West or Japan.

So, fingers crossed, the World Bank and other official economic forecasting agencies show an uptick in economic growth in the US and, even, Europe for 2014.

But then we have articles that highlight emerging market risks:

China’s debtfuelled boom is in danger of turning to bust This Financial Times article develops the idea that only five developing countries have had a credit boom nearly as big as China’s, in each case leading to a credit crisis and slowdown. So currently Chinese “total debt” – a concept not well-defined in this short piece – is currently running about 230 per cent of gross domestic product. The article offers comparison with “33 previous credit binges” and to smaller economies, such as Taiwan, Thailand, Zimbabwe, and so forth. Strident, but not compelling.

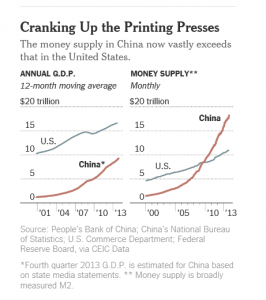
With China Awash in Money, Leaders Start to Weigh Raising the Floodgates  From the New York Times, a more solid discussion – The amount of money sloshing around China’s economy, according to a broad measure that is closely watched here, has now tripled since the end of 2006. China’s tidal wave of money has powered the economy to new heights, but it has also helped drive asset prices through the roof. Housing prices have soared, feeding fears of a bubble while leaving many ordinary Chinese feeling poor and left out.

The People’s Bank of China has been creating money to a considerable extent by issuing more renminbi to bankroll its purchase of hundreds of billions of dollars a year in currency markets to minimize the appreciation of the renminbi against the dollar and keep Chinese exports inexpensive in foreign markets; the central bank disclosed on Wednesday that the country’s foreign reserves, mostly dollars, soared $508.4 billion last year, a record increase.

 ChinaM2                 

Source: New York Times

Moreover, the rapidly expanding money supply reflects a flood of loans from the banking system and the so-called shadow banking system that have kept afloat many inefficient state-owned enterprises and bankrolled the construction of huge overcapacity in the manufacturing sector.

There also are two at least two recent, relevant posts by Yves Smith – who is always on the watch for sources of instability in the banking system

How Serious is China’s Shadow Banking/Wealth Management Products Problem?

China Credit Worries Rise as Large Shadow Banking Default Looms

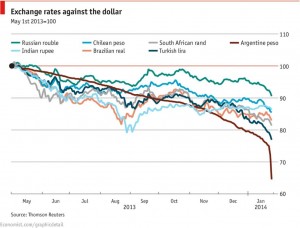
In addition to concerns about China, of course, there are major currency problems developing for Russia, India, Chile, Brazil, Turkey, South Africa, and Argentina.

emergingcurrencies

From the Economist The plunging currency club

So there are causes for concern, especially with the US Fed, under Janet Yellen, planning on winding down QE or quantitative easing.

When Easy Money Ends is a good read in this regard, highlighting the current scale of QE (quantitative easing) programs globally, and savings from lower interest rates – coupled with impacts of higher interest rates.

Since the start of the financial crisis, the Fed, the European Central Bank, the Bank of England, and the Bank of Japan have used QE to inject more than $4 trillion of additional liquidity into their economies…If interest rates were to return to 2007 levels, interest payments on government debt could rise by 20%, other things being equal…US and European nonfinancial corporations saved $710 billion from lower debt-service payments, with ultralow interest rates thus boosting profits by about 5% in the US and the UK, and by 3% in the euro-zone. This source of profit growth will disappear as interest rates rise, and some firms will need to reconsider business models – for example, private equity – that rely on cheap capital…We could also witness the return of asset-price bubbles in some sectors, especially real estate, if QE continues. The International Monetary Fund noted in 2013 that there were already “signs of overheating in real-estate markets” in Europe, Canada, and some emerging-market economies. 

2014 Outlook: Jan Hatzius Forecast for Global Economic Growth

Jan Hatzius is chief economist of Global Investment Research (GIR) at Goldman Sachs, and achieved notoriety with his early recognition of the housing bust in 2008.

Here he discusses the current outlook for 2014.

The outlook is fairly rosy, so it’s interesting Goldman just released “Where we worry: Risks to our outlook”, exerpted extensively at Zero Hedge.

Downside economic risks include:

1. Reduction in fiscal drag is less of a plus than we expect

2. Deleveraging obstacles continue to weigh on private demand

3. Less effective spare capacity leads to earlier wage/inflation pressure

4. Euro area risks resurface

5. China financial/credit concerns become critical


Stock Market Bubble in 2014?

As of November, Janet Yellen, newly confirmed Chair of the US Federal Reserve Bank, doesn’t think so.

As reported in the Wall Street Journal MONEYBEAT, she said,

Stock prices have risen pretty robustly”… But looking at several valuation measures — she specifically cited equity-risk premiums — she said: “you would not see stock prices in territory that suggest…bubble-like conditions.”

Her reference to equity-risk premiums sent me to Aswath Damodaran’s webpage, which estimates this metric -basically the extra return investors demand to lure them into stocks and out of the safety of government bonds (in the Updated Data section). It’s definitely an implied value, so it’s hard to judge.

But what are some of the other Pro’s and Con’s regarding a stock market bubble?

Pros – There Definitely is a Bubble

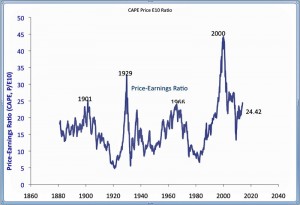
The CAPE (cylically adjusted price earnings ratio) is approaching 2007 levels. This is a metric developed by Robert Shiller and, according to him, is supposed to be a longer term indicator, rather than something that can signal short-term movements in the market. At the same time, recent interviews, who recently shared a Nobel prize in economics, indicate Shiller is currently ‘most worried’ about ‘boom’ in U.S. stock market. Here is his CAPE indext (click this and the other charts here to enlarge).

shiller-cape

Several sector and global bubbles are currently reinforcing each other. When one goes pop, it’s likely to bring down the house of cards. In the words of Jesse Columbo, whose warnings in 2007 were prescient,

..the global economic recovery is actually what I call a “Bubblecovery” or a bubble-driven economic recovery that is driven by inflating post-2009 bubbles in China, emerging markets, Australia, Canada, Northern and Western European housing, U.S. housing, U.S. healthcare, U.S. higher education, global bonds, and tech (Web 2.0 and social media).

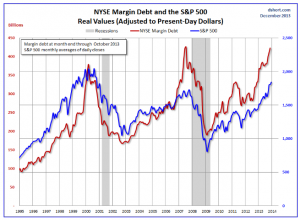
Margin debt, as reported by the New York Stock Exchange, is also at its all-time highs. Here’s a chart from Advisor Perspectives adjusting margin debt for inflation over a long period.

margindebt

Con – No Bubble Here

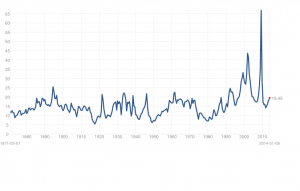
Stocks are the cheapest they have been in decades. This is true, as the chart below shows (based on trailing twelve month “as reported” earnings).

PEratios

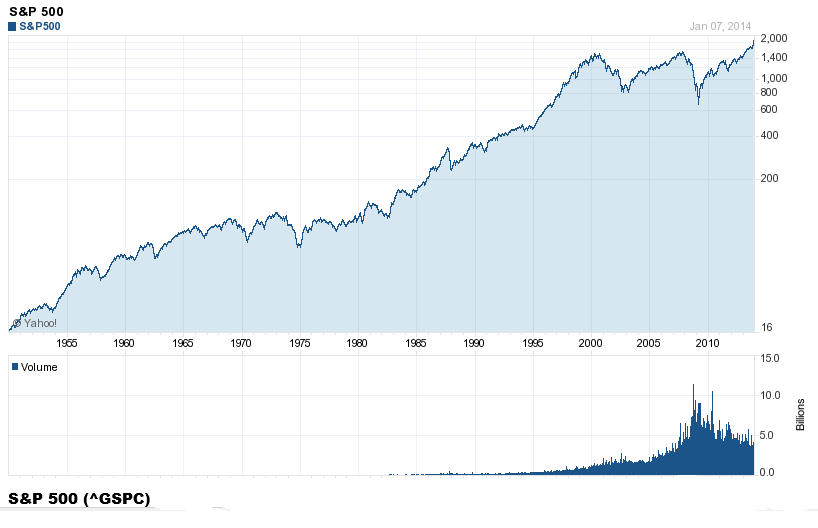
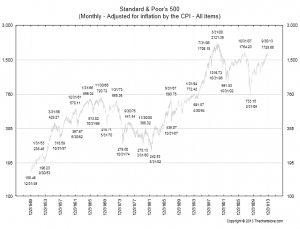
The S&P 500, adjusted for inflation, has not reached the peaks of either 2000 or2007 (chart from All Start Charts)

10-7-13-spx-inf-adj

Bottom Line

I must confess, doing the research for the post, that I think the stock market in the US may have a ways to go, before it hits its peak this time. Dr. Yelen’s appointment suggests quantitative easing (QE) and low interest rates may continue for some time, before the Fed takes away the punch bowl. My guess is that markets are just waiting at this point to see whether this is, in fact, what is likely to happen,  or whether others in the Fed will exercise stronger control over policy, now Ben Bernacke is gone.

And, as seems probable, Yellen consolidates her control and signals continuation of current policies, then I suspect we will see some wild increases in asset values here and globally.

What is a Market Bubble?

Let’s ask what might seem to be a silly question, but which turns out to be challenging. What is an asset bubble? How can asset bubbles be identified quantitatively?

Let me highlight two definitions – major in terms of the economics and analytical literature. And remember when working through “definitions” that the last major asset bubbles that burst triggered the recessions of 2008-2009 globally, resulting in the loss of tens of trillions of dollars.

You know, a trillion here and a trillion there, and pretty soon you are talking about real money.

Bubbles as Deviations from Values Linked to Economic Fundamentals

The first is simply that –

An asset price bubble is a price acceleration that cannot be explained in terms of the underlying fundamental economic variables

This comes from Dreger and Zhang, who cite earlier work by Case and Shiller, including their historic paper – Is There A Bubble in the Housing Market (2003)

Basically, you need a statistical or an econometric model which “explains” price movements in an asset market. While prices can deviate from forecasts produced by this model on a temporary basis, they will return to the predicted relationship to the set of fundamental variables at some time in the future, or eventually, or in the long run.

The sustained speculative distortions of the asset market then can be measured with reference to benchmark projections with this type of relationship and current values of the “fundamentals.”

This is the language of co-integrating relationships. The trick, then, is to identify a relationship between the asset price and its fundamental drivers which net out residuals that are white noise, or at least, ARMA – autoregressive moving average – residuals. Good luck with that!

Bubbles as Faster-Than-Exponential Growth

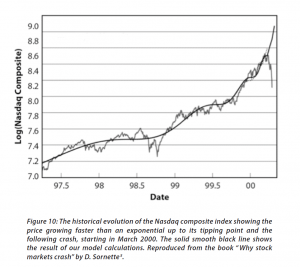
The second definition comes from Didier Sornette and basically is that an asset bubble exists when prices or values are accelerating at a faster-than-exponential rate.

This phenomenon is generated by behaviors of investors and traders that create positive feedback in the valuation of assets and unsustainable growth, leading to a finite-time singularity at some future time… From a technical view point, the positive feedback mechanisms include (i) option hedging, (ii) insurance portfolio strategies, (iii) market makers bid-ask spread in response to past volatility, (iv) learning of business networks and human capital build-up,(v) procyclical financing of firms by banks (boom vs contracting times), (vi) trend following investment strategies, (vii) asymmetric information on hedging strategies viii) the interplay of mark-to-market accounting and regulatory capital requirements. From a behavior viewpoint, positive feedbacks emerge as a result of the propensity of humans to imitate, their social gregariousness and the resulting herding.

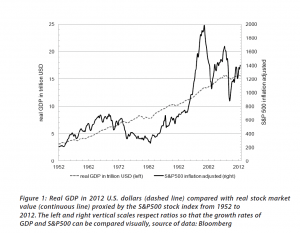
Fundamentals still benchmark asset prices in this approach, as illustrated by this chart.
 Sornett2012            

Here GDP and U.S. stock market valuation grow at approximately the same rate, suggesting a “cointegrated relationship,” such as suggested with the first definition of a bubble introduced above.

However, the market has shown three multiple-year periods of excessive valuation, followed by periods of consolidation.

These periods of bubbly growth in prices are triggered by expectations of higher prices and the ability to speculate, and are given precise mathematical expression in the JLS (Johansen-Ledoit-Sornette) model.

The behavioral underpinnings are familiar and can explained with reference to housing, as follows.

The term “bubble” refers to a situation in which excessive future expectations cause prices to rise. For instance, during a house-price bubble, buyers think that a home that they would normally consider too expensive is now an acceptable purchase because they will be compensated by significant further \price increases. They will not need to save as much as they otherwise might, because they expect the increased value of their home to do the saving for them. First-time homebuyers may also worry during a bubble that if they do not buy now, they will not be able to afford a home later. Furthermore, the expectation of large price increases may have a strong impact on demand if people think that home prices are very unlikely to fall, and certainly not likely to fall for long, so that there is little perceived risk associated with an investment in a home.

The concept of “faster-than-exponential” growth also is explicated in this chart from a recent article (2011), and originally from Why Stock Markets Crash, published by Princeton.
Sornette2012B

In a recent methodological piece, Sornette and co-authors cite an extensive list of applications of their approach.

..the JLS model has been used widely to detect bubbles and crashes ex-ante (i.e., with advanced documented notice in real time) in various kinds of markets such as the 2006-2008 oil bubble [5], the Chinese index bubble in 2009 [6], the real estate market in Las Vegas [7], the U.K. and U.S. real estate bubbles [8, 9], the Nikkei index anti-bubble in 1990-1998 [10] and the S&P 500 index anti-bubble in 2000-2003 [11]. Other recent ex-post studies include the Dow Jones Industrial Average historical bubbles [12], the corporate bond spreads [13], the Polish stock market bubble [14], the western stock markets [15], the Brazilian real (R$) – US dollar (USD) exchange rate [16], the 2000-2010 world major stock indices [17], the South African stock market bubble [18] and the US repurchase agreements market [19].

I refer readers to the above link for the specifics of these references. Note, in general, most citations in this post are available as PDF files from a webpage maintained by the Swiss Federal Institute of Technology.

The Psychology of Asset Bubbles

After wrestling with this literature for several months, including some advanced math and econometrics, it seems to me that it all comes down, in the heat of the moment just before the bubble crashes, to psychology.

How does that go?

A recent paper coauthored by Sornette and Cauwels and others summarize the group psychology behind asset bubbles.

In its microeconomic formulation, the model assumes a hierarchical organization of the market, comprised of two groups of agents: a group with rational expectations (the value investors), and a group of “noise” agents, who are boundedly rational and exhibit herding behavior (the trend followers). Herding is assumed to be self-reinforcing, corresponding to a nonlinear trend following behavior, which creates price-to-price positive feedback loops that yield an accelerated growth process. The tension and competition between the rational agents and the noise traders produces deviations around the growing prices that take the form of low-frequency oscillations, which increase in frequency due to the acceleration of the price and the nonlinear feedback mechanisms, as the time of the crash approaches.

Examples of how “irrational” agents might proceed to fuel an asset bubble are given in a selective review of the asset bubble literature developed recently by Anna Scherbina from which I take several extracts below.

For example, there is “feedback trading” involving traders who react solely to past price movements (momentum traders?). Scherbina writes,

In response to positive news, an asset experiences a high initial return. This is noticed by a group of feedback traders who assume that the high return will continue and, therefore, buy the asset, pushing prices above fundamentals. The further price increase attracts additional feedback traders, who also buy the asset and push prices even higher, thereby attracting subsequent feedback traders, and so on. The price will keep rising as long as more capital is being invested. Once the rate of new capital inflow slows down, so does the rate of price growth; at this point, capital might start flowing out, causing the bubble to deflate.

Other mechanisms are biased self-attribution and the representativeness heuristic. In biased self-attribution,

..people to take into account signals that confirm their beliefs and dismiss as noise signals that contradict their beliefs…. Investors form their initial beliefs by receiving a noisy private signal about the value of a security.. for example, by researching the security. Subsequently, investors receive a noisy public signal…..[can be]  assumed to be almost pure noise and therefore should be ignored. However, since investors suffer from biased self-attribution, they grow overconfident in their belief after the public signal confirms their private information and further revise their valuation in the direction of their private signal. When the public signal contradicts the investors’ private information, it is appropriately ignored and the price remains unchanged. Therefore, public signals, in expectation, lead to price movements in the same direction as the initial price response to the private signal. These subsequent price moves are not justified by fundamentals and represent a bubble. The bubble starts to deflate after the accumulated public signals force investors to eventually grow less confident in their private signal.

Scherbina describes the representativeness heuristic as follows.

 The fourth model combines two behavioral phenomena, the representativeness heuristic and the conservatism bias. Both phenomena were previously documented in psychology and represent deviations from optimal Bayesian information processing. The representativeness heuristic leads investors to put too much weight on attention-grabbing (“strong”) news, which causes overreaction. In contrast, conservatism bias captures investors’ tendency to be too slow to revise their models, such that they underweight relevant but non-attention-grabbing (routine) evidence, which causes underreaction… In this setting, a positive bubble will arise purely by chance, for example, if a series of unexpected good outcomes have occurred, causing investors to over-extrapolate from the past trend. Investors make a mistake by ignoring the low unconditional probability that any company can grow or shrink for long periods of time. The mispricing will persist until an accumulation of signals forces investors to switch from the trending to the mean-reverting model of earnings.

Interesting, several of these “irrationalities” can generate negative, as well as positive bubbles.

Finally, Scherbina makes an important admission, namely that

 The behavioral view of bubbles finds support in experimental studies. These studies set up artificial markets with finitely-lived assets and observe that price bubbles arise frequently. The presence of bubbles is often attributed to the lack of common knowledge of rationality among traders. Traders expect bubbles to arise because they believe that other traders may be irrational. Consequently, optimistic media stories and analyst reports may help create bubbles not because investors believe these views but because the optimistic stories may indicate the existence of other investors who do, destroying the common knowledge of rationality.

And let me pin that down further here.

Asset Bubbles – the Evidence From Experimental Economics

Vernon Smith is a pioneer in experimental economics. One of his most famous experiments concerns the genesis of asset bubbles.

Here is a short video about this widely replicated experiment.

Stefan Palan recently surveyed these experiments, and also has a downloadable working paper (2013) which collates data from them.

This article is based on the results of 33 published articles and 25 working papers using the experimental asset market design introduced by Smith, Suchanek and Williams (1988). It discusses the design of a baseline market and goes on to present a database of close to 1600 individual bubble measure observations from experiments in the literature, which may serve as a reference resource for the quantitative comparison of existing and future findings.

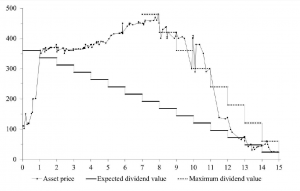
A typical pattern of asset bubble formation emerges in these experiments.
bubleexperimental

As Smith relates in the video, the experimental market is comprised of student subjects who can both buy and sell and asset which declines in value to zero over a fixed period. Students can earn real money at this, and cannot communicate with others in the experiment.

Noahpinion has further discussion of this type of bubble experiment, which, as Palan writes, is the best-documented experimental asset market design in existence and thus offers a superior base of comparison for new work.

There are convergent lines of evidence about the reality and dynamics of asset bubbles, and a growing appreciation that, empirically, asset bubbles share a number of characteristics.

That may not be enough to convince the mainstream economics profession, however, as a humorous piece by Hirshleifer (2001), quoted by a German researcher a few years back, suggests –

In the muddled days before the rise of modern finance, some otherwise-reputable economists, such as Adam Smith, Irving Fisher, John Maynard Keynes, and Harry Markowitz, thought that individual psychology affects prices. What if the creators of asset pricing theory had followed this thread? Picture a school of sociologists at the University of Chicago proposing the Deficient Markets Hypothesis: that prices inaccurately reflect all available information. A brilliant Stanford psychologist, call him Bill Blunte, invents the Deranged Anticipation and Perception Model (or DAPM), in which proxies for market misevaluation are used to predict security returns. Imagine the euphoria when researchers discovered that these mispricing proxies (such as book/market, earnings/price, and past returns) and mood indicators such as amount of sunlight, turned out to be strong predictors of future returns. At this point, it would seem that the deficient markets hypothesis was the best-confirmed theory in the social sciences.