Tag Archives: predictive analytics

Behavioral Economics and Holiday Gifts

Chapter 1 of Advances in Behavioral Economics highlights the core proposition of this emerging field – namely that real economic choices over risky outcomes do not conform to the expected utility (EU) hypothesis.

The EU hypothesis states that the utility of a risky distribution of outcomes is a probability-weighted average of the outcome utilities. Many violations of this principle are demonstrated with psychological experiments.

These violations suggest “nudge” theory – that small, apparently inconsequential changes in the things people use can have disproportionate effects on behavior.

Along these lines, I found this PBS report by Paul Solman fascinating. In it, Solman, PBS economics correspondent, talks to Sendhil Mullainathan at Harvard University about consumer innovations that promise to improve your life through behavioral economics – and can be gifts for this Season. 

Happy Holidays all. 

Updates on Forecasting Controversies – Google Flu Trends

Last Spring I started writing about “forecasting controversies.”

A short list of these includes Google’s flu forecasting algorithm, impacts of Quantitative Easing, estimates of energy reserves in the Monterey Shale, seasonal adjustment of key series from Federal statistical agencies, and China – Trade Colossus or Assembly Site?

Well, the end of the year is a good time to revisit these, particularly if there are any late-breaking developments.

Google Flu Trends

Google Flu Trends got a lot of negative press in early 2014. A critical article in Nature – When Google got flu wrong – kicked it off. A followup Times article used the phrase “the limits of big data,” while the Guardian wrote of Big Data “hubris.”

The problem was, as the Google Trends team admits –

In the 2012/2013 season, we significantly overpredicted compared to the CDC’s reported U.S. flu levels.

Well, as of October, Google Flu Trends has a new engine. This like many of the best performing methods … in the literature—takes official CDC flu data into account as the flu season progresses.

Interestingly, the British Royal Society published an account at the end of October – Adaptive nowcasting of influenza outbreaks using Google searches – which does exactly that – merges Google Flu Trends and CDC data, achieving impressive results.

The authors develop ARIMA models using “standard automatic model selection procedures,” citing a 1998 forecasting book by Hyndman, Wheelwright, and Makridakis and a recent econometrics text by Stock and Watson. They deploy these adaptively-estimated models in nowcasting US patient visits due to influenza-like illnesses (ILI), as recorded by the US CDC.

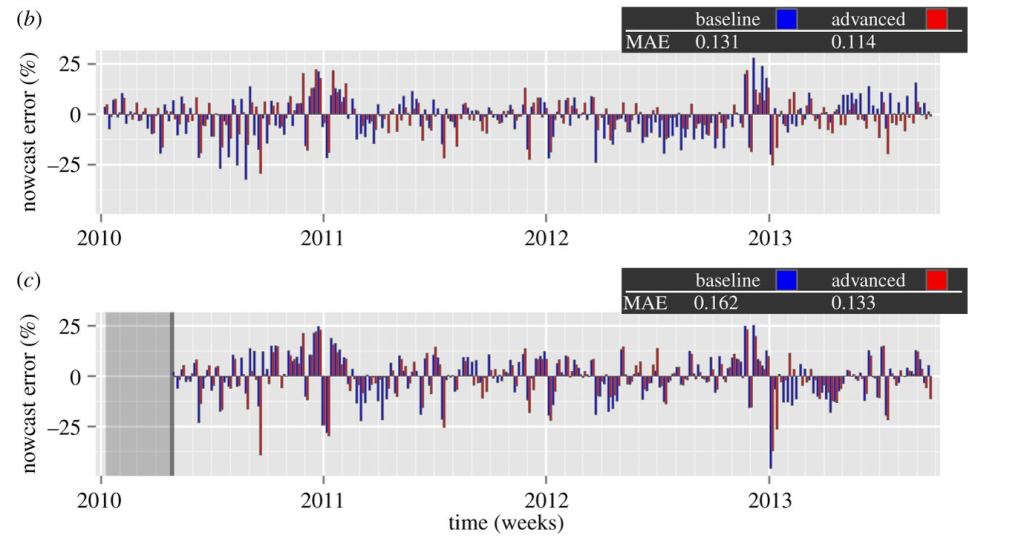
The results are shown in the following panel of charts.

GoogleFluTrends

Definitely click on this graphic to enlarge it, since the key point is the red bars are the forecast or nowcast models incorporating Google Flu Trends data, while the blue bars only utilize more conventional metrics, such as those supplied by the Centers for Disease Control (CDC). In many cases, the red bars are smaller than the blue bar for the corresponding date.

The lower chart labeled ( c ) documents out-of-sample performance. Mean Absolute Error (MAE) for the models with Google Flu Trends data are 17 percent lower.

It’s relevant , too, that the authors, Preis and Moat, utilize unreconstituted Google Flu Trends output – before the recent update, for example – and still get highly significant improvements.

I can think of ways to further improve this research – for example, deploy the Hyndman R programs to automatically parameterize the ARIMA models, providing a more explicit and widely tested procedural referent.

But, score one for Google and Hal Varian!

The other forecasting controversies noted above are less easily resolved, although there are developments to mention.

Stay tuned.

2014 in Review – I

I’ve been going over past posts, projecting forward my coming topics. I thought I would share some of the best and some of the topics I want to develop.

Recommendations From Early in 2014

I would recommend Forecasting in Data-Limited Situations – A New Day. There, I illustrate the power of bagging to “bring up” the influence of weakly significant predictors with a regression example. This is fairly profound. Weakly significant predictors need not be weak predictors in an absolute sense, providing you can bag the sample to hone in on their values.

There also are several posts on asset bubbles.

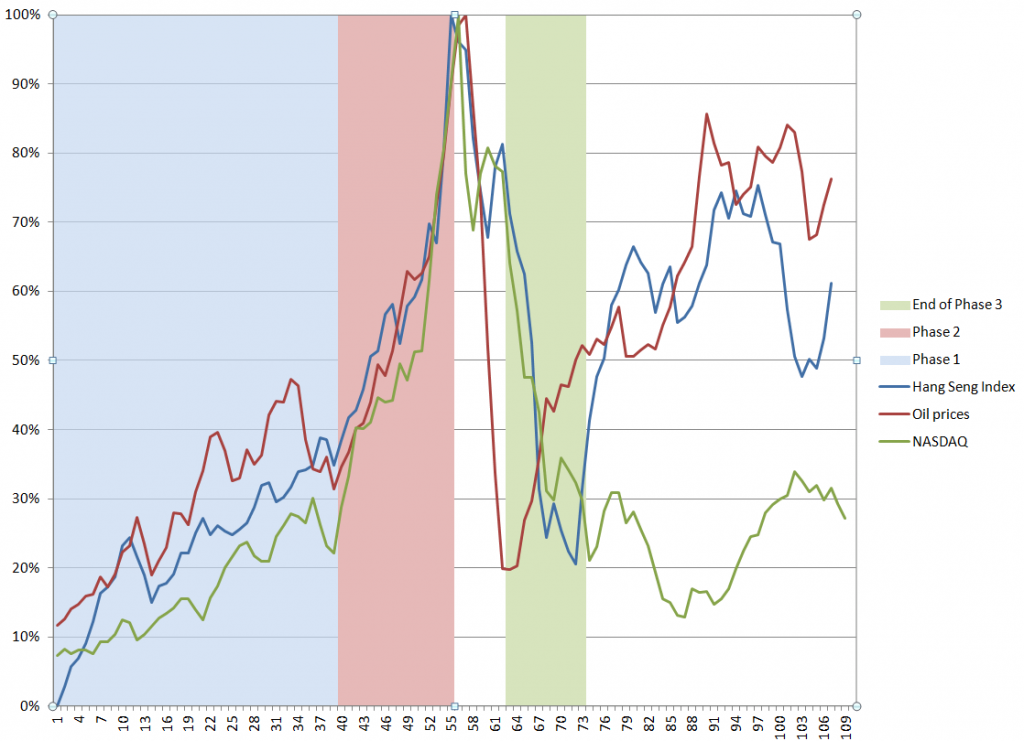
Asset Bubbles contains an intriguing chart which proposes a way to “standardize” asset bubbles, highlighting their different phases.

BubbleAnatomy

The data are from the Hong Kong Hang Seng Index, oil prices to refiners (combined), and the NASDAQ 100 Index. I arrange the series so their peak prices – the peak of the bubble – coincide, despite the fact that the peaks occurred at different times (October 2007, August 2008, March 2000, respectively). Including approximately 5 years of prior values of each time series, and scaling the vertical dimensions so the peaks equal 100 percent, suggesting three distinct phases. These might be called the ramp-up, faster-than-exponential growth, and faster-than-exponential decline. Clearly, I am influenced by Didier Sornette in choice of these names.

I’ve also posted several times on climate change, but I think, hands down, the most amazing single item is this clip from “Chasing Ice” showing calving of a Greenland glacier with shards of ice three times taller than the skyscrapers in Lower Manhattan.

See also Possibilities for Abrupt Climate Change.

I’ve been told that Forecasting and Data Analysis – Principal Component Regression is a helpful introduction. Principal component regression is one of the several ways one can approach the problem of “many predictors.”

In terms of slide presentations, the Business Insider presentation on the “Digital Future” is outstanding, commented on in The Future of Digital – I.

Threads I Want to Build On

There are threads from early in the year I want to follow up in Crime Prediction. Just how are these systems continuing to perform?

Another topic I want to build on is in Using Math to Cure Cancer. I’d like to find a sensitive discussion of how MD’s respond to predictive analytics sometime. It seems to me that US physicians are sometimes way behind the curve on what could be possible, if we could merge medical databases and bring some machine learning to bear on diagnosis and treatment.

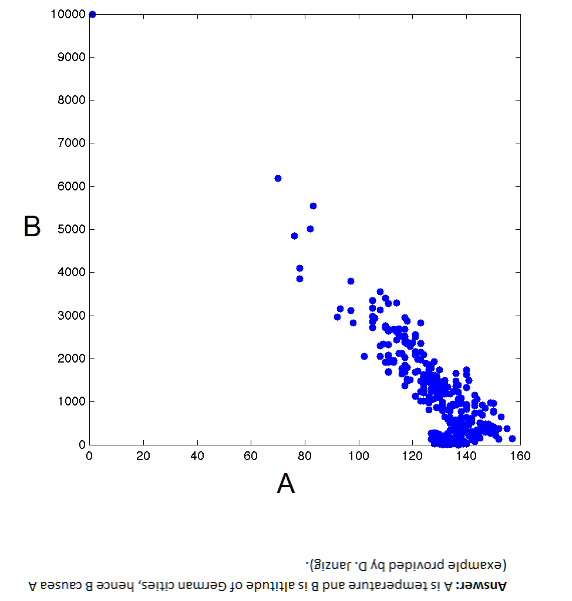
I am intrigued by the issues in Causal Discovery. You can get the idea from this chart. Here, B → A but A does not cause B – Why?

casualpic

I tried to write an informed post on power laws. The holy grail here is, as Xavier Gabaix says, robust, detail-independent economic laws.

Federal Reserve Policies

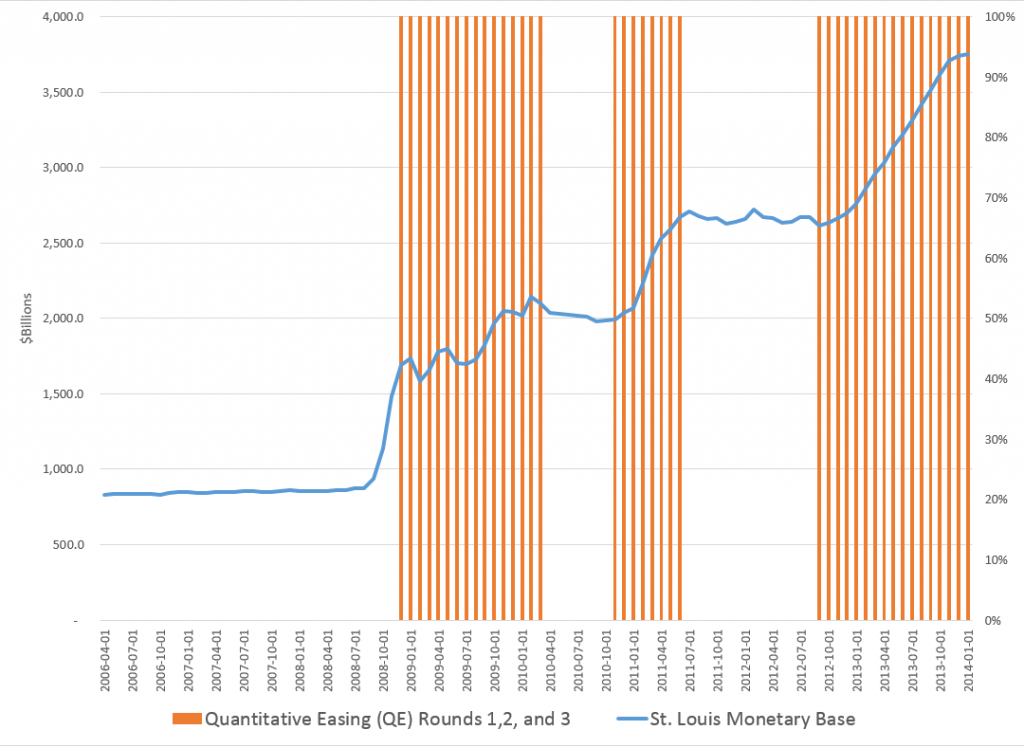
Federal Reserve policies are of vital importance to business forecasting. In the past two or three years, I’ve come to understand the Federal Reserve Balance sheet better, available from Treasury Department reports. What stands out is this chart, which anyone surfing finance articles on the net has seen time and again.

FedMBandQEgraph

This shows the total of the “monetary base” dating from the beginning of 2006. The red shaded areas of the graph indicate the time windows in which the various “Quantitative Easing” (QE) policies have been in effect – now three QE’s, QE1, QE2, and QE3.

Obviously, something is going on.

I had fun with this chart in a post called Rhino and Tapers in the Room – Janet Yellen’s Menagerie.

OK, folks, for this intermission, you might want to take a look at Malcolm Gladwell on the 10,000 Hour Rule


So what happens if you immerse yourself in all aspects of the forecasting field?

Coming – how posts in Business Forecast Blog pretty much establish that rational expectations is a concept way past its sell date.

Guy contemplating with wine at top from dreamstime.


Links – Beginning of the Holiday Season

Economy and Trade

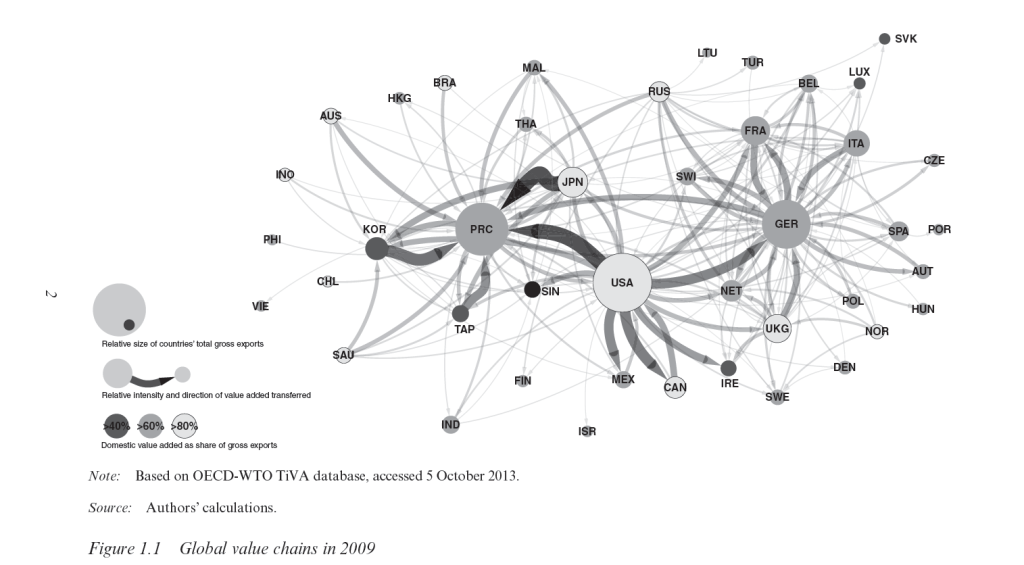
Asia and Global Production Networks—Implications for Trade, Incomes and Economic Vulnerability Important new book –

The publication has two broad themes. The first is national economies’ heightened exposure to adverse shocks (natural disasters, political disputes, recessions) elsewhere in the world as a result of greater integration and interdependence. The second theme is focused on the evolution of global value chains at the firm level and how this will affect competitiveness in Asia. It also traces the past and future development of production sharing in Asia.

Chapter 1 features the following dynamite graphic – (click to enlarge)

GVC2009

The Return of Currency Wars

Nouriel Roubini –

Central banks in China, South Korea, Taiwan, Singapore, and Thailand, fearful of losing competitiveness relative to Japan, are easing their own monetary policies – or will soon ease more. The European Central Bank and the central banks of Switzerland, Sweden, Norway, and a few Central European countries are likely to embrace quantitative easing or use other unconventional policies to prevent their currencies from appreciating.

All of this will lead to a strengthening of the US dollar, as growth in the United States is picking up and the Federal Reserve has signaled that it will begin raising interest rates next year. But, if global growth remains weak and the dollar becomes too strong, even the Fed may decide to raise interest rates later and more slowly to avoid excessive dollar appreciation.

The cause of the latest currency turmoil is clear: In an environment of private and public deleveraging from high debts, monetary policy has become the only available tool to boost demand and growth. Fiscal austerity has exacerbated the impact of deleveraging by exerting a direct and indirect drag on growth. Lower public spending reduces aggregate demand, while declining transfers and higher taxes reduce disposable income and thus private consumption.

Financial Markets

The 15 Most Valuable Startups in the World

Uber is among the top, raising $2.5 billion in direct investment funds since 2009. Airbnb, Dropbox, and many others.

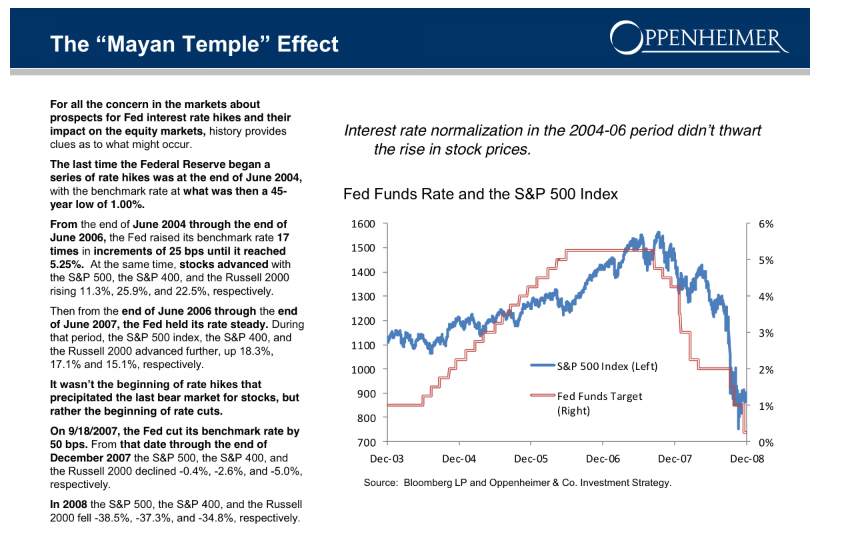
The Stock Market Bull Who Got 2014 Right Just Published This Fantastic Presentation I especially like the “Mayan Temple” effect, viz

MayanTemple

Why Gold & Oil Are Trading So Differently supply and demand – worth watching to keep primed on the key issues.

Technology

10 Astonishing Technologies On The Horizon – Some of these are pretty far-out, like teleportation which is now just gleam in the eye of quantum physicists, but some in the list are in prototype – like flying cars. Read more at Digital Journal entry on Business Insider.

  1. Flexible and bendable smartphones
  2. Smart jewelry
  3. “Invisible” computers
  4. Virtual shopping
  5. Teleportation
  6. Interplanetary Internet
  7. Flying cars
  8. Grow human organs
  9. Prosthetic eyes
  10. Electronic tattoos

Albert Einstein’s Entire Collection of Papers, Letters is Now Online

Princeton University Press makes this available.

AEinstein

Practice Your French Comprehension

Olivier Grisel, Software Engineer, Inria – broad overview of machine learning technologies. Helps me that the slides are in English.

Forecasting Holiday Retail Sales

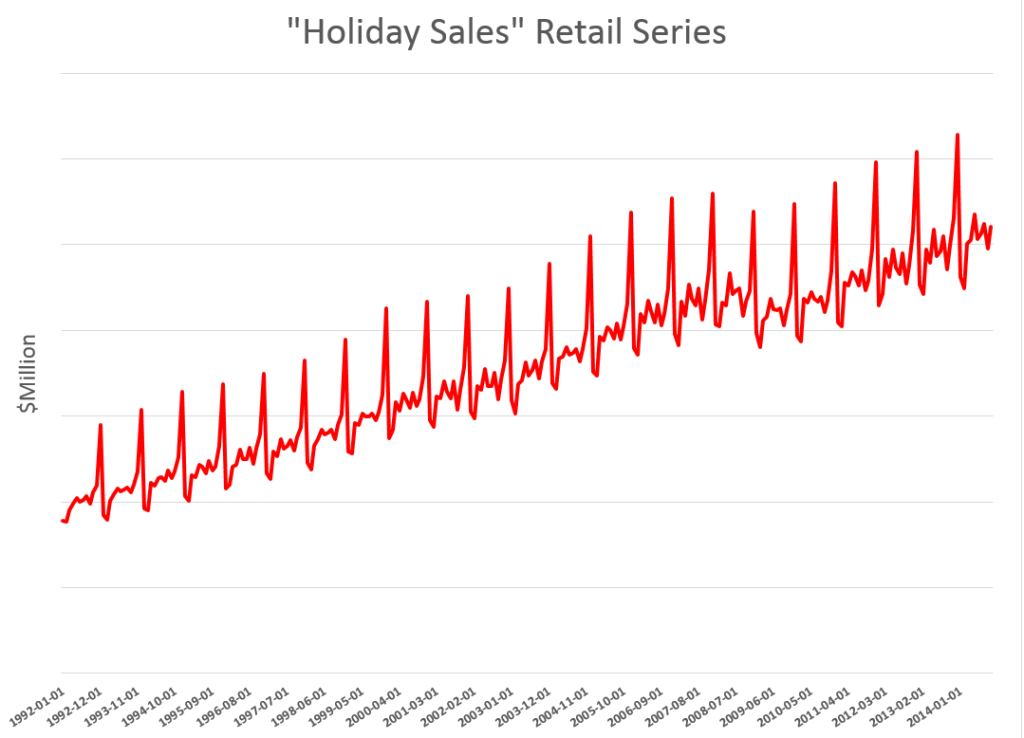
Holiday retail sales are a really “spikey” time series, illustrated by the following graph (click to enlarge).

HolidayRetailSales

These are monthly data from FRED and are not seasonally adjusted.

Following the National Retail Federation (NRF) convention, I define holiday retail sales to exclude retail sales by automobile dealers, gasoline stations and restaurants. The graph above includes all months of the year, but we can again follow the NRF convention and define “sales from the Holiday period” as being November and December sales.

Current Forecasts

The National Retail Federation (NRF) issues its forecast for the Holiday sales period in late October.

This year, it seems they were a tad optimistic, opting for

..sales in November and December (excluding autos, gas and restaurant sales) to increase a healthy 4.1 percent to $616.9 billion, higher than 2013’s actual 3.1 percent increase during that same time frame.

As the news release for this forecast observed, this would make the Holiday Season 2014 the first time in many years to see more than 4 percent growth – comparing to the year previous holiday periods.

The NRF is still holding to its bet (See https://nrf.com/news/retail-sales-increase-06-percent-november-line-nrf-holiday-forecast), noting that November 2014 sales come in around 3.2 percent over the total for November in 2013.

This means that December sales have to grow by about 4.8 percent on a month-over-year-previous-month basis to meet the overall, two month 4.1 percent growth.

You don’t get to this number by applying univariate automatic forecasting software. Forecast Pro, for example, suggests overall year-over-year growth this holiday season will be more like 3.3 percent, or a little lower than the 2013 growth of 3.7 percent.

Clearly, the argument for higher growth is the extra cash in consumer pockets from lower gas prices, as well as the strengthening employment outlook.

The 4.1 percent growth, incidentally, is within the 97.5 percent confidence interval for the Forecast Pro forecast, shown in the following chart.

FPHolidaySales

This forecast follows from a Box-Jenkins model with the parameters –

ARIMA(1, 1, 3)*(0, 1, 2)

In other words, Forecast Pro differences the “Holiday Sales” Retail Series and finds moving average and autoregressive terms, as well as seasonality. For a crib on ARIMA modeling and the above notation, a Duke University site is good.

I guess we will see which is right – the NRF or Forecast Pro forecast.

Components of US Retail Sales

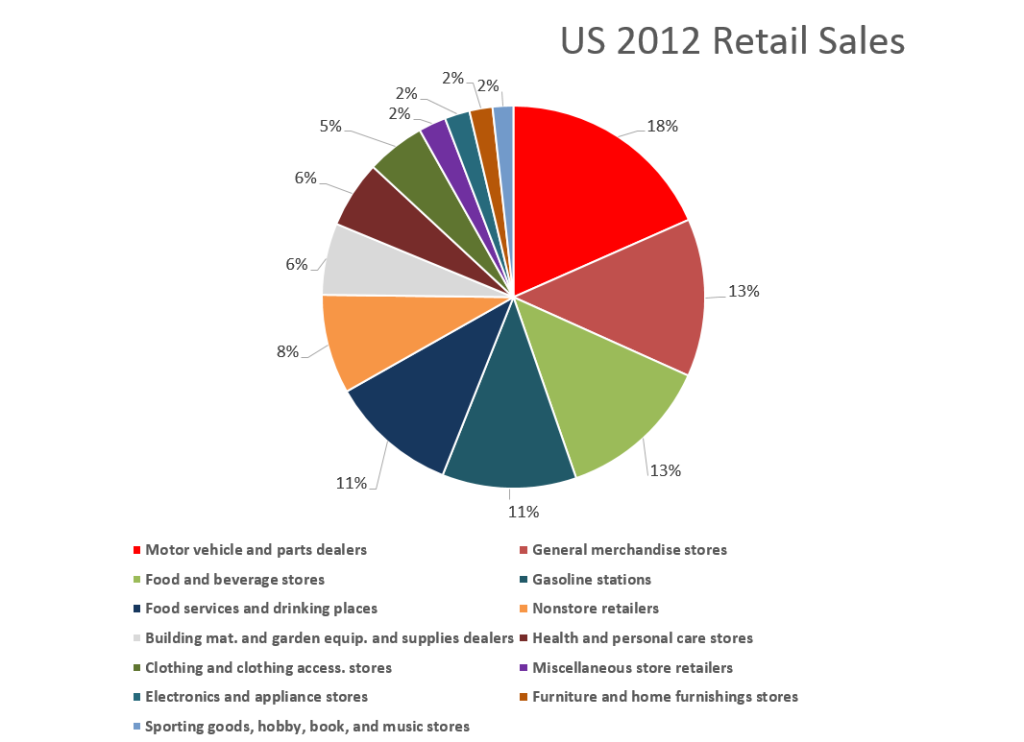
The following graphic shows the composition of total US retail sales, and the relative sizes of the main components.

USRETAILPIE 

Retail and food service sales totaled around $5 trillion in 2012. Taking out motor vehicle and parts dealers, gas stations, and food services and drinking places considerably reduces the size of the relevant Holiday retail time series.

Forecasting Issues and Opportunities

I have not yet done the exercise, but it would be interesting to forecast the individual series in the above pie chart, and compare the sum of those forecasts with a forecast of the total.

For example, if some of the component series are best forecast with exponential smoothing, while others are best forecast with Box-Jenkins time series models, aggregation could be interesting.

Of course, in 2007-09, application of univariate methods would have performed poorly. What we cry out for here is a multivariate model, perhaps based on the Kalman filter, which specifies leading indicators. That way, we could get one or two month ahead forecasts without having to forecast the drivers or explanatory variables.

In any case, barring unforeseen catastrophes, this Holiday Season should show comfortable growth for retailers, especially online retail (more on that in a subsequent post.)

Heading picture from New York Times

Big Data and Fracking

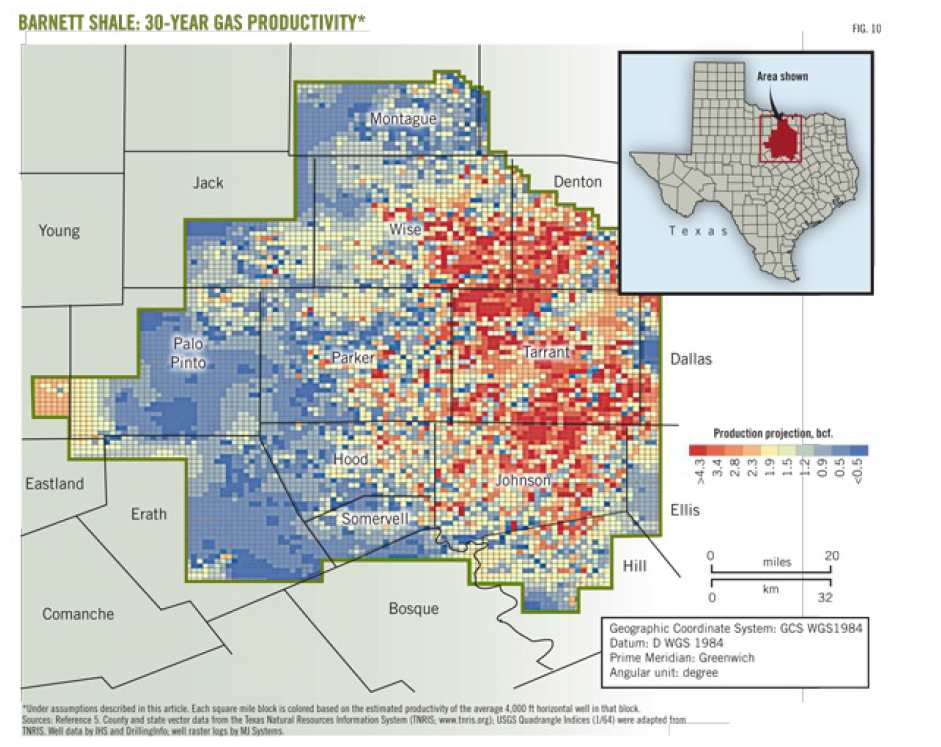
Texas’ Barnett Shale, shown below, is the focus of recent Big Data analytics conducted by the Texas Bureau of Economic Geology.

BarnettShale

The results provide, among other things, forecasts of when natural gas production from this field will peak – suggesting at current prices that peak production may already have been reached.

The Barnett Shale study examines production data from all individual wells drilled 1995-2010 in this shale play in the Fort Worth basin – altogether more than 15,000 wells.

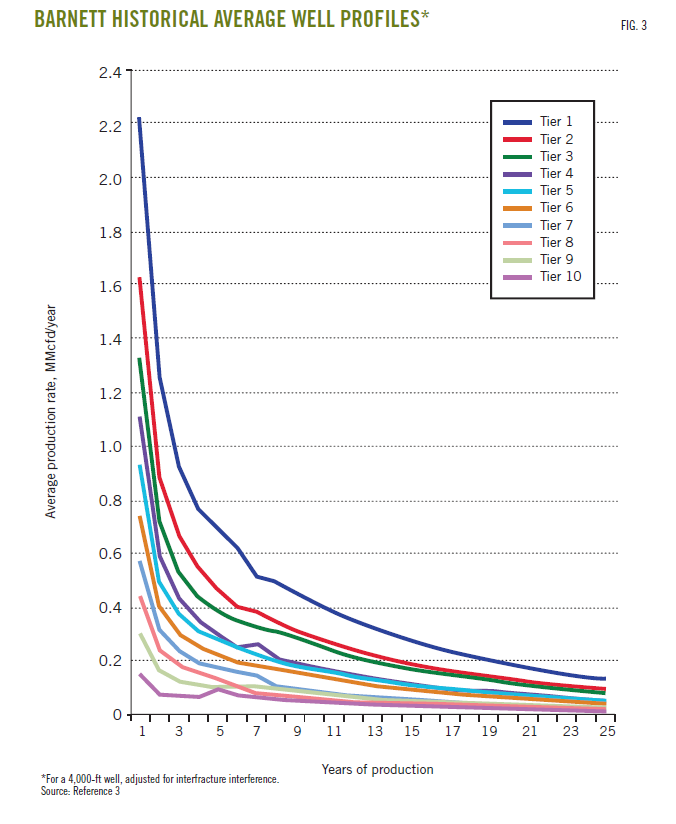
Well-by-well analysis leads to segmentation of natural gas and liquid production potential in 10 productivity tiers, which are then used to forecast future production.

Decline curves, such as the following, are developed for each of these productivity tiers. The per-well production decline curves were found to be inversely proportional to the square root of time for the first 8-10 years of well life, followed by exponential decline as what the geologists call “interfracture interference” began to affect production.

TierDCurves

A write-up of the Barnett Shale study by its lead researchers is available to the public in two parts at the following URL’s:

http://www.beg.utexas.edu/info/docs/OGJ_SFSGAS_pt1.pdf

http://www.beg.utexas.edu/info/docs/OGJ_SFSGAS_pt2.pdf

Econometric analysis of well production, based on porosity and a range of other geologic and well parameters is contained in a followup report Panel Analysis of Well Production History in the Barnett Shale conducted under the auspices of Rice University.

Natural Gas Production Forecasts

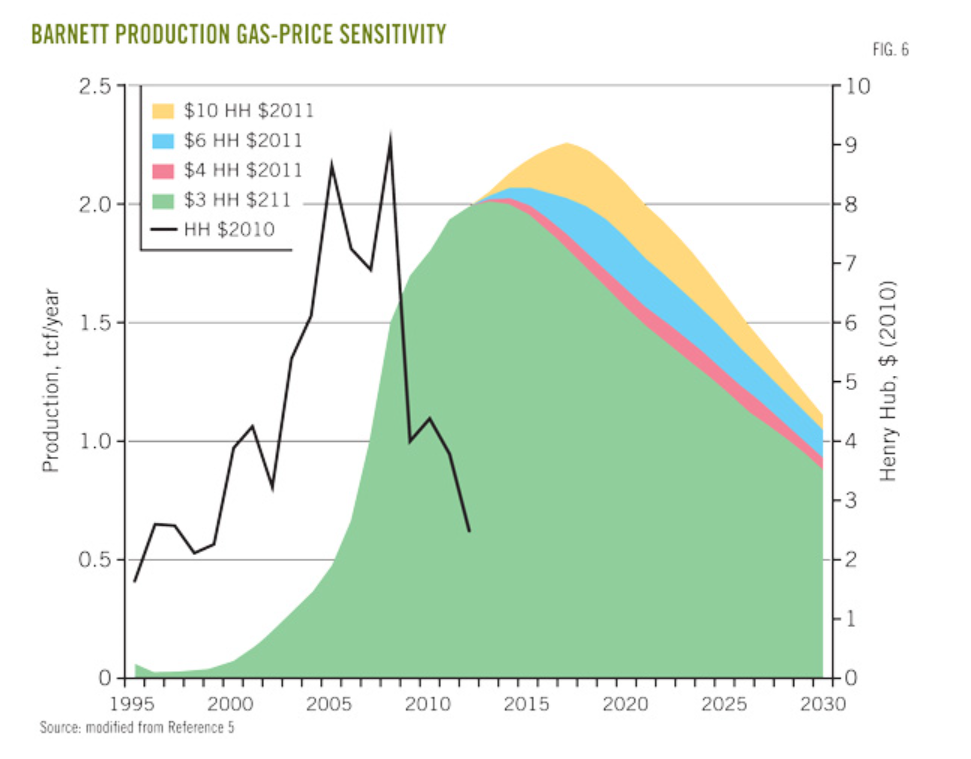
Among the most amazing conclusions for me are the predictions regarding total natural gas production at various prices, shown below.

Barnetshalecurvelater

This results from a forecast of field development (drilling) which involved a period of backcasting 2011-2012 to calibrate the BEG economic and production forecast models.

Essentially, it this low price regime continues through 2015, there is a high likelihood we will see declining production in the Barnett field as a whole.

Of course, there are other major fields – the Bakken, the Marcellus, the Eagle-Ford, and a host of smaller, newer fields.

But the Barnett Shale study provides good parameters for estimating EUR (estimate ultimate recovery) in these other fields, as well as time profiles of production at various prices.

The Limits of OPEC

There’s rampant speculation and zero consensus about the direction OPEC will take in their upcoming Vienna meeting, November 27.

Last Friday, for example. Bloomberg reported,

The 20 analysts surveyed this week by Bloomberg are perfectly divided, with half forecasting the Organization of Petroleum Exporting Countries will cut supply on Nov. 27 in Vienna to stem a plunge in prices while the other half expect no change. In the seven years since the surveys began, it’s the first time participants were evenly split. The only episode that created a similar debate was the OPEC meeting in late 2007, when crude was soaring to a record.

Many discussions pose the strategic choice as one between –

(a) cutting production to maintain prices, but at the cost of losing market share to the ascendant US producers, and

(b) sustaining current production levels, thus impacting higher-cost US producers (if the low prices last long enough), but risking even lower oil prices – through speculation and producers breaking ranks and trying to grab what they can.

Lybia, Ecuador, and Venezuela are pushing for cuts in production. Saudi Arabia is not tipping its hand, but is seen by many as on the fence about reducing production.

I’m kind of a contrarian here. I think the sound and fury about this Vienna meeting on Thanksgiving may signify very little in terms of oil prices – unless global (and especially Chinese) economic growth picks up. As the dominant OPEC producer, Saudi Arabia may have market power, but, otherwise, there is little evidence OPEC functions as a cartel. It’s hard to see, also, that the Saudi’s would unilaterally reduce their output only to see higher oil prices support US frackers continuing to increase their production levels at current rates.

OPEC Members, Production, and Oil Prices

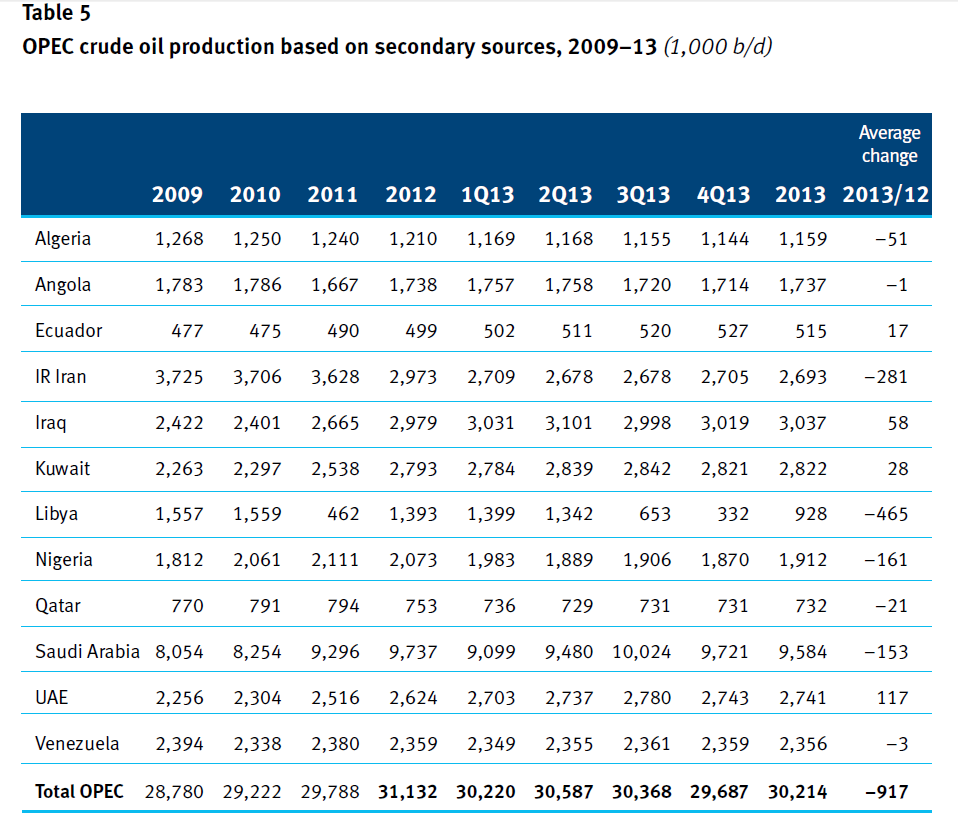
The Organization of Petroleum Exporting Countries (OPEC) has twelve members, whose production over recent years is documented in the following table.

OPECprod

According to the OPEC Annual Report, global oil supply in 2013 ran about 90.2 mb/d, while, as the above table indicates, OPEC production was 30.2 mb/d. So OPEC provided 33.4 percent of global oil supplies in 2013 with Saudi Arabia being the largest producer – overwhelmingly.

Oil prices, of course, have spiraled down toward $75 a barrel since last summer.

WTIchart

Is OPEC an Effective Cartel?

There is a growing literature questioning whether OPEC is an effective cartel.

This includes the recent OPEC: Market failure or power failure? which argues OPEC is not a working cartel and that Saudi Arabia’s ideal long term policy involves moderate prices guaranteed to assure continuing markets for their vast reserves.

Other recent studies include Does OPEC still exist as a cartel? An empirical investigation which deploys time series tests for cointegration and Granger causality, finding that OPEC is generally a price taker, although cartel-like features may adhere to a subgroup of its members.

The research I especially like, however, is by Jeff Colgan, a political scientist – The Emperor Has No Clothes: The Limits of OPEC in the Global Oil Market.

Colgan poses four tests of whether OPEC functions as a cartel -.

new members of the cartel have a decreasing or decelerating production rate (test #1); members should generally produce quantities at or below their assigned quota (test #2); changes in quotas should lead to changes in production, creating a correlation (test #3); and members of the cartel should generally produce lower quantities (i.e., deplete their oil at a lower rate) on average than non-members of the cartel (test #4)

Each of these tests fail, putting, as he writes, the burden of proof on those who would claim that OPEC is a cartel.

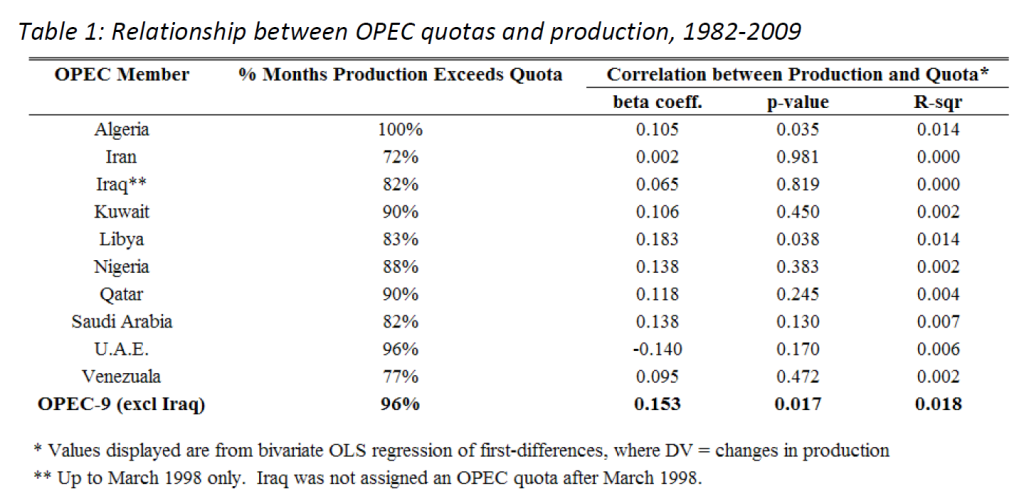
Here’s Colgan’s statistical analysis of cheating on the quotas.

OPECquota

On average, he calculates that the nine principal members of OPEC produced 10 percent more oil than their quotas allowed – which is equivalent to 1.8 million barrels per day, on average, which is more than the total daily output of Libya in 2009.

Finally, there is the extremely wonkish evidence from academic studies of oil and gas markets more generally.

There are, for example, several long term studies of cointegration of oil and gas markets. These studies rely on tests for unit roots which, as I have observed, have low statistical power. Nevertheless, the popularity of this hypothesis seems to be consistent with very little specific influence of OPEC on oil production and prices in recent decades. The 1970’s may well be an exception, it should be noted.

We will see in coming weeks. Or maybe not, since it still will be necessary to sort out influences such as quickening of the pace of economic growth in China with recent moves by the Chinese central bank to reduce interest rates and keep the bubble going.

If I were betting on this, however, I would opt for a continuation of oil prices below $100 a barrel, and probably below $90 a barrel for some time to come. Possibly even staying around $70 a barrel.

Predicting the Midterm Elections

Predicting the outcome of elections is a fascinating game with more and more sophisticated predictive analytics.

The Republicans won bigtime, of course.

They won comfortable control of the US Senate and further consolidated their majority in the House of Representatives.

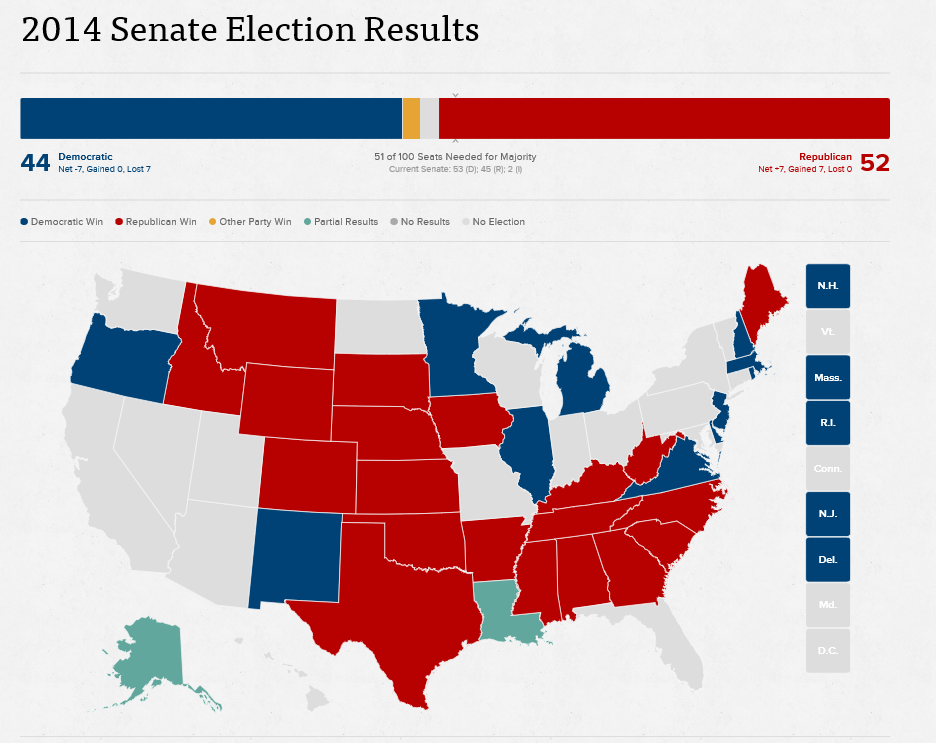
Counting before the Louisiana runoff election, which a Republican is expected to win, the balance is 52 to 44 in the Senate, highlighted in the following map from Politico.

senateresults

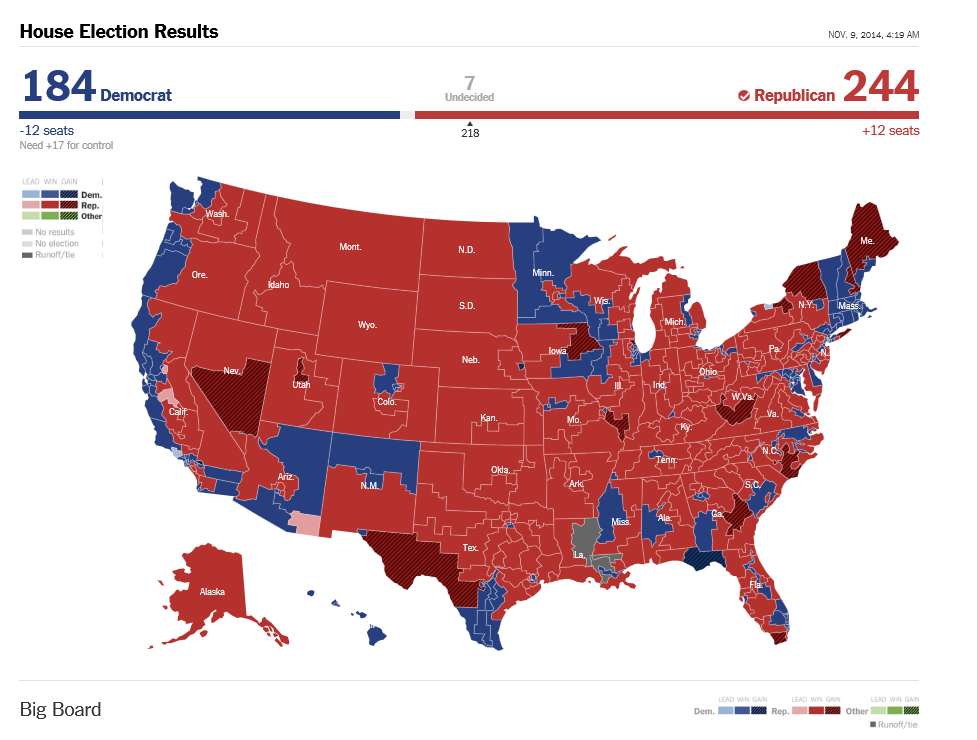
In the US House of Representatives, Republicans gained 12 seats for a 57 percent majority, 244 to 184, as illustrated in a New York Times graphic.

houseresults

Did Anyone See This Coming?

Nate Silver, who was prescient in the 2012 General Election, issued an update on his website FiveThirtyEight on November 4 stating that Republicans Have A 3 In 4 Chance Of Winning The Senate.

And so they did win.

Salon’s review of Silver’s predictions notes that,

Overall, the candidate with better-than-even odds in FiveThirtyEight’s model won or is likely to in 34 of the 36 Senate contests this year, for a success rate of 94 percent.

The track record for the governorships was less shining, with upsets in Maryland and Kansas and several wins by candidates with unfavorable odds in the FiveThirtyEight lineup.

Bias in Polls

Silver’s forecasting model weighs both polling data and fundamentals- like demographics.

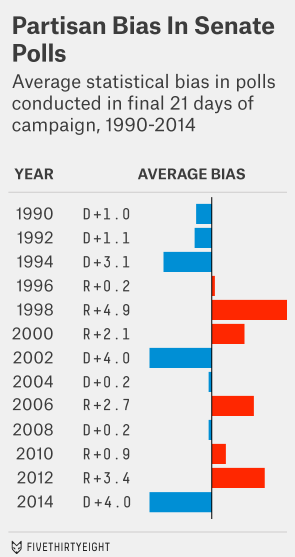
After the election, Silver blamed some of his mistakes on bias in polls, claiming that, this time, the Polls Were Skewed Toward Democrats.

Based on results as reported through early Wednesday morning …. the average Senate poll conducted in the final three weeks of this year’s campaign overestimated the Democrat’s performance by 4 percentage points. The average gubernatorial poll was nearly as bad, overestimating the Democrat’s performance by 3.4 points.

He backs this up with details of bias in polls by race, and, interestingly, throws up the following exhibit, suggesting that there is nothing systematic about bias in the polls.

biaspolls

Here is another discussion of mid-term election polling error – arguing it is significantly greater during midterms than in Presidential election years.

While not my area of expertise (although I have designed and analyzed survey data), I’m think the changing demographics of “cell-only” voters, no-call lists, and people’s readiness to hang up on unsolicited calls impacts the reliability of polling data, as usually gathered. What Silver seems to show with his graphic above, is that adjusting for these changes causes another form of unreliability.

Forecasting the Downswing in Markets – II

Because the Great Recession of 2008-2009 was closely tied with asset bubbles in the US and other housing markets, I have a category for asset bubbles in this blog.

In researching the housing and other asset bubbles, I have been surprised to discover that there are economists who deny their existence.

By one definition, an asset bubble is a movement of prices in a market away from fundamental values in a sustained manner. While there are precedents for suggesting that bubbles can form in the context of rational expectations (for example, Blanchard’s widely quoted 1982 paper), it seems more reasonable to consider that “noise” investors who are less than perfectly informed are part of the picture. Thus, there is an interesting study of the presence and importance of “out-of-town” investors in the recent run-up of US residential real estate prices which peaked in 2008.

The “deviations from fundamentals” approach in econometrics often translates to attempts to develop or show breaks in cointegrating relationships, between, for example, rental rates and housing prices. Let me just say right off that the problem with this is that the whole subject of cointegration of nonstationary time series is fraught with statistical pitfalls – such as weak tests to reject unit roots. To hang everything on whether or not Granger causation can or cannot be shown is to really be subject to the whims of random influences in the data, as well as violations of distributional assumptions on the relevant error terms.

I am sorry if all that sounds kind of wonkish, but it really needs to be said.

Institutionalist approaches seem more promising – such as a recent white paper arguing that the housing bubble and bust was the result of a ..

supply-side phenomenon, attributable to an excess of mispriced mortgage finance: mortgage-finance spreads declined and volume increased, even as risk increased—a confluence attributable only to an oversupply of mortgage finance.

But what about forecasting the trajectory of prices, both up and then down, in an asset bubble?

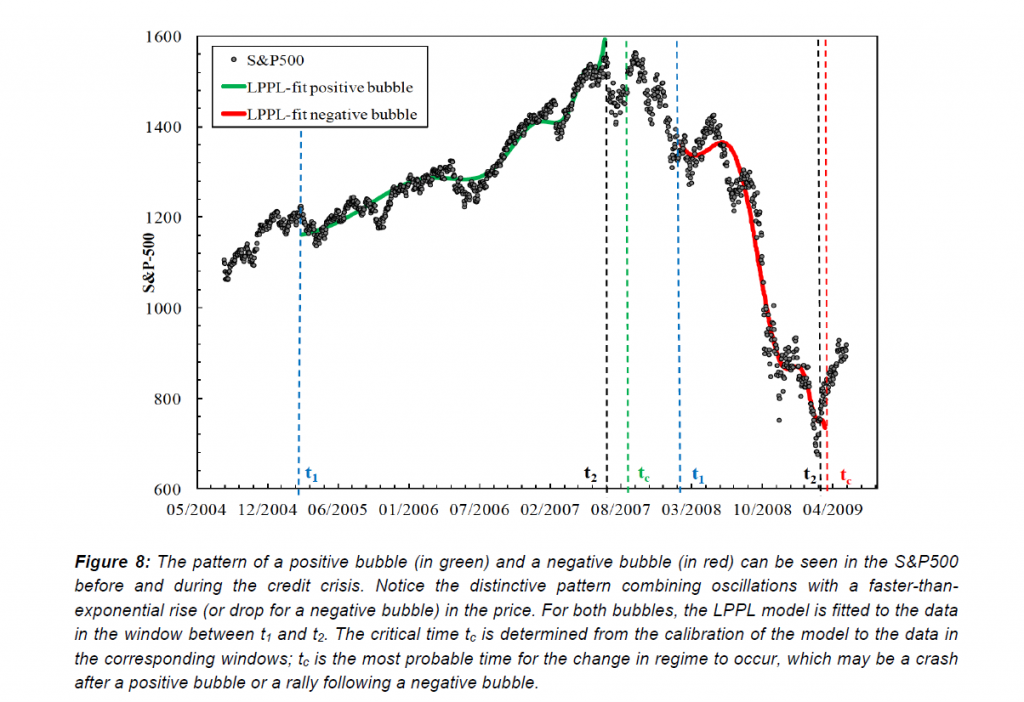
What can we make out of charts such as this, in a recent paper by Sornette and Cauwels?

negativebubble

Sornett and the many researchers collaborating with him over the years are working with a paradigm of an asset bubble as a faster than exponential increase in prices. In an as yet futile effort to extend the olive branch to traditional economists (Sornette is a geophysicist by training), Sornette evokes the “bubbles following from rational expectations meme.” The idea is that it could be rational for an investor to participate in a market that is in the throes of an asset bubble, providing that the investor believes that his gains in the near future adequately compensate for the increased risk of a collapse of prices. This is the “greater fool” theory to a large extent, and I always take delight in pointing out that one of the most intelligent of all human beings – Isaac Newton – was burned by exactly such a situation hundreds of years ago.

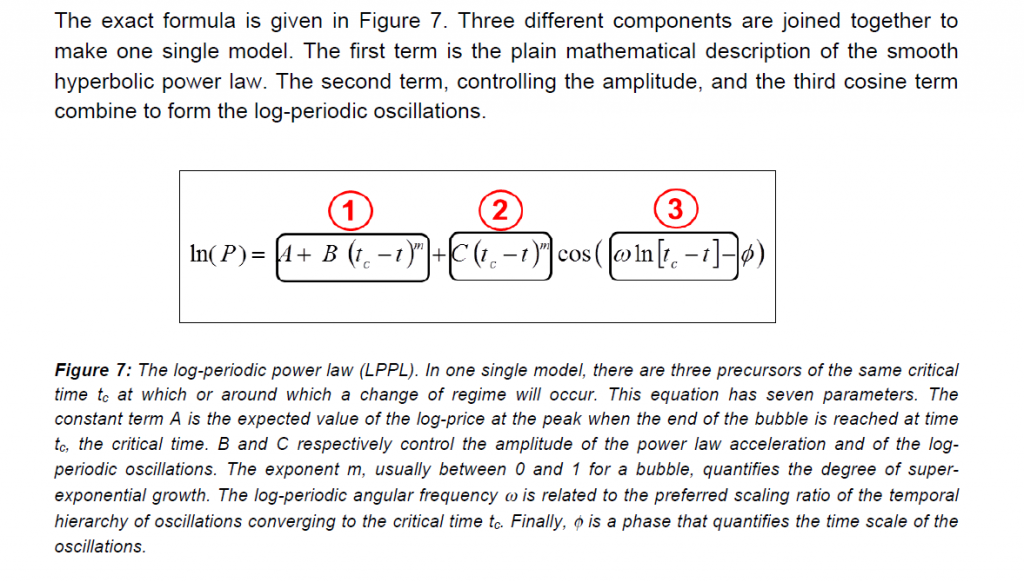
In any case, the mathematics of the Sornette et al approach are organized around the log-periodic power law, expressed in the following equation with the Sornette and Cauwels commentary (click to enlarge).

LPPL

From a big picture standpoint, the first thing to observe is that there is a parameter tc in the equation which is the “critical time.”

The whole point of this mathematical apparatus, which derives in part from differential equations and some basic modeling approaches common in physics, is that faster than exponential growth is destined to reach a point at which it basically goes ballistic. That is the critical point. The purpose of forecasting in this context then is to predict when this will be, when will the asset bubble reach its maximum price and then collapse?

And the Sornette framework allows for negative as well as positive price movements according to the dynamics in this equation. So, it is possible, if we can implement this, to predict how far the market will fall after the bubble pops, so to speak, and when it will turn around.

Pretty heady stuff.

The second big picture feature is to note the number of parameters to be estimated in fitting this model to real price data – minimally constants A, B, and C, an exponent m, the angular frequency ω and phase φ, plus the critical time.

For the mathematically inclined, there is a thread of criticism and response, more or less culminating in Clarifications to questions and criticisms on the Johansen–Ledoit–Sornette financial bubble model which used to be available as a PDF download from ETC Zurich.

In brief, the issue is whether the numerical analysis methods fitting the data to the LPPL model arrive at local, instead of global maxima. Obviously, different values for the parameters can lead to wholly different forecasts for the critical time tc.

To some extent, this issue can be dealt with by running a great number of estimations of the parameters, or by developing collateral metrics for adequacy of the estimates.

But the bottom line is – regardless of the extensive applications of this approach to all manner of asset bubbles internationally and in different markets – the estimation of the parameters seems more in the realm of art, than science, at the present time.

However, it may be that mathematical or computational breakthroughs are possible.

I feel these researchers are “very close.”

In any case, it would be great if there were a package in R or the like to gin up these estimates of the critical time, applying the log-periodic power law.

Then we could figure out “how low it can go.’

And, a final note to this post – it is ironic that as I write and post this, the stock markets have recovered from their recent swoon and are setting new records. So I guess I just want to be prepared, and am not willing to believe the runup can go on forever.

I’m also interested in methodologies that can keep forecasters usefully at work, during the downswing.

Forecasting the Downswing in Markets

I got a chance to work with the problem of forecasting during a business downturn at Microsoft 2007-2010.

Usually, a recession is not good for a forecasting team. There is a tendency to shoot the messenger bearing the bad news. Cost cutting often falls on marketing first, which often is where forecasting is housed.

But Microsoft in 2007 was a company which, based on past experience, looked on recessions with a certain aplomb. Company revenues continued to climb during the recession of 2001 and also during the previous recession in the early 1990’s, when company revenues were smaller.

But the plunge in markets in late 2008 was scary. Microsoft’s executive team wanted answers. Since there were few forthcoming from the usual market research vendors – vendors seemed sort of “paralyzed” in bringing out updates – management looked within the organization.

I was part of a team that got this assignment.

We developed a model to forecast global software sales across more than 80 national and regional markets. Forecasts, at one point, were utilized in deliberations of the finance directors, developing budgets for FY2010. Our Model, by several performance comparisons, did as well or better than what was available in the belated efforts of the market research vendors.

This was a formative experience for me, because a lot of what I did, as the primary statistical or econometric modeler, was seat-of-the-pants. But I tried a lot of things.

That’s one reason why this blog explores method and technique – an area of forecasting that, currently, is exploding.

Importance of the Problem

Forecasting the downswing in markets can be vitally important for an organization, or an investor, but the first requirement is to keep your wits. All too often there are across-the-board cuts.

A targeted approach can be better. All market corrections, inflections, and business downturns come to an end. Growth resumes somewhere, and then picks up generally. Companies that cut to the bone are poorly prepared for the future and can pay heavily in terms of loss of market share. Also, re-assembling the talent pool currently serving the organization can be very expensive.

But how do you set reasonable targets, in essence – make intelligent decisions about cutbacks?

I think there are many more answers than are easily available in the management literature at present.

But one thing you need to do is get a handle on the overall swing of markets. How long will the downturn continue, for example?

For someone concerned with stocks, how long and how far will the correction go? Obviously, perspective on this can inform shorting the market, which, my research suggests, is an important source of profits for successful investors.

A New Approach – Deploying high frequency data

Based on recent explorations, I’m optimistic it will be possible to get several weeks lead-time on releases of key US quarterly macroeconomic metrics in the next downturn.

My last post, for example, has this graph.
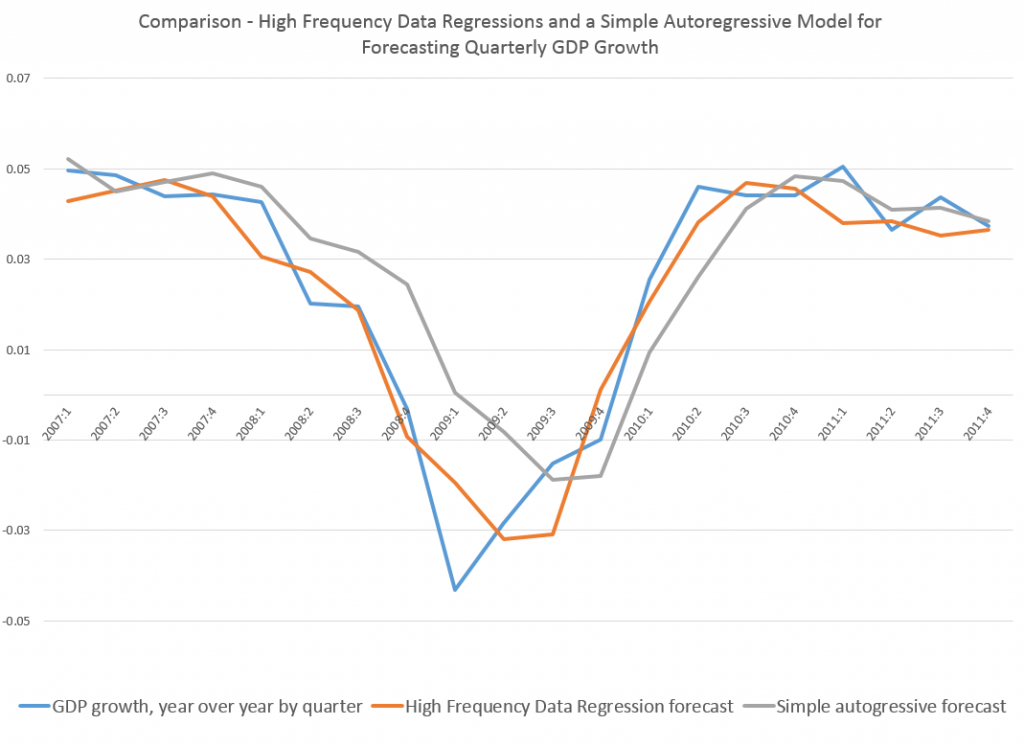
MIDAScomp

Note how the orange line hugs the blue line during the descent 2008-2009.

This orange line is the out-of-sample forecast of quarterly nominal GDP growth based on the quarter previous GDP and suitable lagged values of the monthly Chicago Fed National Activity Index. The blue line, of course, is actual GDP growth.

The official name for this is Nowcasting and MIDAS or Mixed Data Sampling techniques are widely-discussed approaches to this problem.

But because I was only mapping monthly and not, say, daily values onto quarterly values, I was able to simply specify the last period quarterly value and fifteen lagged values of the CFNAI in a straight-forward regression.

And in reviewing literature on MIDAS and mixing data frequencies, it is clear to me that, often, it is not necessary to calibrate polynomial lag expressions to encapsulate all the higher frequency data, as in the classic MIDAS approach.

Instead, one can deploy all the “many predictors” techniques developed over the past decade or so, starting with the work of Stock and Watson and factor analysis. These methods also can bring “ragged edge” data into play, or data with different release dates, if not different fundamental frequencies.

So, for example, you could specify daily data against quarterly data, involving perhaps several financial variables with deep lags – maybe totaling more explanatory variables than observations on the quarterly or lower frequency target variable – and wrap the whole estimation up in a bundle with ridge regression or the LASSO. You are really only interested in the result, the prediction of the next value for the quarterly metric, rather than unbiased estimates of the coefficients of explanatory variables.

Or you could run a principal component analysis of the data on explanatory variables, including a rag-tag collection of daily, weekly, and monthly metrics, as well as one or more lagged values of the higher frequency variable (quarterly GDP growth in the graph above).

Dynamic principal components also are a possibility, if anyone can figure out the estimation algorithms to move into a predictive mode.

Being able to put together predictor variables of all different frequencies and reporting periods is really exciting. Maybe in some way this is really what Big Data means in predictive analytics. But, of course, progress in this area is wholly empirical, it not being clear what higher frequency series can successfully map onto the big news indices, until the analysis is performed. And I think it is important to stress the importance of out-of-sample testing of the models, perhaps using cross-validation to estimate parameters if there is simply not enough data.

One thing I believe is for sure, however, and that is we will not be in the dark for so long during the next major downturn. It will be possible to  deploy all sorts of higher frequency data to chart the trajectory of the downturn, probably allowing a call on the turning point sooner than if we waited for the “big number” to come out officially.

Top picture courtesy of the Bridgespan Group