Category Archives: predictive analytics

Evidence of Stock Market Predictability

In business forecast applications, I often have been asked, “why don’t you forecast the stock market?” It’s almost a variant of “if you’re so smart, why aren’t you rich?” I usually respond something about stock prices being largely random walks.

But, stock market predictability is really the nut kernel of forecasting, isn’t it?

Earlier this year, I looked at the S&P 500 index and the SPY ETF numbers, and found I could beat a buy and hold strategy with a regression forecasting model. This was an autoregressive model with lots of lagged values of daily S&P returns. In some variants, it included lagged values of the Chicago Board of Trade VIX volatility index returns. My portfolio gains were compiled over an out-of-sample (OS) period. This means, of course, that I estimated the predictive regression on historical data that preceded and did not include the OS or test data.

Well, today I’m here to report to you that it looks like it is officially possible to achieve some predictability of stock market returns in out-of-sample data.

One authoritative source is Forecasting Stock Returns, an outstanding review by Rapach and Zhou  in the recent, second volume of the Handbook of Economic Forecasting.

The story is fascinating.

For one thing, most of the successful models achieve their best performance – in terms of beating market averages or other common benchmarks – during recessions.

And it appears that technical market indicators, such as the oscillators, momentum, and volume metrics so common in stock trading sites, have predictive value. So do a range of macroeconomic indicators.

But these two classes of predictors – technical market and macroeconomic indicators – are roughly complementary in their performance through the business cycle. As Christopher Neeley et al detail in Forecasting the Equity Risk Premium: The Role of Technical Indicators,

Macroeconomic variables typically fail to detect the decline in the actual equity risk premium early in recessions, but generally do detect the increase in the actual equity risk premium late in recessions. Technical indicators exhibit the opposite pattern: they pick up the decline in the actual premium early in recessions, but fail to match the unusually high premium late in recessions.

Stock Market Predictors – Macroeconomic and Technical Indicators

Rapach and Zhou highlight fourteen macroeconomic predictors popular in the finance literature.

1. Log dividend-price ratio (DP): log of a 12-month moving sum of dividends paid on the S&P 500 index minus the log of stock prices (S&P 500 index).

2. Log dividend yield (DY): log of a 12-month moving sum of dividends minus the log of lagged stock prices.

3. Log earnings-price ratio (EP): log of a 12-month moving sum of earnings on the S&P 500 index minus the log of stock prices.

4. Log dividend-payout ratio (DE): log of a 12-month moving sum of dividends minus the log of a 12-month moving sum of earnings.

5. Stock variance (SVAR): monthly sum of squared daily returns on the S&P 500 index.

6. Book-to-market ratio (BM): book-to-market value ratio for the DJIA.

7. Net equity expansion (NTIS): ratio of a 12-month moving sum of net equity issues by NYSE-listed stocks to the total end-of-year market capitalization of NYSE stocks.

8. Treasury bill rate (TBL): interest rate on a three-month Treasury bill (secondary market).

9. Long-term yield (LTY): long-term government bond yield.

10. Long-term return (LTR): return on long-term government bonds.

11. Term spread (TMS): long-term yield minus the Treasury bill rate.

12. Default yield spread (DFY): difference between BAA- and AAA-rated corporate bond yields.

13. Default return spread (DFR): long-term corporate bond return minus the long-term government bond return.

14. Inflation (INFL): calculated from the CPI (all urban consumers

In addition, there are technical indicators, which are generally moving average, momentum, or volume-based.

The moving average indicators typically provide a buy or sell signal based on a comparing two moving averages – a short and a long period MA.

Momentum based rules are based on the time trajectory of prices. A current stock price higher than its level some number of periods ago indicates “positive” momentum and expected excess returns, and generates a buy signal.

Momentum rules can be combined with information about the volume of stock purchases, such as Granville’s on-balance volume.

Each of these predictors can be mapped onto equity premium excess returns – measured by the rate of return on the S&P 500 index net of return on a risk-free asset. This mapping is a simple bi-variate regression with equity returns from time t on the left side of the equation and the economic predictor lagged by one time period on the right side of the equation. Monthly data are used from 1927 to 2008. The out-of-sample (OS) period is extensive, dating from the 1950’s, and includes most of the post-war recessions.

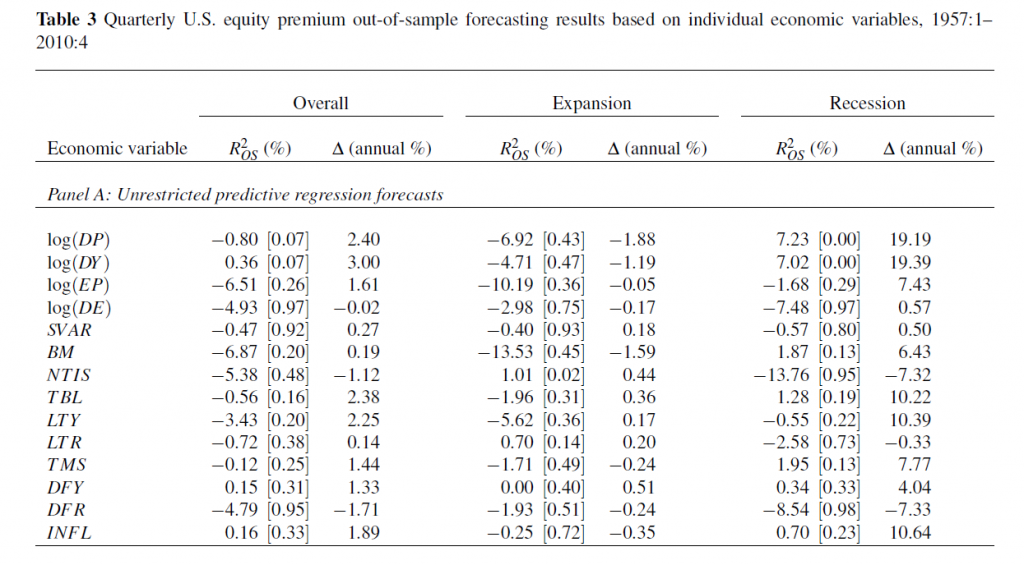
The following table shows what the authors call out-of-sample (OS) R2 for the 14 so-called macroeconomic variables, based on a table in the Handbook of Forecasting chapter. The OS R2 is equal to 1 minus a ratio. This ratio has the mean square forecast error (MSFE) of the predictor forecast in the numerator and the MSFE of the forecast based on historic average equity returns in the denominator. So if the economic indicator functions to improve the OS forecast of equity returns, the OS R2 is positive. If, on the other hand, the historic average trumps the economic indicator forecast, the OS R2 is negative.

Rapach1

(click to enlarge).

Overall, most of the macro predictors in this list don’t make it.  Thus, 12 of the 14 OS R2 statistics are negative in the second column of the Table, indicating that the predictive regression forecast has a higher MSFE than the historical average.

For two of the predictors with a positive out-of-sample R2, the p-values reported in the brackets are greater than 0.10, so that these predictors do not display statistically significant out-of-sample performance at conventional levels.

Thus, the first two columns in this table, under “Overall”, support a skeptical view of the predictability of equity returns.

However, during recessions, the situation is different.

For several the predictors, the R2 OS statistics move from being negative (and typically below -1%) during expansions to 1% or above during recessions. Furthermore, some of these R2 OS statistics are significant at conventional levels during recessions according to the  p-values, despite the decreased number of available observations.

Now imposing restrictions on the regression coefficients substantially improves this forecast performance, as the lower panel (not shown) in this table shows.

Rapach and Zhou were coauthors of the study with Neeley, published earlier as a working paper with the St. Louis Federal Reserve.

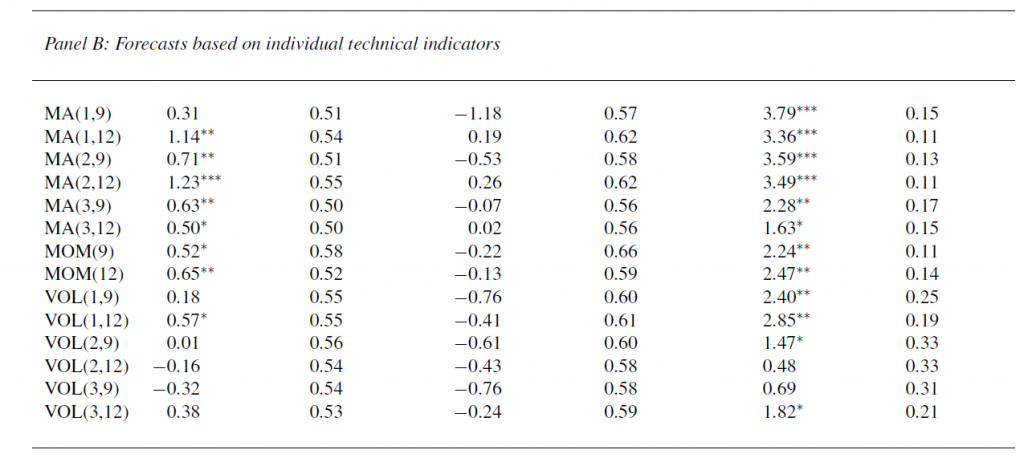
This working paper is where we get the interesting report about how technical factors add to the predictability of equity returns (again, click to enlarge).

RapachNeeley

This table has the same headings for the columns as Table 3 above.

It shows out-of-sample forecasting results for several technical indicators, using basically the same dataset, for the overall OS period, for expansions, and recessions in this period dating from the 1950’s to 2008.

In fact, these technical indicators generally seem to do better than the 14 macroeconomic indicators.

Low OS R2

Even when these models perform their best, their increase in mean square forecast error (MSFE) is only slightly more than the MSFE of the benchmark historic average return estimate.

This improved performance, however, can still achieve portfolio gains for investors, based on various trading rules, and, as both papers point out, investors can use the information in these forecasts to balance their portfolios, even when the underlying forecast equations are not statistically significant by conventional standards. Interesting argument, and I need to review it further to fully understand it.

In any case, my experience with an autoregressive model for the S&P 500 is that trading rules can be devised which produce portfolio gains over a buy and hold strategy, even when the Ris on the order of 1 or a few percent. All you have to do is correctly predict the sign of the return on the following trading day, for instance, and doing this a little more than 50 percent of the time produces profits.

Rapach and Zhou, in fact, develop insights into how predictability of stock returns can be consistent with rational expectations – providing the relevant improvements in predictability are bounded to be low enough.

Some Thoughts

There is lots more to say about this, naturally. And I hope to have further comments here soon.

But, for the time being, I have one question.

The is why econometricians of the caliber of Rapach, Zhou, and Neeley persist in relying on tests of statistical significance which are predicated, in a strict sense, on the normality of the residuals of these financial return regressions.

I’ve looked at this some, and it seems the t-statistic is somewhat robust to violations of normality of the underlying error distribution of the regression. However, residuals of a regression on equity rates of return can be very non-normal with fat tails and generally some skewness. I keep wondering whether anyone has really looked at how this translates into tests of statistical significance, or whether what we see on this topic is mostly arm-waving.

For my money, OS predictive performance is the key criterion.

Bootstrapping

I’ve been reading about the bootstrap. I’m interested in bagging or bootstrap aggregation.

The primary task of a statistician is to summarize a sample based study and generalize the finding to the parent population in a scientific manner..

The purpose of a sample study is to gather information cheaply in a timely fashion. The idea behind bootstrap is to use the data of a sample study at hand as a “surrogate population”, for the purpose of approximating the sampling distribution of a statistic; i.e. to resample (with replacement) from the sample data at hand and create a large number of “phantom samples” known as bootstrap samples. The sample summary is then computed on each of the bootstrap samples (usually a few thousand). A histogram of the set of these computed values is referred to as the bootstrap distribution of the statistic.

These well-phrased quotes come from Bootstrap: A Statistical Method by Singh and Xie.

OK, so let’s do a simple example.

Suppose we generate ten random numbers, drawn independently from a Gaussian or normal distribution with a mean of 10 and standard deviation of 1.

vector

This sample has an average of 9.7684. We would like to somehow project a 95 percent confidence interval around this sample mean, to understand how close it is to the population average.

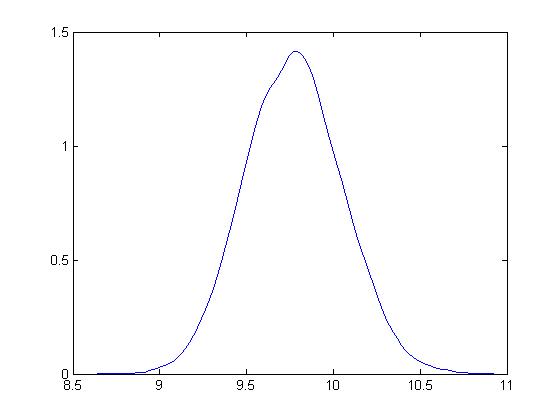
So we bootstrap this sample, drawing 10,000 samples of ten numbers with replacement.

Here is the distribution of bootstrapped means of these samples.

bootstrapdist

The mean is 9.7713.

Based on the method of percentiles, the 95 percent confidence interval for the sample mean is between 9.32 and 10.23, which, as you note, correctly includes the true mean for the population of 10.

Bias-correction is another primary use of the bootstrap. For techies, there is a great paper from the old Bell Labs called A Real Example That Illustrates Properties of Bootstrap Bias Correction. Unfortunately, you have to pay a fee to the American Statistical Association to read it – I have not found a free copy on the Web.

In any case, all this is interesting and a little amazing, but what we really want to do is look at the bootstrap in developing forecasting models.

Bootstrapping Regressions

There are several methods for using bootstrapping in connection with regressions.

One is illustrated in a blog post from earlier this year. I treated the explanatory variables as variables which have a degree of randomness in them, and resampled the values of the dependent variable and explanatory variables 200 times, finding that doing so “brought up” the coefficient estimates, moving them closer to the underlying actuals used in constructing or simulating them.

This method works nicely with hetereoskedastic errors, as long as there is no autocorrelation.

Another method takes the explanatory variables as fixed, and resamples only the residuals of the regression.

Bootstrapping Time Series Models

The underlying assumptions for the standard bootstrap include independent and random draws.

This can be violated in time series when there are time dependencies.

Of course, it is necessary to transform a nonstationary time series to a stationary series to even consider bootstrapping.

But even with a time series that fluctuates around a constant mean, there can be autocorrelation.

So here is where the block bootstrap can come into play. Let me cite this study – conducted under the auspices of the Cowles Foundation (click on link) – which discusses the asymptotic properties of the block bootstrap and provides key references.

There are many variants, but the basic idea is to sample blocks of a time series, probably overlapping blocks. So if a time series yt  has n elements, y1,..,yn and the block length is m, there are n-m blocks, and it is necessary to use n/m of these blocks to construct another time series of length n. Issues arise when m is not a perfect divisor of n, and it is necessary to develop special rules for handling the final values of the simulated series in that case.

Block bootstrapping is used by Bergmeir, Hyndman, and Benıtez in bagging exponential smoothing forecasts.

How Good Are Bootstrapped Estimates?

Consistency in statistics or econometrics involves whether or not an estimate or measure converges to an unbiased value as sample size increases – or basically goes to infinity.

This is a huge question with bootstrapped statistics, and there are new findings all the time.

Interestingly, sometimes bootstrapped estimates can actually converge faster to the appropriate unbiased values than can be achieved simply by increasing sample size.

And some metrics really do not lend themselves to bootstrapping.

Also some samples are inappropriate for bootstrapping.  Gelman, for example, writes about the problem of “separation” in a sample

[In} ..an example of a poll from the 1964 U.S. presidential election campaign, … none of the black respondents in the sample supported the Republican candidate, Barry Goldwater… If zero black respondents in the sample supported Barry Goldwater, then zero black respondents in any bootstrap sample will support Goldwater as well. Indeed, bootstrapping can exacerbate separation by turning near-separation into complete separation for some samples. For example, consider a survey in which only one or two of the black respondents support the Republican candidate. The resulting logistic regression estimate will be noisy but it will be finite.

Here is a video doing a good job of covering the bases on boostrapping. I suggest sampling portions of it first. It’s quite good, but it may seem too much going into it.

Automatic Forecasting Programs – the Hyndman Forecast Package for R

I finally started learning R.

It’s a vector and matrix-based statistical programming language, a lot like MathWorks Matlab and GAUSS. The great thing is that it is free. I have friends and colleagues who swear by it, so it was on my to-do list.

The more immediate motivation, however, was my interest in Rob Hyndman’s automatic time series forecast package for R, described rather elegantly in an article in the Journal of Statistical Software.

This is worth looking over, even if you don’t have immediate access to R.

Hyndman and Exponential Smoothing

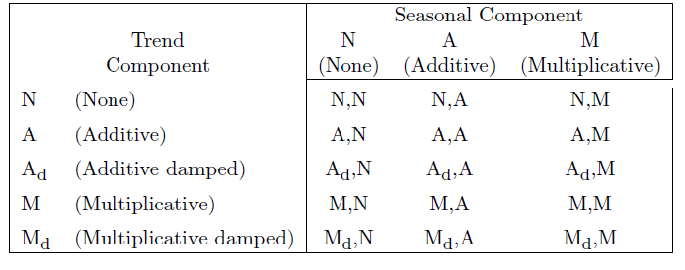
Hyndman, along with several others, put the final touches on a classification of exponential smoothing models, based on the state space approach. This facilitates establishing confidence intervals for exponential smoothing forecasts, for one thing, and provides further insight into the modeling options.

There are, for example, 15 widely acknowledged exponential smoothing methods, based on whether trend and seasonal components, if present, are additive or multiplicative, and also whether any trend is damped.

15expmethods

When either additive or multiplicative error processes are added to these models in a state space framewoprk, the number of modeling possibilities rises from 15 to 30.

One thing the Hyndman R Package does is run all the relevant models from this superset on any time series provided by the user, picking a recommended model for use in forecasting with the Aikaike information criterion.
Hyndman and Khandakar comment,

Forecast accuracy measures such as mean squared error (MSE) can be used for selecting a model for a given set of data, provided the errors are computed from data in a hold-out set and not from the same data as were used for model estimation. However, there are often too few out-of-sample errors to draw reliable conclusions. Consequently, a penalized method based on the in-sample  t is usually better.One such approach uses a penalized likelihood such as Akaike’s Information Criterion… We select the model that minimizes the AIC amongst all of the models that are appropriate for the data.

Interestingly,

The AIC also provides a method for selecting between the additive and multiplicative error models. The point forecasts from the two models are identical so that standard forecast accuracy measures such as the MSE or mean absolute percentage error (MAPE) are unable to select between the error types. The AIC is able to select between the error types because it is based on likelihood rather than one-step forecasts.

So the automatic forecasting algorithm, involves the following steps:

1. For each series, apply all models that are appropriate, optimizing the parameters (both smoothing parameters and the initial state variable) of the model in each case.

2. Select the best of the models according to the AIC.

3. Produce point forecasts using the best model (with optimized parameters) for as many steps ahead as required.

4. Obtain prediction intervals for the best model either using the analytical results of Hyndman et al. (2005b), or by simulating future sample paths..

This package also includes an automatic forecast module for ARIMA time series modeling.

One thing I like about Hyndman’s approach is his disclosure of methods. This, of course, is in contrast with leading competitors in the automatic forecasting market space –notably Forecast Pro and Autobox.

Certainly, go to Rob J Hyndman’s blog and website to look over the talk (with slides) Automatic time series forecasting. Hyndman’s blog, mentioned previously in the post on bagging time series, is a must-read for statisticians and data analysts.

Quick Implementation of the Hyndman R Package and a Test

But what about using this package?

Well, first you have to install R on your computer. This is pretty straight-forward, with the latest versions of the program available at the CRAN site. I downloaded it to a machine using Windows 8 as the OS. I downloaded both the 32 and 64-bit versions, just to cover my bases.

Then, it turns out that, when you launch R, a simple menu comes up with seven options, and a set of icons underneath. Below that there is the work area.

Go to the “Packages” menu option. Scroll down until you come on “forecast” and load that.

That’s the Hyndman Forecast Package for R.

So now you are ready to go, but, of course, you need to learn a little bit of R.

You can learn a lot by implementing code from the documentation for the Hyndman R package. The version corresponding to the R file that can currently be downloaded is at

http://cran.r-project.org/web/packages/forecast/forecast.pdf

Here are some general tutorials:

http://cran.r-project.org/doc/contrib/Verzani-SimpleR.pdf

http://cyclismo.org/tutorial/R/

http://cran.r-project.org/doc/manuals/R-intro.html#Simple-manipulations-numbers-and-vectors

http://www.statmethods.net/

And here is a discussion of how to import data into R and then convert it to a time series – which you will need to do for the Hyndman package.

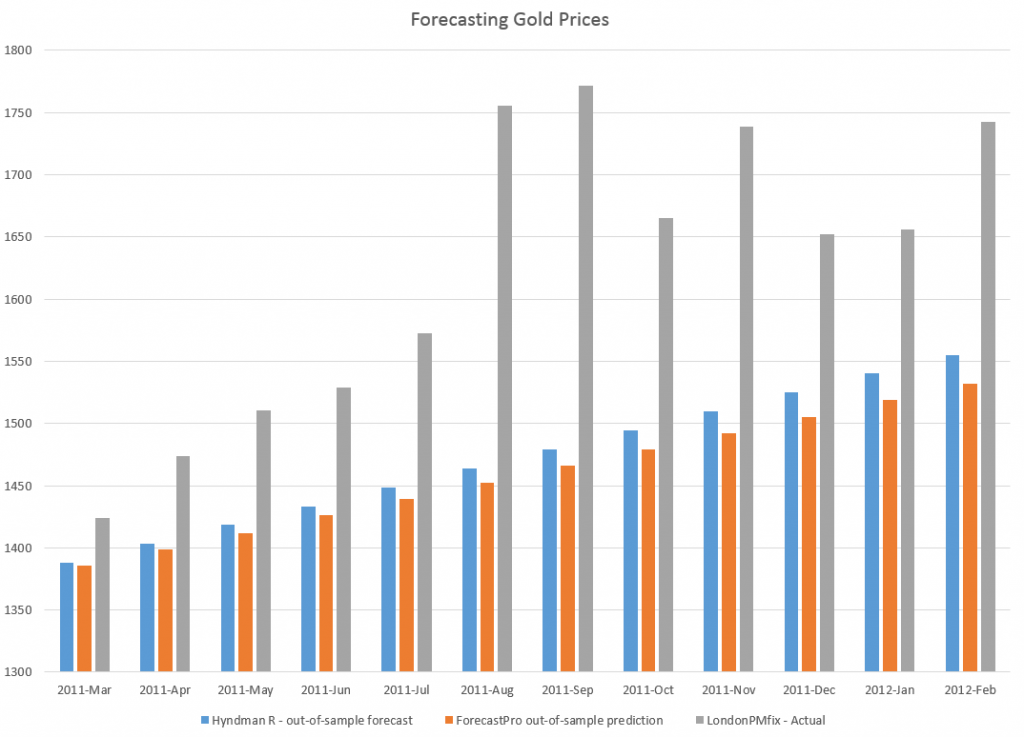
I used the exponential smoothing module to forecast monthly averages from London gold PM fix price series, comparing the results with a ForecastPro run. I utilized data from 2007 to February 2011 as a training sample, and produced forecasts for the next twelve months with both programs.

The Hyndman R package and exponential smoothing module outperformed Forecast Pro in this instance, as the following chart shows.

RFPcomp

Another positive about the R package is it is possible to write code to produce a whole number of such out-of-sample forecasts to get an idea of how the module works with a time series under different regimes, e.g. recession, business recovery.

I’m still caging together the knowledge to put programs like that together and appropriately save results.

But, my introduction to this automatic forecasting package and to R has been positive thus far.

Real Estate Forecasts – 1

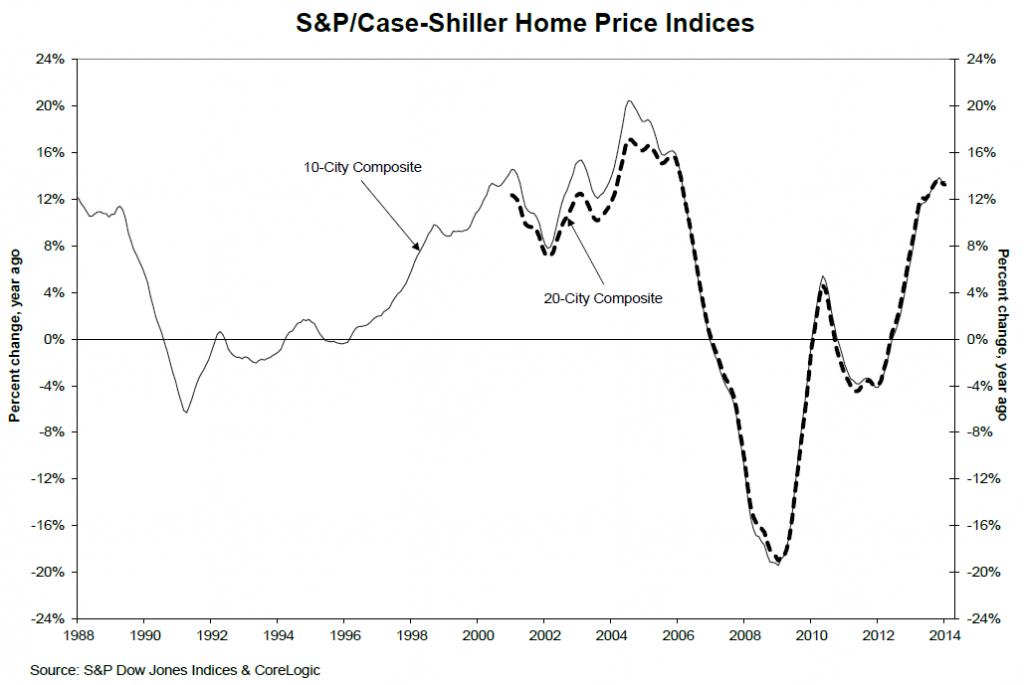
Nationally, housing prices peaked in 2014, as the following Case-Shiller chart shows.

CS2014

The Case Shiller home price indices have been the gold standard and the focus of many forecasting efforts. A key feature is reliance on the “repeat sales method.” This uses data on properties that have sold at least twice to capture the appreciated value of each specific sales unit, holding quality constant.

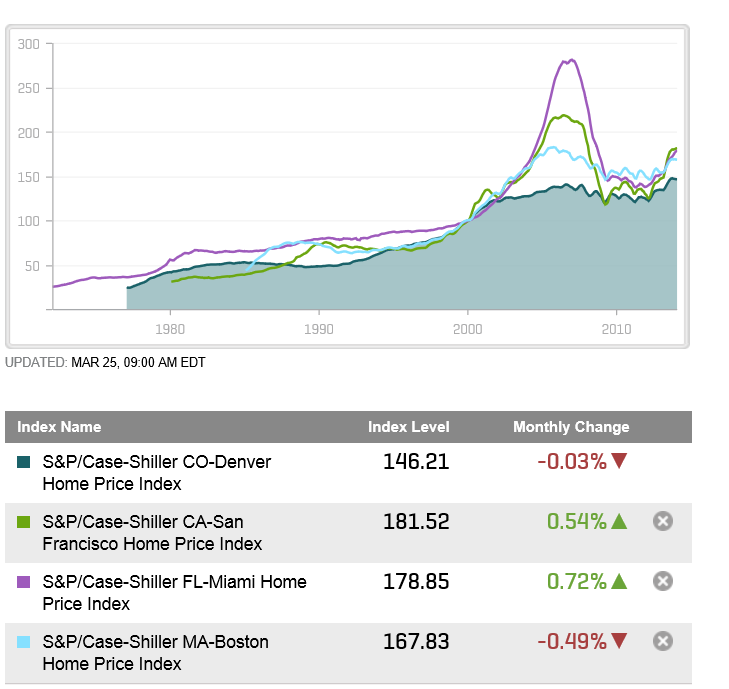
The following chart shows Case-Shiller (C-S) house indexes for four MSA’s (metropolitan statistical areas) – Denver, San Francisco, Miami, and Boston.

CScities

The price “bubble” was more dramatic in some cities than others.

Forecasting Housing Prices and Housing Starts

The challenge to predictive modeling is more or less the same – how to account for a curve which initially rises, and then falls (in some cases dramatically), “stabilizes” and begins to climb again, although with increased volatility, again as long term interest rates rise. 

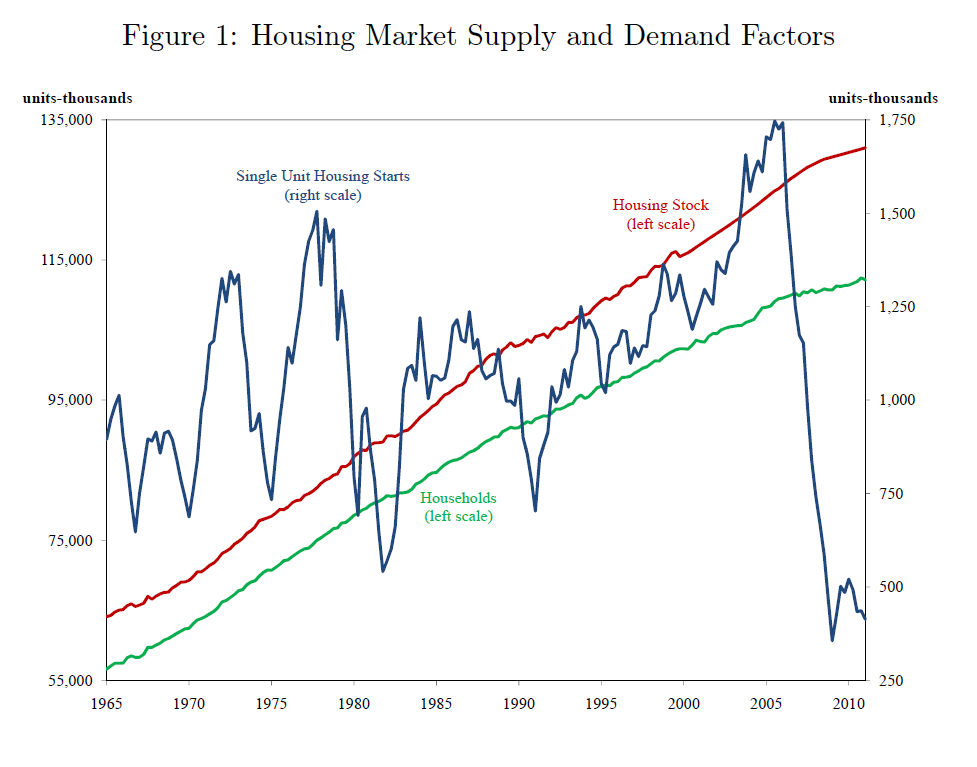
Volatility is a feature of housing starts, also, when compared with growth in households and the housing stock, as highlighted in the following graphic taken from an econometric analysis by San Francisco Federal Reserve analysts.

SandDfactorshousingThe fluctuations in housing starts track with drivers such as employment, energy prices, prices of construction materials, and real mortgage rates, but the short term forecasting models, including variables such as current listings and even Internet search activity, are promising.

Companies operating in this space include CoreLogic, Zillow and Moody’s Analytics. The sweet spot in all these services is to disaggregate housing price forecasts more local levels – the county level, for example.

Finally, in this survey of resources, one of the best housing and real estate blogs is Calculated Risk.

I’d like to post more on these predictive efforts, their statistical rationale, and their performance.

Also, the Federal Reserve “taper” of Quantitative Easing (QE) currently underway is impacting long term interest rates and mortgage rates.

The key question is whether the US housing market can withstand return to “normal” interest rate conditions in the next one to two years, and how that will play out.

Links – April 18

Ukraine

US financial showdown with Russia is more dangerous than it looks, for both sides Ambrose Evans-Pritchard at his most incisive.

How the Ukraine crisis ends Henry Kissinger, not always one of my favorites, writes an almost wise comment on the Ukraine from early March. Still relevant.

The West must understand that, to Russia, Ukraine can never be just a foreign country. Russian history began in what was called Kievan-Rus. The Russian religion spread from there. Ukraine has been part of Russia for centuries, and their histories were intertwined before then. Some of the most important battles for Russian freedom, starting with the Battle of Poltava in 1709 , were fought on Ukrainian soil. The Black Sea Fleet — Russia’s means of projecting power in the Mediterranean — is based by long-term lease in Sevastopol, in Crimea. Even such famed dissidents as Aleksandr Solzhenitsyn and Joseph Brodsky insisted that Ukraine was an integral part of Russian history and, indeed, of Russia.

China

The Future of Democracy in Hong Kong There is an enlightening video (about 1 hour long) interview with Veteran Hong Kong political leaders Anson Chan and Martin Lee. Beijing and local Hong Kong democratic rule appear to be on a collision course.

Inside Look At Electric Taxis Hitting China In Mass This Summer China needs these. The pollution in Beijing and other big cities from cars is stifling and getting worse.

taxi

Economy

Detecting bubbles in real time Interesting suggestion for metric to guage bubble status of an asset market.

Fed’s Yellen More Concerned About Inflation Running Below 2% Target Just a teaser, but check this Huffington Post flash video of Yellen, still at the time with the San Francisco Fed, as she lays out the dangers of deflation in early 2013. Note also the New Yorker blog on Yellen’s recent policy speech, and her silence on speculative bubbles.

Yellen

Data Analytics

Manipulate Me: The Booming Business in Behavioral Finance

Hidden Markov Models: The Backwards Algorithm

Suppose you are at a table at a casino and notice that things don’t look quite right. Either the casino is extremely lucky, or things should have averaged out more than they have. You view this as a pattern recognition problem and would like to understand the number of ‘loaded’ dice that the casino is using and how these dice are loaded. To accomplish this you set up a number of Hidden Markov Models, where the number of loaded die are the latent variables, and would like to determine which of these, if any, is more likely to be using rigged dice.

Interest Rates – 3

Can interest rates be nonstationary?

This seems like a strange question, since interest rates are bounded, except in circumstances, perhaps, of total economic collapse.

“Standard” nonstationary processes, by contrast, can increase or decrease without limit, as can conventional random walks.

But, be careful. It’s mathematically possible to define and study random walks with reflecting barriers –which, when they reach a maximum or minimum, “bounce” back from the barrier.

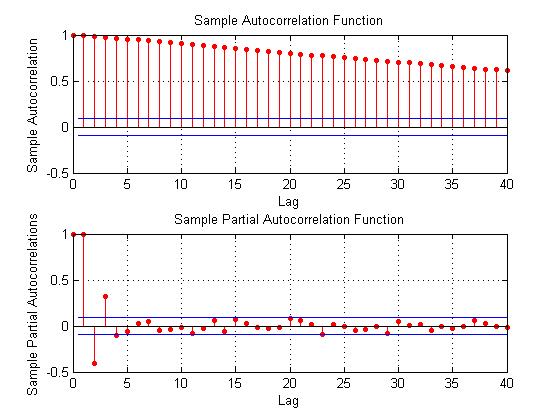
This is more than esoteric, since the 30 year fixed mortgage rate monthly averages series discussed in the previous post has a curious property. It can be differenced many times, and yet display first order autocorrelation of the resulting series.

This contrasts with the 10 year fixed maturity Treasury bond rates (also monthly averages). After first differencing this Treasury bond series, the resulting residuals do not show statistically significant first order autocorrelation.

Here a stationary stochastic process is one in which the probability distribution of the outcomes does not shift with time, so the conditional mean and conditional variance are, in the strict case, constant. A classic example is white noise, where each element can be viewed as an independent draw from a Gaussian distribution with zero mean and constant variance.

30 Year Fixed Mortgage Monthly Averages – a Nonstationary Time Series?

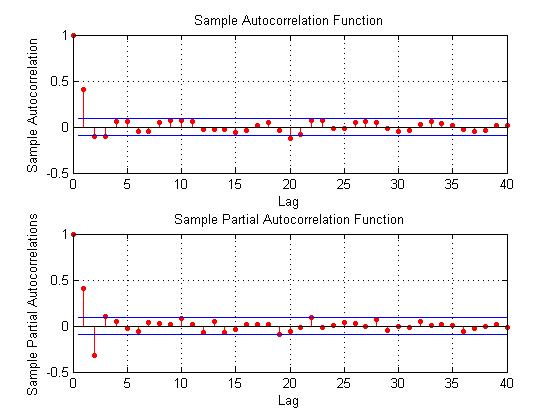
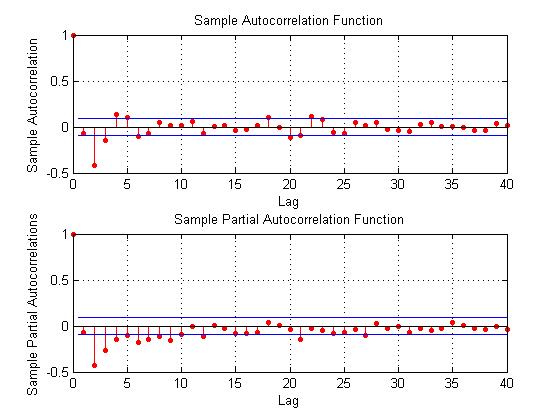
Here are some autocorrelation functions (ACF’s) and partial autocorrelation functions (PACF’s) of the 30 year fixed mortgage monthly averages from April 1971 to January 2014, first differences of this series, and second differences of this series – altogether six charts produced by MATLAB’s plot routines.

Data for this and the following series are downloaded from the St. Louis Fed FRED site.

MLmort0

Here the PACF appears to cut off after 4 periods, but maybe not quite, since there are values for lags which touch the statistical significance boundary further out.

MLmort1

This seems more satisfactory, since there is only one major spike in the ACF and 2-3 initial spikes in the PACF. Again, however, values for lags far out on the horizontal axis appear to touch the boundary of statistical significance.

MLmort2

Here are the ACF and PACF’s of the “difference of the first difference” or the second difference, if you like. This spike at period 2 for the ACF and PACF is intriguing, and, for me, difficult to interpret.

The data series includes 514 values, so we are not dealing with a small sample in conventional terms.

I also checked for seasonal variation – either additive or multiplicative seasonal components or factors. After taking steps to remove this type of variation, if it exists, the same pattern of repeated significance of autocorrelations of differences and higher order differences persists.

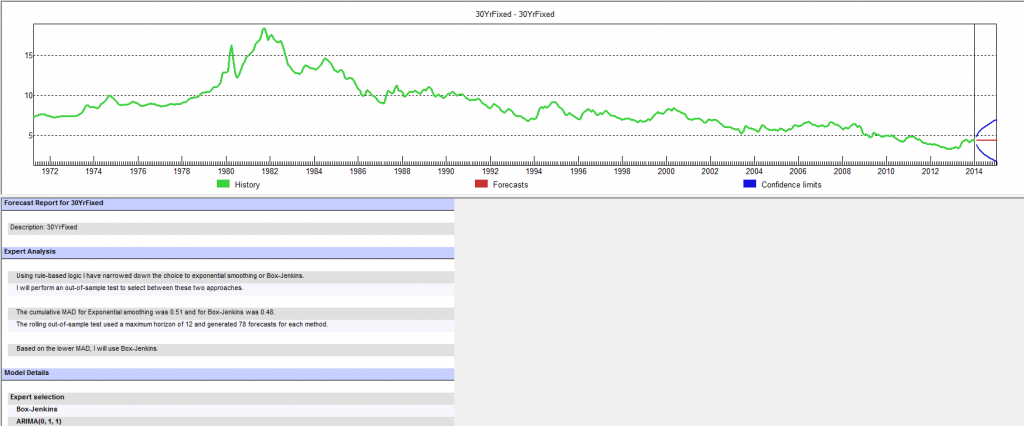
Forecast Pro, a good business workhorse for automatic forecasting, selects ARIMA(0,1,1) as the optimal forecast model for this 30 year fixed interest mortgage monthly averages. In other words, Forecast Pro glosses over the fact that the residuals from an ARIMA(0,1,1) setup still contain significant autocorrelation.

Here is a sample of the output (click to enlarge)

FP30yr

10 Year Treasury Bonds Constant Maturity

The situation is quite different for 10 year Treasury Bonds monthly averages, where the downloaded series starts April 1953 and, again, ends January 2014.

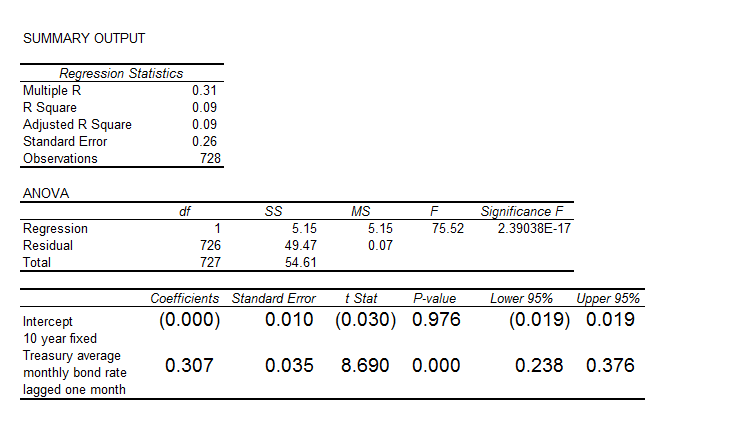
Here is the ordinary least squares (OLS) regression of the first order autocorrelation.

10yrTreasregHere the R2 or coefficient of determination is much lower than for the 30 year fixed mortgage monthly averages, but the first order lagged rate is highly significant statistically.

On the other hand, the residuals of this regression do not exhibit a high degree of first order autocorrelation, falling below the 80 percent significance level.

What Does This Mean?

The closest I have come to formulating an explanation for this weird difference between these two “interest rates” is the discussion in a paper from 2002 –

On Mean Reversion in Real Interest Rates: An Application of Threshold Cointegration

The authors of this research paper from the Institute for Advanced Studies in Vienna acknowledge findings that some interests rates may be nonstationary, at least over some periods of time. Their solution is a nonlinear time series approach, but they highlight several of the more exotic statistical features of interest rates in passing – such as evidence of non-normal distributions, excess kurtosis, conditional heteroskedasticity, and long memory.

In any case, I wonder whether the 30 year fixed mortgage monthly averages might be suitable for some type of boosting model working on residuals and residuals of residuals.

I’m going to try that later on this Spring.

Forecasting the Price of Gold – 2

Searching “forecasting gold prices” on Google lands on a number of ARIMA (autoregressive integrated moving average) models of gold prices. Ideally, researchers focus on shorter term forecast horizons with this type of time series model.

I take a look at this approach here, moving onto multivariate approaches in subsequent posts.

Stylized Facts

These ARIMA models support stylized facts about gold prices such as: (1) gold prices constitute a nonstationary time series, (2) first differencing can reduce gold price time series to a stationary process, and, usually, (3) gold prices are random walks.

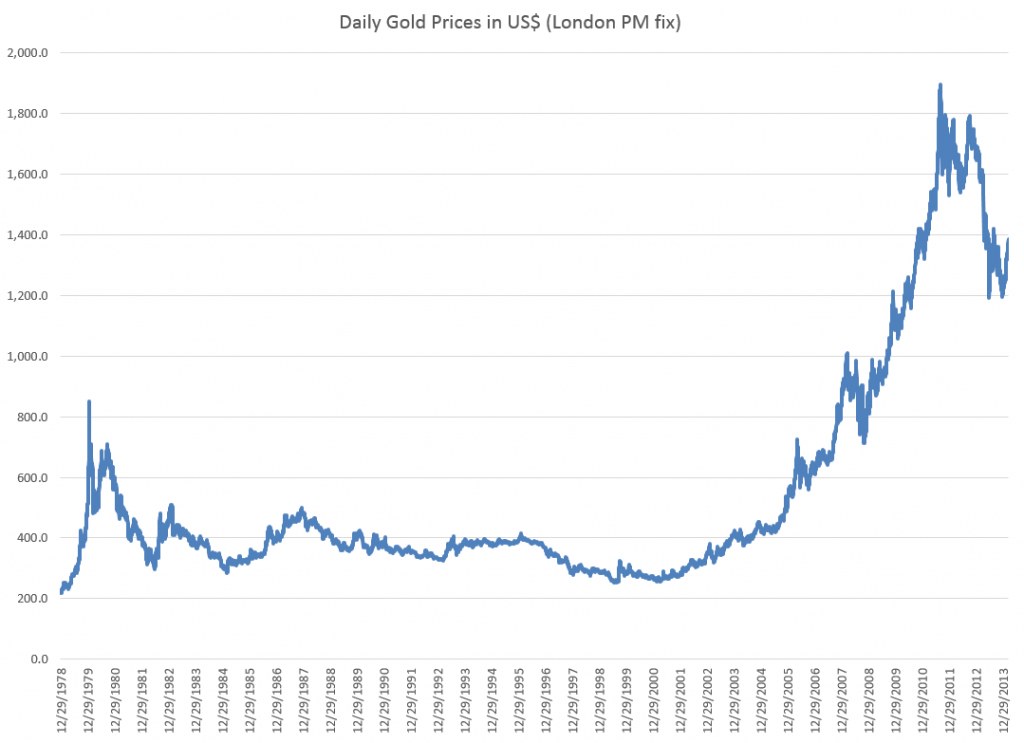
For example, consider daily gold prices from 1978 to the present.

DailyGold

This chart, based World Gold Council data and the London PM fix, shows gold prices do not fluctuate about a fixed level, but can move in patterns with a marked trend over several years.

The trick is to reduce such series to a mean stationary series through appropriate differencing and, perhaps, other data transformations, such as detrending and taking out seasonal variation. Guidance in this is provided by tools such as the autocorrelation function (ACF) and partial autocorrelation function (PACF) of the time series, as well as tests for unit roots.

Some Terminology

I want to talk about specific ARIMA models, such as ARIMA(0,1,1) or ARIMA(p,d,q), so it might be a good idea to review what this means.

Quickly, ARIMA models are described by three parameters: (1) the autoregressive parameter p, (2) the number of times d the time series needs to be differenced to reduce it to a mean stationary series, and (3) the moving average parameter q.

ARIMA(0,1,1) indicates a model where the original time series yt is differenced once (d=1), and which has one lagged moving average term.

If the original time series is yt, t=1,2,..n, the first differenced series is zt=yt-yt-1, and an ARIMA(0,1,1) model looks like,

zt = θ1εt-1

or converting back into the original series yt,

yt = μ + yt-1 + θ1εt-1

This is a random walk process with a drift term μ, incidentally.

As a note in the general case, the p and q parameters describe the span of the lags and moving average terms in the model.  This is often done with backshift operators Lk (click to enlarge)  

LagOperator

So you could have a sum of these backshift operators of different orders operating against yt or zt to generate a series of lags of order p. Similarly a sum of backshift operators of order q can operate against the error terms at various times. This supposedly provides a compact way of representing the general model with p lags and q moving average terms.

Similar terminology can indicate the nature of seasonality, when that is operative in a time series.

These parameters are determined by considering the autocorrelation function ACF and partial autocorrelation function PACF, as well as tests for unit roots.

I’ve seen this referred to as “reading the tea leaves.”

Gold Price ARIMA models

I’ve looked over several papers on ARIMA models for gold prices, and conducted my own analysis.

My research confirms that the ACF and PACF indicates gold prices (of course, always defined as from some data source and for some trading frequency) are, in fact, random walks.

So this means that we can take, for example, the recent research of Dr. M. Massarrat Ali Khan of College of Computer Science and Information System, Institute of Business Management, Korangi Creek, Karachi as representative in developing an ARIMA model to forecast gold prices.

Dr. Massarrat’s analysis uses daily London PM fix data from January 02, 2003 to March 1, 2012, concluding that an ARIMA(0,1,1) has the best forecasting performance. This research also applies unit root tests to verify that the daily gold price series is stationary, after first differencing. Significantly, an ARIMA(1,1,0) model produced roughly similar, but somewhat inferior forecasts.

I think some of the other attempts at ARIMA analysis of gold price time series illustrate various modeling problems.

For example there is the classic over-reach of research by Australian researchers in An overview of global gold market and gold price forecasting. These academics identify the nonstationarity of gold prices, but attempt a ten year forecast, based on a modeling approach that incorporates jumps as well as standard ARIMA structure.

A new model proposed a trend stationary process to solve the nonstationary problems in previous models. The advantage of this model is that it includes the jump and dip components into the model as parameters. The behaviour of historical commodities prices includes three differ- ent components: long-term reversion, diffusion and jump/dip diffusion. The proposed model was validated with historical gold prices. The model was then applied to forecast the gold price for the next 10 years. The results indicated that, assuming the current price jump initiated in 2007 behaves in the same manner as that experienced in 1978, the gold price would stay abnormally high up to the end of 2014. After that, the price would revert to the long-term trend until 2018.

As the introductory graph shows, this forecast issued in 2009 or 2010 was massively wrong, since gold prices slumped significantly after about 2012.

So much for long-term forecasts based on univariate time series.

Summing Up

I have not referenced many ARIMA forecasting papers relating to gold price I have seen, but focused on a couple – one which “gets it right” and another which makes a heroically wrong but interesting ten year forecast.

Gold prices appear to be random walks in many frequencies – daily, monthly average, and so forth.

Attempts at superimposing long term trends or even jump patterns seem destined to failure.

However, multivariate modeling approaches, when carefully implemented, may offer some hope of disentangling longer term trends and changes in volatility. I’m working on that post now.

Forecasting the Price of Gold – 1

I’m planning posts on forecasting the price of gold this week. This is an introductory post.

The Question of Price

What is the “price” of gold, or, rather, is there a single, integrated global gold market?

This is partly an anthropological question. Clearly in some locales, perhaps in rural India, people bring their gold jewelry to some local merchant or craftsman, and get widely varying prices. Presumably, though this merchant negotiates with a broker in a larger city of India, and trades at prices which converge to some global average. Very similar considerations apply to interest rates, which are significantly higher at pawnbrokers and so forth.

The World Gold Council uses the London PM fix, which at the time of this writing was $1,379 per troy ounce.

The Wikipedia article on gold fixing recounts the history of this twice daily price setting, dating back, with breaks for wars, to 1919.

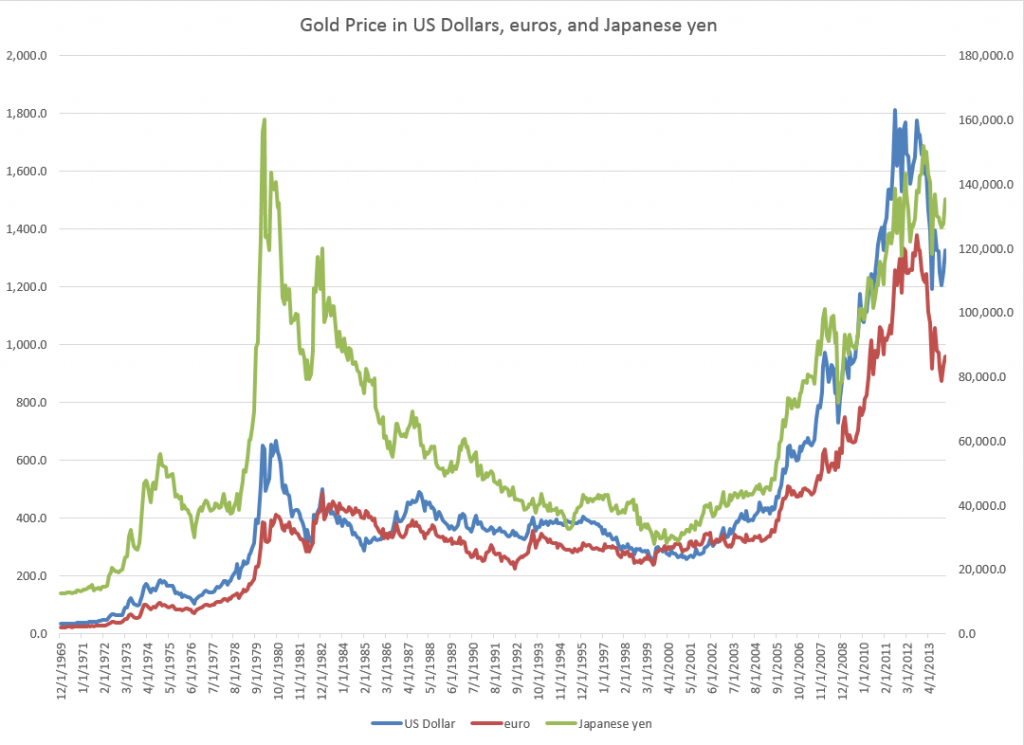
One thing is clear, however. The “price of gold” varies with the currency unit in which it is stated. The World Gold Council, for example, supplies extensive historical data upon registering with them. Here is a chart of the monthly gold prices based on the PM or afternoon fix, dating back to 1970.

Goldprices

Another insight from this chart is that the price of gold may be correlated with the price of oil, which also ramped up at the end of the 1970’s and again in 2007, recovering quickly from the Great Recession in 2008-09 to surge up again by 2010-11.

But that gets ahead of our story.

The Supply and Demand for Gold

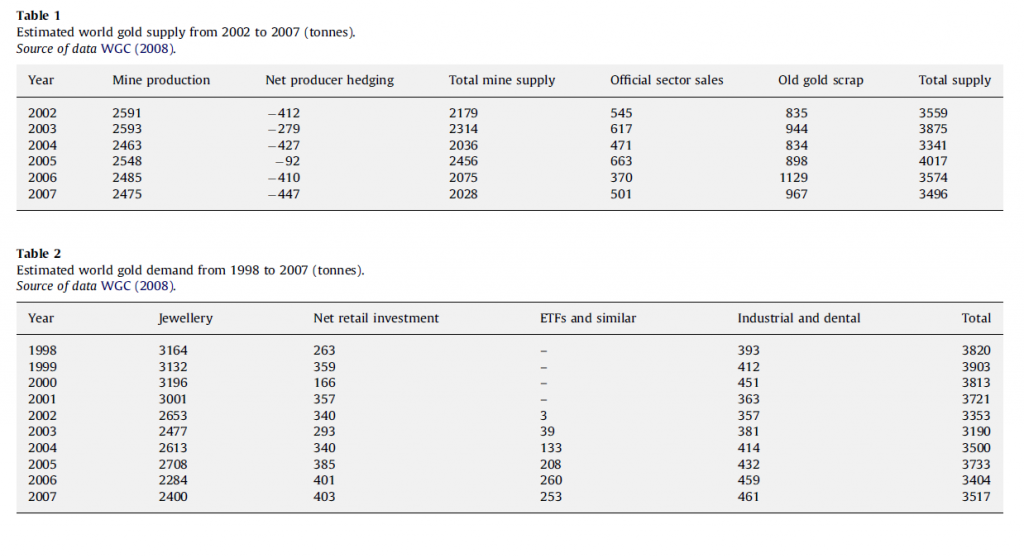
Here are two valuable tables on gold supply and demand fundamentals, based on World Gold Council sources, via an  An overview of global gold market and gold price forecasting. I’ve more to say about the forecasting model in that article, but the descriptive material is helpful (click to enlarge).

Tab1and2These tables give an idea of the main components of gold supply and demand over a several years recently.

Gold is an unusual commodity in that one of its primary demand components – jewelry – can contribute to the supply-side. Thus, gold is in some sense renewable and recyclable.

Table 1 above shows the annual supplies in this period in the last decade ran on the order of three to four thousand tonnes, where a tonne is 2,240 pounds and equal conveniently to 1000 kilograms.

Demand for jewelry is a good proportion of this annual supply, with demands by ETF’s or exchange traded funds rising rapidly in this period. The industrial and dental demand is an order of magnitude lower and steady.

One of the basic distinctions is between the monetary versus nonmonetary uses or demands for gold.

In total, central banks held about 30,000 tonnes of gold as reserves in 2008.

Another estimated 30,000 tonnes was held in inventory for industrial uses, with a whopping 100,000 tonnes being held as jewelry.

India and China constitute the largest single countries in terms of consumer holdings of gold, where it clearly functions as a store of value and hedge against uncertainty.

Gold Market Activity

In addition to actual purchases of gold, there are gold futures. The CME Group hosts a website with gold future listings. The site states,

Gold futures are hedging tools for commercial producers and users of gold. They also provide global gold price discovery and opportunities for portfolio diversification. In addition, they: Offer ongoing trading opportunities, since gold prices respond quickly to political and economic events, Serve as an alternative to investing in gold bullion, coins, and mining stocks

Some of these contracts are recorded at exchanges, but it seems the bulk of them are over-the-counter.

A study by the London Bullion Market Association estimates that 10.9bn ounces of gold, worth $15,200bn, changed hands in the first quarter of 2011 just in London’s markets. That’s 125 times the annual output of the world’s gold mines – and twice the quantity of gold that has ever been mined.

The Forecasting Problem

The forecasting problem for gold prices, accordingly, is complex. Extant series for gold prices do exist and underpin a lot of the market activity at central exchanges, but the total volume of contracts and gold exchanging hands is many times the actual physical quantity of the product. And there is a definite political dimension to gold pricing, because of the monetary uses of gold and the actions of central banks increasing and decreasing their reserves.

But the standard approaches to the forecasting problem are the same as can be witnessed in any number of other markets. These include the usual time series methods, focused around arima or autoregressive moving average models and multivariate regression models. More up-to-date tactics revolve around tests of cointegration of time series and VAR models. And, of course, one of the fundamental questions is whether gold prices in their many incarnations are best considered to be a random walk.

Flu Forecasting and Google – An Emerging Big Data Controversy

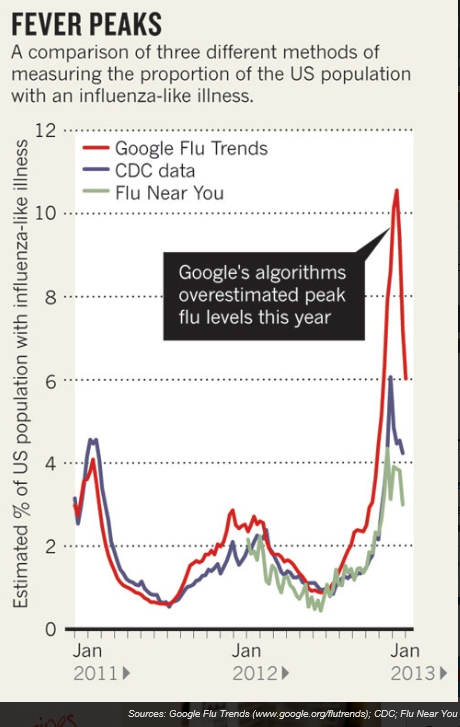
It started innocently enough, when an article in the scientific journal Nature caught my attention – When Google got flu wrong. This highlights big errors in Google flu trends in the 2012-2013 flu season.

flutrends

Then digging into the backstory, I’m intrigued to find real controversy bubbling below the surface. Phrases like “big data hubris” are being thrown around, and there are insinuations Google is fudging model outcomes, at least in backtests. Beyond that, there are substantial statistical criticisms of the Google flu trends model – relating to autocorrelation and seasonality of residuals.

I’m using this post to keep track of some of the key documents and developments.

Background on Google Flu Trends

Google flu trends, launched in 2008, targets public health officials, as well as the general public.

Cutting lead-time on flu forecasts can support timely stocking and distribution of vaccines, as well as encourage health practices during critical flue months.

What’s the modeling approach?

There seem to be two official Google-sponsored reports on the underlying prediction model.

Detecting influenza epidemics using search engine query data appears in Nature in early 2009, and describes a logistic regression model estimating the probability that a random physician visit in a particular region is related to an influenza-like illness (ILI). This approach is geared to historical logs of online web search queries submitted between 2003 and 2008, and publicly available data series from the CDC’s US Influenza Sentinel Provider Surveillance Network (http://www.cdc.gov/flu/weekly).

The second Google report – Google Disease Trends: An Update – came out recently, in response to our algorithm overestimating influenza-like illness (ILI) and the 2013 Nature article. It mentions in passing corrections discussed in a 2011 research study, but focuses on explaining the over-estimate in peak doctor visits during the 2012-2013 flu season.

The current model, while a well performing predictor in previous years, did not do very well in the 2012-2013 flu season and significantly deviated from the source of truth, predicting substantially higher incidence of ILI than the CDC actually found in their surveys. It became clear that our algorithm was susceptible to bias in situations where searches for flu-related terms on Google.com were uncharacteristically high within a short time period. We hypothesized that concerned people were reacting to heightened media coverage, which in turn created unexpected spikes in the query volume. This assumption led to a deep investigation into the algorithm that looked for ways to insulate the model from this type of media influence

The antidote – “spike detectors” and more frequent updating.

The Google Flu Trends Still Appears Sick Report

A just-published critique –Google Flu Trends Still Appears Sick – available as a PDF download from a site at Harvard University – provides an in-depth review of the errors and failings of Google foray into predictive analytics. This latest critique of Google flu trends even raises the issue of “transparency” of the modeling approach and seems to insinuate less than impeccable honesty at Google with respect to model performance and model details.

This white paper follows the March 2014 publication of The Parable of Google Flu: Traps in Big Data Analysis in Science magazine. The Science magazine article identifies substantive statistical problems with the Google flu trends modeling, such as the fact that,

..the overestimation problem in GFT was also present in the 2011‐2012 flu season (2). The report also found strong evidence of autocorrelation and seasonality in the GFT errors, and presented evidence that the issues were likely, at least in part, due to modifications made by Google’s search algorithm and the decision by GFT engineers not to use previous CDC reports or seasonality estimates in their models – what the article labeled “algorithm dynamics” and “big data hubris” respectively.

Google Flu Trends Still Appears Sick follows up on the very recent science article, pointing out that the 2013-2014 flu season also shows fairly large errors, and asking –

So have these changes corrected the problem? While it is impossible to say for sure based on one subsequent season, the evidence so far does not look promising. First, the problems identified with replication in GFT appear to, if anything, have gotten worse. Second, the evidence that the problems in 2012‐2013 were due to media coverage is tenuous. While GFT engineers have shown that there was a spike in coverage during the 2012‐2013 season, it seems unlikely that this spike was larger than during the 2005‐2006 A/H5N1 (“bird flu”) outbreak and the 2009 A/H1N1 (“swine flu”) pandemic. Moreover, it does not explain why the proportional errors were so large in the 2011‐2012 season. Finally, while the changes made have dampened the propensity for overestimation by GFT, they have not eliminated the autocorrelation and seasonality problems in the data.

The white paper authors also highlight continuing concerns with Google’s transparency.

One of our main concerns about GFT is the degree to which the estimates are a product of a highly nontransparent process… GFT has not been very forthcoming with this information in the past, going so far as to release misleading example search terms in previous publications (2, 3, 8). These transparency problems have, if anything, become worse. While the data on the intensity of media coverage of flu outbreaks does not involve privacy concerns, GFT has not released this data nor have they provided an explanation of how the information was collected and utilized. This information is critically important for future uses of GFT. Scholars and practitioners in public health will need to be aware of where the information on media coverage comes from and have at least a general idea of how it is applied in order to understand how to interpret GFT estimates the next time there is a season with both high flu prevalence and high media coverage.

They conclude by stating that GFT is still ignoring data that could help it avoid future problems.

Finally, to really muddy the waters Columbia University medical researcher Jeffrey Shaman recently announced First Real-Time Flu Forecast Successful. Shaman’s model apparently keys off Google flu trends.

What Does This Mean?

I think the Google flu trends controversy is important for several reasons.

First, predictive models drawing on internet search activity and coordinated with real-time clinical information are an ambitious and potentially valuable undertaking, especially if they can provide quicker feedback on prospective ILI in specific metropolitan areas. And the Google teams involved in developing and supporting Google flu trends have been somewhat forthcoming in presenting their modeling approach and acknowledging problems that have developed.

“Somewhat” but not fully forthcoming – and that seems to be the problem. Unlike research authored by academicians or the usual scientific groups, the authors of the two main Google reports mentioned above remain difficult to reach directly, apparently. So question linger and critics start to get impatient.

And it appears that there are some standard statistical issues with the Google flu forecasts, such as autocorrelation and seasonality in residuals that remain uncorrected.

I guess I am not completely surprised, since the Google team may have come from the data mining or machine learning community, and not be sufficiently indoctrinated in the “old ways” of developing statistical models.

Craig Venter has been able to do science, and yet operate in private spaces, rather than in the government or nonprofit sector. Whether Google as a company will allow scientific protocols to be followed – as apparently clueless as these are to issues of profit or loss – remains to be seen. But if we are going to throw the concept of “data scientist” around, I guess we need to think through the whole package of stuff that goes with that.

Three Pass Regression Filter – New Data Reduction Method

Malcolm Gladwell’s 10,000 hour rule (for cognitive mastery) is sort of an inspiration for me. I picked forecasting as my field for “cognitive mastery,” as dubious as that might be. When I am directly engaged in an assignment, at some point or other, I feel the need for immersion in the data and in estimations of all types. This blog, on the other hand, represents an effort to survey and, to some extent, get control of new “tools” – at least in a first pass. Then, when I have problems at hand, I can try some of these new techniques.

Ok, so these remarks preface what you might call the humility of my approach to new methods currently being innovated. I am not putting myself on a level with the innovators, for example. At the same time, it’s important to retain perspective and not drop a critical stance.

The Working Paper and Article in the Journal of Finance

Probably one of the most widely-cited recent working papers is Kelly and Pruitt’s three pass regression filter (3PRF). The authors, shown above, are with the University of Chicago, Booth School of Business and the Federal Reserve Board of Governors, respectively, and judging from the extensive revisions to the 2011 version, they had a bit of trouble getting this one out of the skunk works.

Recently, however, Kelly and Pruit published an important article in the prestigious Journal of Finance called Market Expectations in the Cross-Section of Present Values. This article applies a version of the three pass regression filter to show that returns and cash flow growth for the aggregate U.S. stock market are highly and robustly predictable.

I learned of a published application of the 3PRF from Francis X. Dieblod’s blog, No Hesitations, where Diebold – one of the most published authorities on forecasting – writes

Recent interesting work, moreover, extends PLS in powerful ways, as with the Kelly-Pruitt three-pass regression filter and its amazing apparent success in predicting aggregate equity returns.

What is the 3PRF?

The working paper from the Booth School of Business cited at a couple of points above describes what might be cast as a generalization of partial least squares (PLS). Certainly, the focus in the 3PRF and PLS is on using latent variables to predict some target.

I’m not sure, though, whether 3PRF is, in fact, more of a heuristic, rather than an algorithm.

What I mean is that the three pass regression filter involves a procedure, described below.

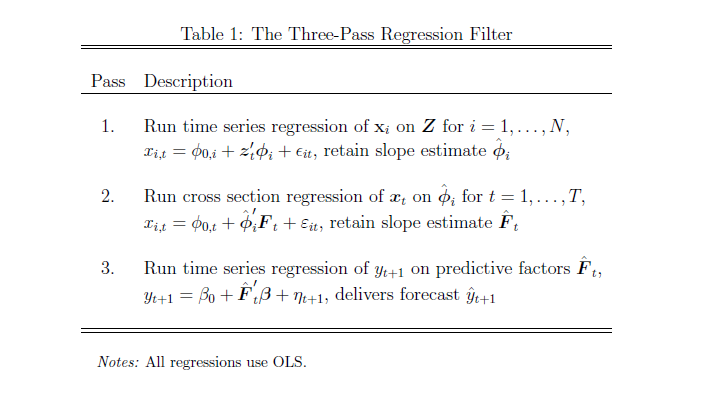
(click to enlarge).

3PRFprocedure

Here’s the basic idea –

Suppose you have a large number of potential regressors xi ε X, i=1,..,N. In fact, it may be impossible to calculate an OLS regression, since N > T the number of observations or time periods.

Furthermore, you have proxies zj ε  Z, I = 1,..,L – where L is significantly less than the number of observations T. These proxies could be the first several principal components of the data matrix, or underlying drivers which theory proposes for the situation. The authors even suggest an automatic procedure for generating proxies in the paper.

And, finally, there is the target variable yt which is a column vector with T observations.

Latent factors in a matrix F drive both the proxies in Z and the predictors in X. Based on macroeconomic research into dynamic factors, there might be only a few of these latent factors – just as typically only a few principal components account for the bulk of variation in a data matrix.

Now here is a key point – as Kelly and Pruitt present the 3PRF, it is a leading indicator approach when applied to forecasting macroeconomic variables such as GDP, inflation, or the like. Thus, the time index for yt ranges from 2,3,…T+1, while the time indices of all X and Z variables and the factors range from 1,2,..T. This means really that all the x and z variables are potentially leading indicators, since they map conditions from an earlier time onto values of a target variable at a subsequent time.

What Table 1 above tells us to do is –

  1. Run an ordinary least square (OLS) regression of the xi      in X onto the zj in X, where T ranges from 1 to T and there are      N variables in X and L << T variables in Z. So, in the example      discussed below, we concoct a spreadsheet example with 3 variables in Z,      or three proxies, and 10 predictor variables xi in X (I could      have used 50, but I wanted to see whether the method worked with lower      dimensionality). The example assumes 40 periods, so t = 1,…,40. There will      be 40 different sets of coefficients of the zj as a result of      estimating these regressions with 40 matched constant terms.
  2. OK, then we take this stack of estimates of      coefficients of the zj and their associated constants and map      them onto the cross sectional slices of X for t = 1,..,T. This means that,      at each period t, the values of the cross-section. xi,t, are      taken as the dependent variable, and the independent variables are the 40      sets of coefficients (plus constant) estimated in the previous step for      period t become the predictors.
  3. Finally, we extract the estimate of the factor loadings      which results, and use these in a regression with target variable as the      dependent variable.

This is tricky, and I have questions about the symbolism in Kelly and Pruitt’s papers, but the procedure they describe does work. There is some Matlab code here alongside the reference to this paper in Professor Kelly’s research.

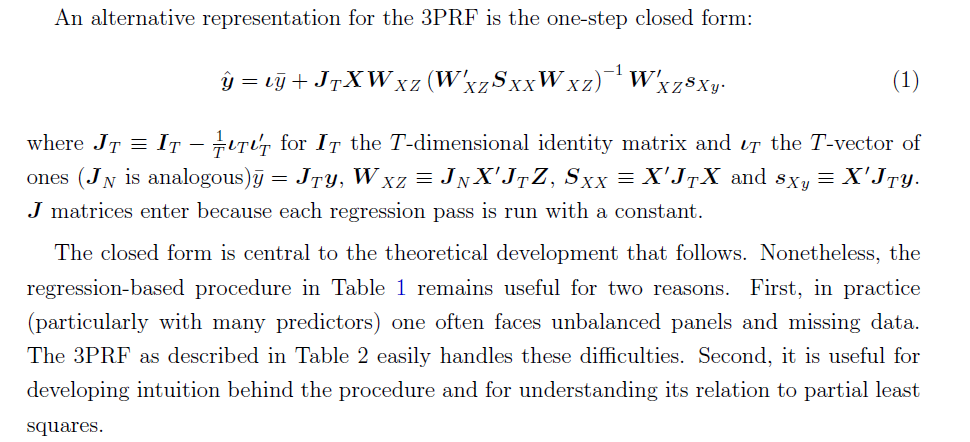
At the same time, all this can be short-circuited (if you have adequate data without a lot of missing values, apparently) by a single humungous formula –

3PRFformula

Here, the source is the 2012 paper.

Spreadsheet Implementation

Spreadsheets help me understand the structure of the underlying data and the order of calculation, even if, for the most part, I work with toy examples.

So recently, I’ve been working through the 3PRF with a small spreadsheet.

Generating the factors:I generated the factors as two columns of random variables (=rand()) in Excel. I gave the factors different magnitudes by multiplying by different constants.

Generating the proxies Z and predictors X. Kelly and Pruitt call for the predictors to be variance standardized, so I generated 40 observations on ten sets of xi by selecting ten different coefficients to multiply into the two factors, and in each case I added a normal error term with mean zero and standard deviation 1. In Excel, this is the formula =norminv(rand(),0,1).

Basically, I did the same drill for the three zj — I created 40 observations for z1, z2, and z3 by multiplying three different sets of coefficients into the two factors and added a normal error term with zero mean and variance equal to 1.

Then, finally, I created yt by multiplying randomly selected coefficients times the factors.

After generating the data, the first pass regression is easy. You just develop a regression with each predictor xi as the dependent variable and the three proxies as the independent variables, case-by-case, across the time series for each. This gives you a bunch of regression coefficients which, in turn, become the explanatory variables in the cross-sectional regressions of the second step.

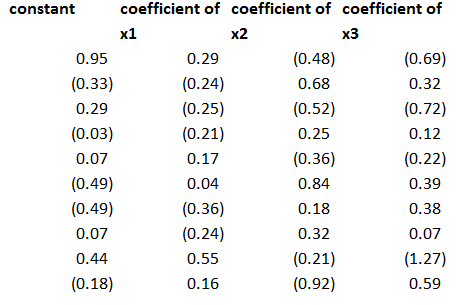
The regression coefficients I calculated for the three proxies, including a constant term, were as follows – where the 1st row indicates the regression for x1 and so forth.

coeff

This second step is a little tricky, but you just take all the values of the predictor variables for a particular period and designate these as the dependent variables, with the constant and coefficients estimated in the previous step as the independent variables. Note, the number of predictors pairs up exactly with the number of rows in the above coefficient matrix.

This then gives you the factor loadings for the third step, where you can actually predict yt (really yt+1 in the 3PRF setup). The only wrinkle is you don’t use the constant terms estimated in the second step, on the grounds that these reflect “idiosyncratic” effects, according to the 2011 revision of the paper.

Note the authors describe this as a time series approach, but do not indicate how to get around some of the classic pitfalls of regression in a time series context. Obviously, first differencing might be necessary for nonstationary time series like GDP, and other data massaging might be in order.

Bottom line – this worked well in my first implementation.

To forecast, I just used the last regression for yt+1 and then added ten more cases, calculating new values for the target variable with the new values of the factors. I used the new values of the predictors to update the second step estimate of factor loadings, and applied the last third pass regression to these values.

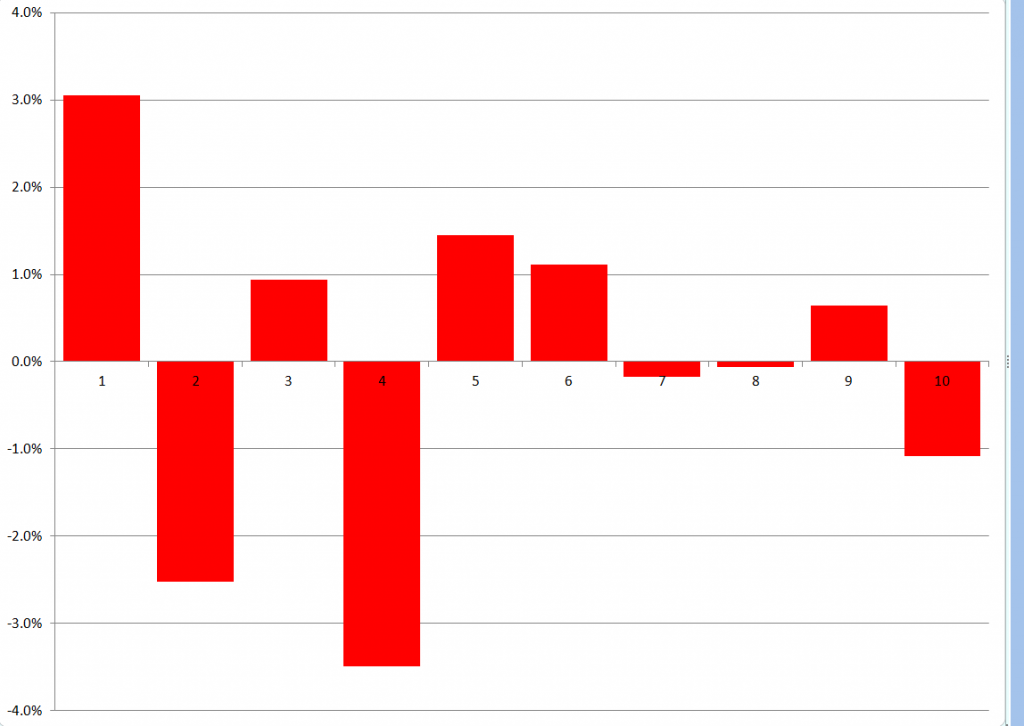
Here are the forecast errors for these ten out-of-sample cases.

3PRFforecasterror

Not bad for a first implementation.

 Why Is Three Pass Regression Important?

3PRF is a fairly “clean” solution to an important problem, relating to the issue of “many predictors” in macroeconomics and other business research.

Noting that if the predictors number near or more than the number of observations, the standard ordinary least squares (OLS) forecaster is known to be poorly behaved or nonexistent, the authors write,

How, then, does one effectively use vast predictive information? A solution well known in the economics literature views the data as generated from a model in which latent factors drive the systematic variation of both the forecast target, y, and the matrix of predictors, X. In this setting, the best prediction of y is infeasible since the factors are unobserved. As a result, a factor estimation step is required. The literature’s benchmark method extracts factors that are significant drivers of variation in X and then uses these to forecast y. Our procedure springs from the idea that the factors that are relevant to y may be a strict subset of all the factors driving X. Our method, called the three-pass regression filter (3PRF), selectively identifies only the subset of factors that influence the forecast target while discarding factors that are irrelevant for the target but that may be pervasive among predictors. The 3PRF has the advantage of being expressed in closed form and virtually instantaneous to compute.

So, there are several advantages, such as (1) the solution can be expressed in closed form (in fact as one complicated but easily computable matrix expression), and (2) there is no need to employ maximum likelihood estimation.

Furthermore, 3PRF may outperform other approaches, such as principal components regression or partial least squares.

The paper illustrates the forecasting performance of 3PRF with real-world examples (as well as simulations). The first relates to forecasts of macroeconomic variables using data such as from the Mark Watson database mentioned previously in this blog. The second application relates to predicting asset prices, based on a factor model that ties individual assets’ price-dividend ratios to aggregate stock market fluctuations in order to uncover investors’ discount rates and dividend growth expectations.