Category Archives: macroeconomic forecasting

More on Negative Nominal Interest Rates

The European Central Bank (ECB) experiment with negative interest rates has not occurred in a vacuum. The concept has been discussed with special urgency since 2008 in academic and financial circles.

Recently, Larry Summers and Paul Krugman have developed perspectives on the desirability of busting through the zero bound on interest rates to help balance aggregate demand and supply at something like full employment.

Then, there is Ken Rogoff’s Costs and Benefits to Phasing Out Paper Currency, distributed by the National Bureau of Economic Research (NBER).

Rogoff notes,

If all central bank liabilities were electronic, paying a negative interest on reserves (basically charging a fee) would be trivial. But as long as central banks stand ready to convert electronic deposits to zero-interest paper currency in unlimited amounts, it suddenly becomes very hard to push interest rates below levels of, say, -0.25 to -0.50 percent, certainly not on a sustained basis. Hoarding cash may be inconvenient and risky, but if rates become too negative, it becomes worth it.

Rogoff cites Buiter’s research at the London School of Economics (LSE) which dates to a decade earler, but has been significantly revised in the 2009-10 timeframe.

For example, there is Negative Nominal Interest Rates: Three ways to overcome the zero lower bound, which sports the following abstract:

The paper considers three methods for eliminating the zero lower bound on nominal interest rates and thus for restoring symmetry to domain over which the central bank can vary its policy rate. They are: (1) abolishing currency (which would also be a useful crime-fighting measure); (2) paying negative interest on currency by taxing currency; and (3) decoupling the numéraire from the currency/medium of exchange/means of payment and introducing an exchange rate between the numéraire and the currency which can be set to achieve a forward discount (expected depreciation) of the currency vis-a-vis the numéraire when the nominal interest rate in terms of the numéraire is set at a negative level for monetary policy purposes.

Buiter notes the “scrip” money developed locally during the Great Depression (also see Champ) effectively involved a tax on holding this type of currency.

Stamp scrip, sometimes called coupon scrip, arose in several communities. It was denominated in dollars, in denominations from 25 cents to $5, with $1 denominations most common. Stamp scrip often became redeemable by the issuer in official U.S. dollars after one year.

What made stamp scrip unique among scrip schemes was a series of boxes on the reverse side of the note. Stamp scrip took two basic forms—dated and undated (often called “transaction stamp scrip”). Typically, 52 boxes appeared on the back of dated stamp scrip, one for each week of the year. In order to spend the dated scrip, the stamps on the back had to be current. Each week, a two-cent stamp needed to be purchased from the issuer and affixed over the corresponding week’s box on the back of the scrip. Over the coming week, the scrip could be spent freely within the community. Whoever was caught holding the scrip at week’s end was required to attach a new stamp before spending the scrip. In this scheme, money became a hot potato, with individuals passing it quickly to avoid having to pay for the next stamp.

Among the virtues of eliminating paper currency and going entirely to electronic transactions, thus, would be that the central bank could charge a negative interest rate.

Additionally, by eliminating the anonymity of paper money and coin, criminal activities could be more effectively controlled. Rogoff offers calculations suggesting the percentages of US currency held in Europe in ratio to overall economic activity are suspicious, especially since there are apparently a surfeit of 100 dollar bills in these foreign holdings.

These ideas go considerably beyond the small negative interest charged by the ECB on banks holding excess reserves in the central bank accounts. What is being discussed is an extension of negative nominal interest, or a tax on holding cash, to all business agents and individuals in an economy.

Europe, the European Union, the Eurozone – Key Facts and Salient Issues

Considering that social and systems analysis originated largely in Europe (Machiavelli, Vico, Max Weber, Emile Durkheim, Walras, Adam Smith and the English school of political economics, and so forth), it’s not surprising that any deep analysis of the current European situation is almost alarmingly complex, reticulate, and full of nuance.

However, numbers speak for themselves, to an extent, and I want to start with some basic facts about geography, institutions, and economy.

Then, I’d like to precis the current problem from an economic perspective, leaving the Ukraine conflict and its potential for destabilizing things for a later post.

Some Basic Facts About Europe and Its Institutions

But some basic facts, for orientation. The 2013 population of Europe, shown in the following map, is estimated at just above 740 million persons. This makes Europe a little over 10 percent of total global population.

europe

The European Union (EU) includes 28 countries, as follows with their date of entry in parenthesis:

Austria (1995), Belgium (1952), Bulgaria (2007), Croatia (2013), Cyprus (2004), Czech Republic (2004), Denmark (1973), Estonia (2004), Finland (1995), France (1952), Germany (1952), Greece (1981), Hungary (2004), Ireland (1973), Italy (1952), Latvia (2004), Lithuania (2004), Luxembourg (1952), Malta (2004), Netherlands (1952), Poland (2004), Portugal (1986), Romania (2007), Slovakia (2004), Slovenia (2004), Spain (1986), Sweden (1995), United Kingdom (1973).

The EU site states that –

The single or ‘internal’ market is the EU’s main economic engine, enabling most goods, services, money and people to move freely. Another key objective is to develop this huge resource to ensure that Europeans can draw the maximum benefit from it.

There also are governing bodies which are headquartered for the most part in Brussels and administrative structures.

The Eurozone consists of 18 European Union countries which have adopted the euro as their common currency. These countries includes Belgium, Germany, Estonia, Ireland, Greece, Spain, France, Italy, Cyprus, Latvia, Luxembourg, Malta, the Netherlands, Austria, Portugal, Slovenia, Slovakia and Finland.

The European Central Bank (ECB) is located in Frankfurt, Germany and performs a number of central bank functions, but does not clearly state its mandate on its website, so far as I can discover. The ECB has a governing council comprised of representatives from Eurozone banking and finance circles.

Economic Significance of Europe

Something like 160 out of the Global 500 Corporations identified by Fortune magazine are headquartered in Europe – and, of course, tax slides are moving more and more US companies to nominally move their operations to Europe.

According to the International Monetary Fund World Economic Outlook (July 14, 2013 update), the Eurozone accounts for an estimated 17 percent of global output, while the European Union countries comprise an estimated 24 percent of global output. By comparison the US accounts for 23 percent of global output, where all these percents are measured in terms of output in current US dollar equivalents.

What is the Problem?

I began engaging with Europe and its economic setup professionally, some years ago. The European market is important to information technology (IT) companies. Europe was a focus for me in 2008 and through the so-called Great Recession, when sharp drops in output occurred on both sides of the Atlantic. Then, after 2009 for several years, the impact of the global downturn continued to be felt in Europe, especially in the Eurozone, where there was alarm about the possible breakup of the Eurozone, defaults on sovereign debt, and massive banking failure.

I have written dozens of pages on European economic issues for circulation in business contexts. It’s hard to distill all this into a more current perspective, but I think the Greek economist Yanis Varoufakis does a fairly good job.

Let me cite two posts – WHY IS EUROPE NOT ‘COMING TOGETHER’ IN RESPONSE TO THE EURO CRISIS? and MODEST PROPOSAL.

The first quote highlights the problems (and lure) of a common currency to a weaker economy, such as Greece.

Right from the beginning, the original signatories of the Treaty of Rome, the founding members of the European Economic Community, constituted an asymmetrical free trade zone….

To see the significance of this asymmetry, take as an example two countries, Germany and Greece today (or Italy back in the 1950s). Germany, features large oligopolistic manufacturing sectors that produce high-end consumption as well as capital goods, with significant economies of scale and large excess capacity which makes it hard for foreign competitors to enter its markets. The other, Greece for instance, produces next to no capital goods, is populated by a myriad tiny firms with low price-cost margins, and its industry has no capacity to deter competitors from entering.

By definition, a country like Germany can simply not generate enough domestic demand to absorb the products its capital intensive industry can produce and must, thus, export them to the country with the lower capital intensity that cannot produce these goods competitively. This causes a chronic trade surplus in Germany and a chronic trade deficit in Greece.

If the exchange rate is flexible, it will inevitably adjust, constantly devaluing the currency of the country with the lower price-cost margins and revaluing that of the more capital-intensive economy. But this is a problem for the elites of both nations. Germany’s industry is hampered by uncertainty regarding how many DMs it will receive for a BMW produced today and destined to be sold in Greece in, say, ten months. Similarly, the Greek elites are worried by the devaluation of the drachma because, every time the drachma devalues, their lovely homes in the Northern Suburbs of Athens, or indeed their yachts and other assets, lose value relative to similar assets in London and Paris (which is where they like to spend their excess cash). Additionally, Greek workers despise devaluation because it eats into every small pay rise they manage to extract from their employers. This explains the great lure of a common currency to Greeks and to Germans, to capitalists and labourers alike. It is why, despite the obvious pitfalls of the euro, whole nations are drawn to it like moths to the flame.

So there is a problem within the Eurozone of “recycling trade surpluses” basically from Germany and the stronger members to peripheral countries such as Greece, Portugal, Ireland, and even Spain – where Italy is almost a special, but very concerning case.

The next quote is from a section in MODEST PROPOSAL called “The Nature of the Eurozone Crisis.” It is is about as succinct an overview of the problem as I know of – without being excessively ideological.

The Eurozone crisis is unfolding on four interrelated domains.

Banking crisis: There is a common global banking crisis, which was sparked off mainly by the catastrophe in American finance. But the Eurozone has proved uniquely unable to cope with the disaster, and this is a problem of structure and governance. The Eurozone features a central bank with no government, and national governments with no supportive central bank, arrayed against a global network of mega-banks they cannot possibly supervise. Europe’s response has been to propose a full Banking Union – a bold measure in principle but one that threatens both delay and diversion from actions that are needed immediately.

Debt crisis: The credit crunch of 2008 revealed the Eurozone’s principle of perfectly separable public debts to be unworkable. Forced to create a bailout fund that did not violate the no-bailout clauses of the ECB charter and Lisbon Treaty, Europe created the temporary European Financial Stability Facility (EFSF) and then the permanent European Stability Mechanism (ESM). The creation of these new institutions met the immediate funding needs of several member-states, but retained the flawed principle of separable public debts and so could not contain the crisis. One sovereign state, Cyprus, has now de facto gone bankrupt, imposing capital controls even while remaining inside the euro.

During the summer of 2012, the ECB came up with another approach: the Outright Monetary Transactions’ Programme (OMT). OMT succeeded in calming the bond markets for a while. But it too fails as a solution to the crisis, because it is based on a threat against bond markets that cannot remain credible over time.

And while it puts the public debt crisis on hold, it fails to reverse it; ECB bond purchases cannot restore the lending power of failed markets or the borrowing power of failing governments.

Investment crisis: Lack of investment in Europe threatens its living standards and its international competitiveness. As Germany alone ran large surpluses after 2000, the resulting trade imbalances ensured that when crisis hit in 2008, the deficit zones would collapse. And the burden of adjustment fell exactly on the deficit zones, which could not bear it. Nor could it be offset by devaluation or new public spending, so the scene was set for disinvestment in the regions that needed investment the most.

Thus, Europe ended up with both low total investment and an even more uneven distribution of that investment between its surplus and deficit regions.

Social crisis: Three years of harsh austerity have taken their toll on Europe’s peoples. From Athens to Dublin and from Lisbon to Eastern Germany, millions of Europeans have lost access to basic goods and dignity. Unemployment is rampant. Homelessness and hunger are rising. Pensions have been cut; taxes on necessities meanwhile continue to rise. For the first time in two generations, Europeans are questioning the European project, while nationalism, and even Nazi parties, are gaining strength.

This is from a white paper jointly authored by Yanis Varoufakis, Stuart Holland and James K. Galbraith which offers a rationale and proposal for a European “New Deal.” In other words, take advantage of the record low global interest rates and build infrastructure.

The passage covers quite a bit of ground without appearing to be comprehensive. However, it will be be a good guide to check, I think, if a significant downturn unfolds in the next few quarters. Some of the nuances will come to life, as flaws in original band-aid solutions get painfully uncovered.

Now there is no avoiding some type of ideological or political stance in commenting on these issues, but the future is the real question. What will happen if a recession takes hold in the next few quarters?

More on European Banks

European banks have been significantly under-capitalized, as the following graphic from before the Great Recession highlights.
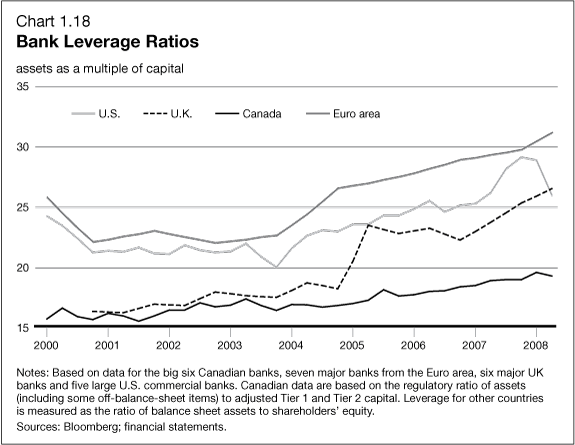
bankleverage

Another round of stress tests are underway by the ECB, and, according to the Wall Street Journal, will be shared with banks in coming weeks. Significant recapitalization of European banks, often through stock issues, has taken place. Things have moved forward from the point at which, last year, the US Federal Deposit Insurance Corporation (FDIC) Vice Chairman called Deutsche Banks capitalization ratios “horrible,” “horribly undercapitalized” and with “no margin of error.”

Bottom LIne

If a recession unfolds in the next few quarters, it is likely to significantly impact the European economy, opening up old wounds, so to speak, wounds covered with band-aid solutions. I know I have not proven this assertion in this post, but it is a message I want to convey.

The banking sector is probably where the problems will first flare up, since banks have significant holdings of sovereign debt from EU states that already are on the ropes – like Greece, Spain, Portugal, and Italy. There also appears to be some evidence of froth in some housing markets, with record low interest rates and the special conditions in the UK.

Hopefully, the global economy can side-step this current wobble from the first quarter 2014 and maybe even further in some quarters, and somehow sustain positive or at least zero growth for a few years.

Otherwise, this looks like a house of cards.

Negative Nominal Interest Rates – the European Central Bank Experiment

Larry Summers, former US Treasury Secretary and, earlier, President of Harvard delivered a curious speech at an IMF Economic Forum last year. After nice words about Stanley Fischer, currently Vice Chair of the Fed, Summers entertains the notion of negative interest rates to combat secular stagnation and restore balance between aggregate demand and supply at something like full employment.

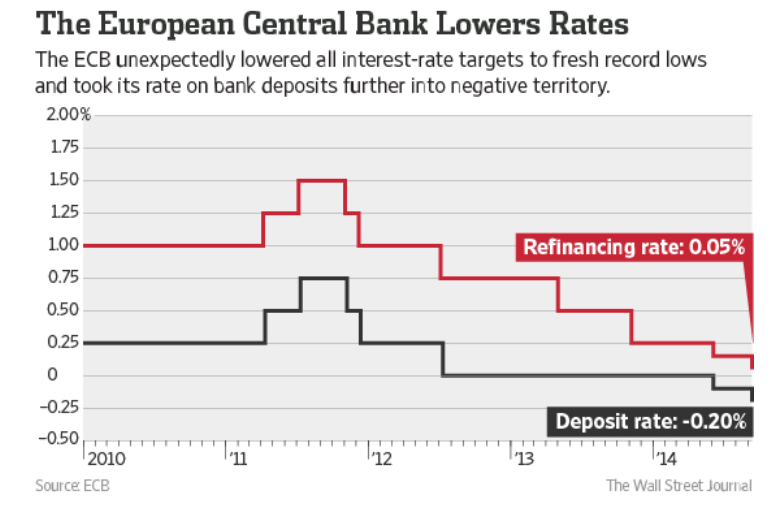
Fast forward to June 2014, when the European Central Bank (ECB) pushes the interest rate on deposits European banks hold in the ECB into negative territory. And on September 4, the ECB drops the deposit rates further to -0.2 percent, also reducing a refinancing rate to virtually zero.

ECBnegint

The ECB discusses this on its website – Why Has the ECB Introduced a Negative interest Rate. After highlighting the ECB mandate to ensure price stability by aiming for an inflation rate of below but close to 2% over the medium term, the website observes euro area inflation is expected to remain considerably below 2% for a prolonged period.

This provides a rationale for lower interest rates, of which there are principally three under ECB control – a marginal lending facility for overnight lending to banks, the main refinancing operations and the deposit facility.

Note that the main refinancing rate is the rate at which banks can regularly borrow from the ECB while the deposit rate is the rate banks receive for funds parked at the central bank.

The ECB is adjusting interest rates under their control across the board, as suggested by the chart, but worries that to maintain a functioning money market in which commercial banks lend to each other, these rates cannot be too close to each other.

So, bottom line, the deposit rate was lowered to − 0.10 % in June to maintain this corridor, and then further as the refinancing rate was dropped to -.05 percent.

The hope is that lower refinancing rates will mean lower rates for customers for bank loans, while negative deposit rates will act as a disincentive for banks to simply park excess reserves in the ECB.

Nominal Versus Real Interest Rates and Bond Yields

If you want to prep for, say, negative yields on two year Irish bonds, or issuance of various European bonds with negative yield, as well as the negative yields of a variety of US securities in recent years, after inflation, check out How Low Can You Go? Negative Interest Rates and Investors’ Flight to Safety.

An asset can generate a negative yield, on a conventional, rather than catastrophic basis, in a nominal or real, which is to say, inflation-adjusted, sense.

Some examples of negative real interest rates of yields –

The yield to maturity on the 5-year Treasury note has been below 2 percent since July 2010, and the yield to maturity on the 10-year Treasury note has been below 2 percent since May 2012. Yet, looking forward, the Federal Open Market Committee in January 2012 announced an inflation target of 2 percent—implying an anticipated negative real yield over the life of the securities. Investors, facing uncertainty, appear willing to pay the U.S. government—when measured in real, ex post inflation-adjusted dollars—for the privilege of owning Treasury securities.

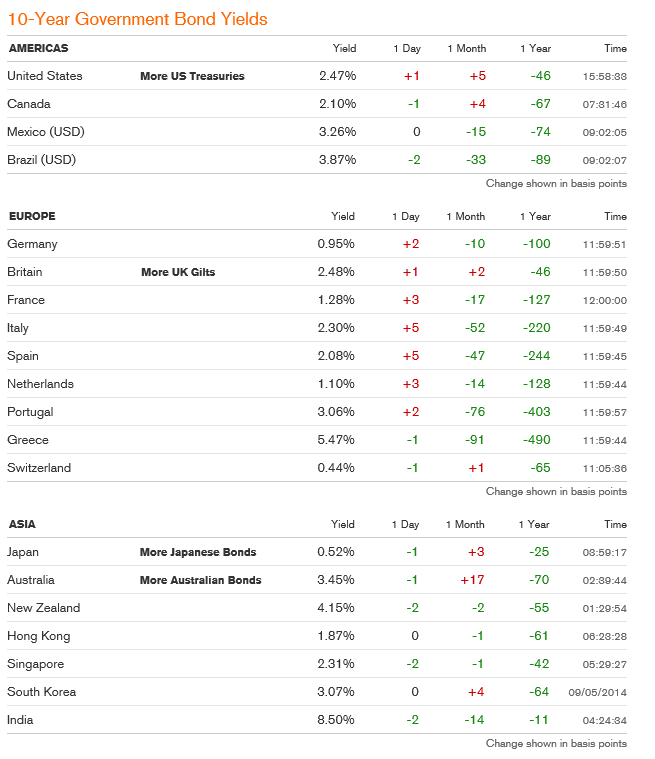
And the current government bond yield situation, from Bloomberg, shows important instances of negative yields, notably Germany and Japan – two of the largest global economies. Click to enlarge.

bondyields

Where the ECB Goes From Here

Mario Draghi, ECB head, gave a speech clearly stating monetary policy is not enough, at the recent Jackson Hole conference of central bankers. After this, the financial press was abuzz with the idea Draghi is moving toward the Japanese leader Abe’s formulation in which there are three weapons or arrows in the Japanese formulation– monetary policy, fiscal policy and structural reforms.

The problem, in the case of the Eurozone, is achieving political consensus for fiscal policies such as backing bonds for badly needed infrastructure development. German opposition seems to be sustained and powerful.

Because of the “political economy” factors , currency and banking problems in the Eurozone are probably more complicated and puzzling than many business executives and managers, looking for a take on the situation, would prefer.

A Thought Experiment

Before diving into this conceptually hazardous topic, though, I’d like to pose a puzzle for readers.

Can banks realistically “charge” negative interest rates to commercial customers?

I seem to have cooked up a spreadsheet where such loans could pay a rate of positive real return to banks, if the rate of deflation can be projected.  In one variant, the bank collects a lending fee at the outset and then the interest rate for installments is negative.

The “save” for banks is that future deflation could inflate the real value of declining nominal installment payments, creating a present value of this stream of payments which is greater than the simple sum of such payments.

I’m not ready for primetime television with this, but it seems such a world encapsulates a very dour view of the future – one that may not be too far from the actual situation in Europe and Japan.

Money black hole at top from Conservative Read

US Surge in 2nd Quarter GDP

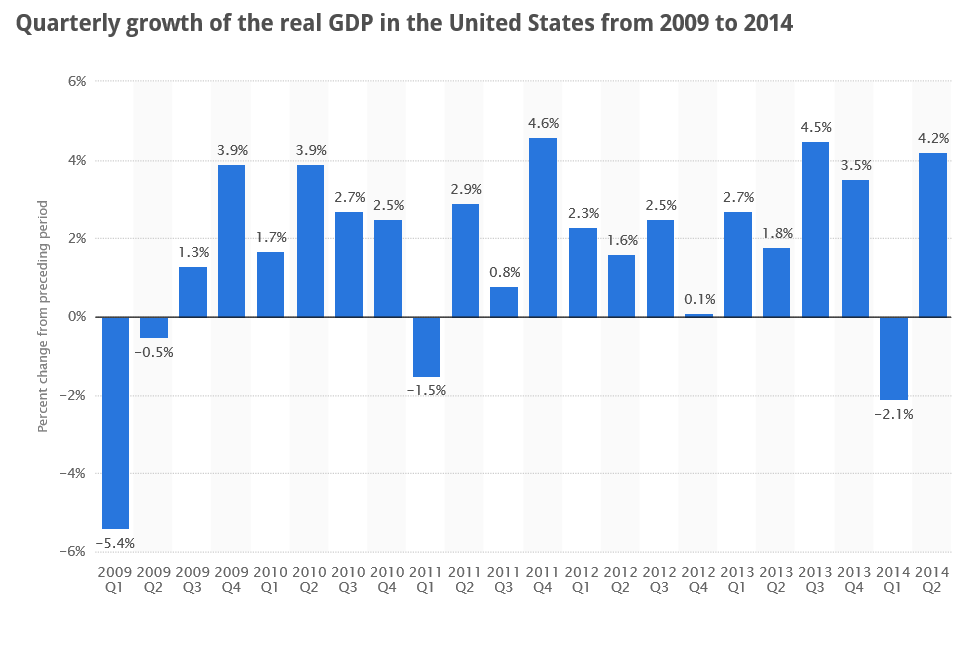
Statistica put together this graphic showing quarter-over-quarter growth in US real GDP from 2009 to the 2nd quarter of 2014.

QoQRGDPGr

The last bar in the chart, showing 4.2 percent growth, is the 2nd quarter 2014 estimate, released by The Bureau of Economic Analysis (BEA) August 28. This represents a slight upward revision from the 4.0 percent “advance estimate” released in July.

Notice these are quarter-over-quarter growth rates, and, as the Statistica chart shows, are fairly volatile.

Thus, a 4.1 percent real or inflation-adjusted growth rate for the April through June 2014 period does not mean 2014 growth will roll in at this rate.

In fact, as the Forbes item on this release highlights,

Dan North, chief economist at Euler Hermes North America… warns GDP watchers should not get too excited…since the economy contracted 2.1% in the first quarter of this year the large jump is payback and in the first half of 2014 the economy gained just 1%. North expects third and fourth quarter GDP to gain around 3% which would round out to an uninspiring roughly 2% growth for the year.

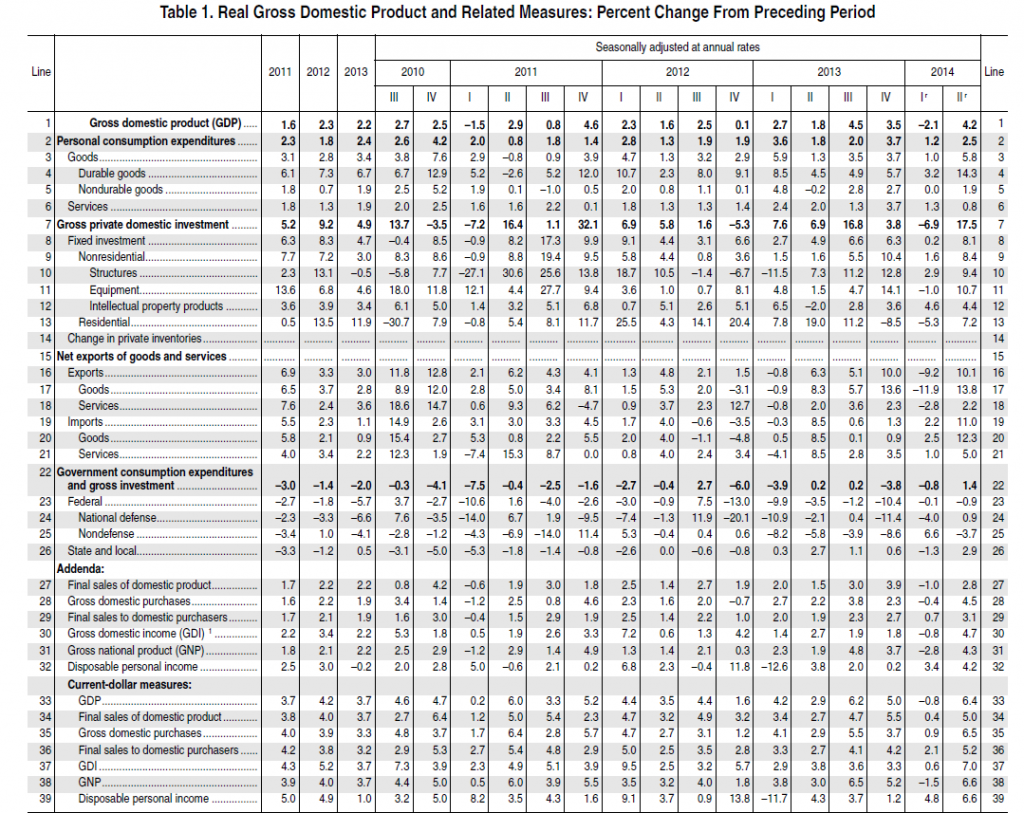
The BEA presents the following detail on the growth estimate (click to enlarge).

BEAtab

Personal consumption expenditures are the largest component in the real GDP series, and bounced back to 2.5 percent growth in the 2nd quarter. Gross private domestic investment surged 17.5 percent for Q2 over Q1, and included healthy 10.7 Q-over-Q growth in investment in equipment. Exports also showed solid Q-over-Q growth.

Europe and Japan

Europe and Japan numbers for the 2nd Quarter are more pessimistic.

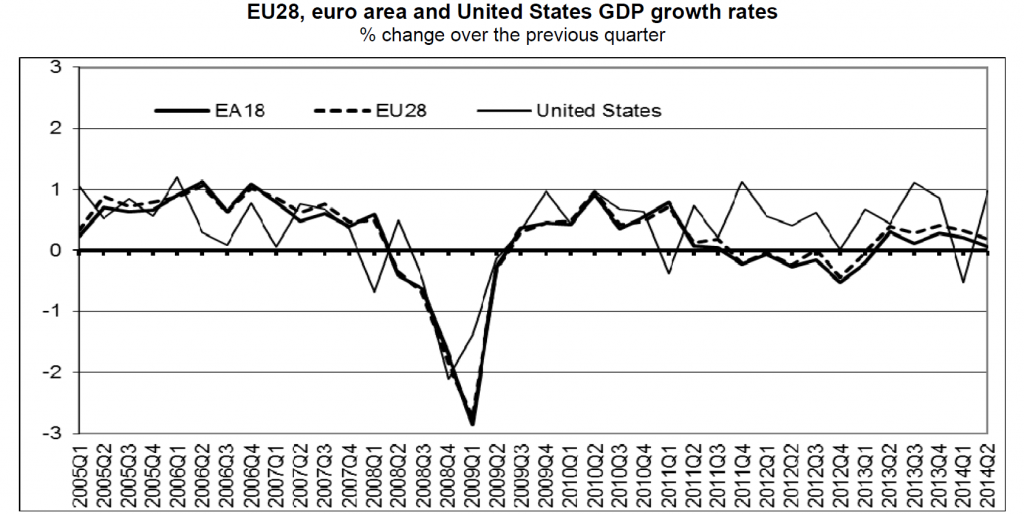
Here’s a comparison with European Q-over-Q real growth rates from Eurostat .

eurostat

The EA 18 is the Euro Area, which includes Belgium, Germany, Estonia, Ireland, Greece, Spain, France, Italy, Cyprus, Latvia, Luxembourg, Malta, the Netherlands, Austria, Portugal, Slovenia, Slovakia and Finland.

Germany and Italy report -0.2 percent declines Q-over-Q growth in the 2nd quarter.

Trading Economics compiles the following chart of Japanese Q-over-Q real GDP growth, which tanked the 2nd quarter.

Japan

From this data, I think it is safe to say the recovery from 2008-2009 is still under-performing.

Whether these data will be followed on by year-over-year declines in future quarters remains to be seen.

Recession and Economic Projections

I’ve been studying the April 2014 World Economic Outlook (WEO) of the International Monetary Fund (IMF) with an eye to its longer term projections of GDP.

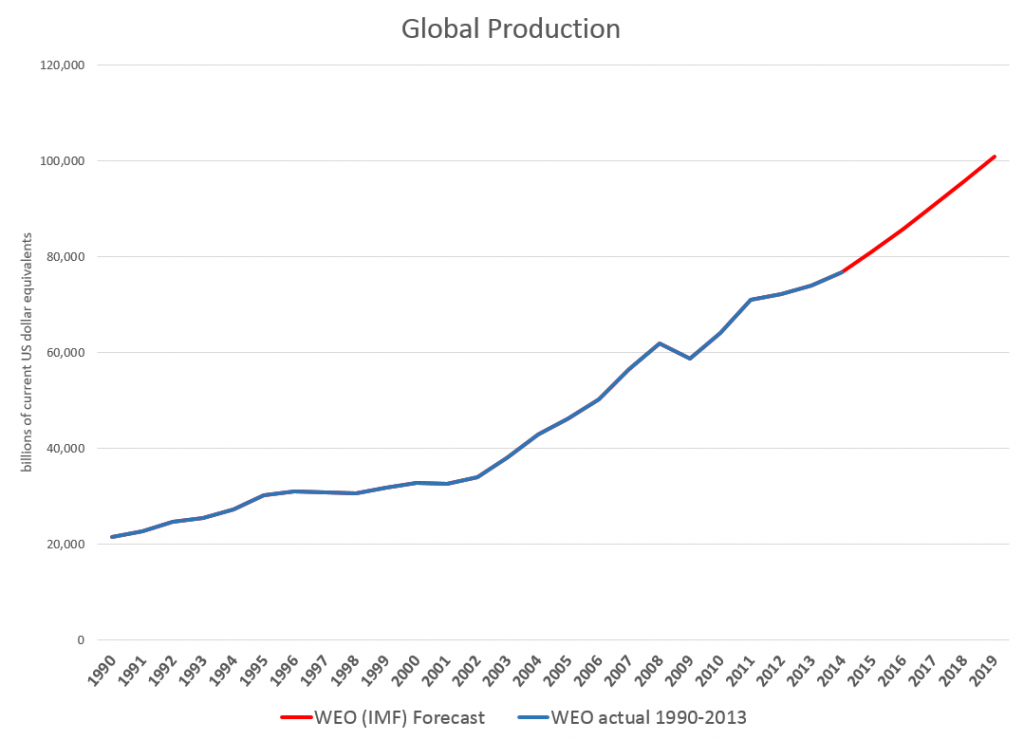
Downloading the WEO database and summing the historic and projected GDP’s suggests this chart.

GlobalGDP

The WEO forecasts go to 2019, almost to our first benchmark date of 2020. Global production is projected to increase from around $76.7 trillion in current US dollar equivalents to just above $100 trillion. An update in July marked the estimated 2014 GDP growth down from 3.7 to 3.4 percent, leaving the 2015 growth estimate at a robust 4 percent.

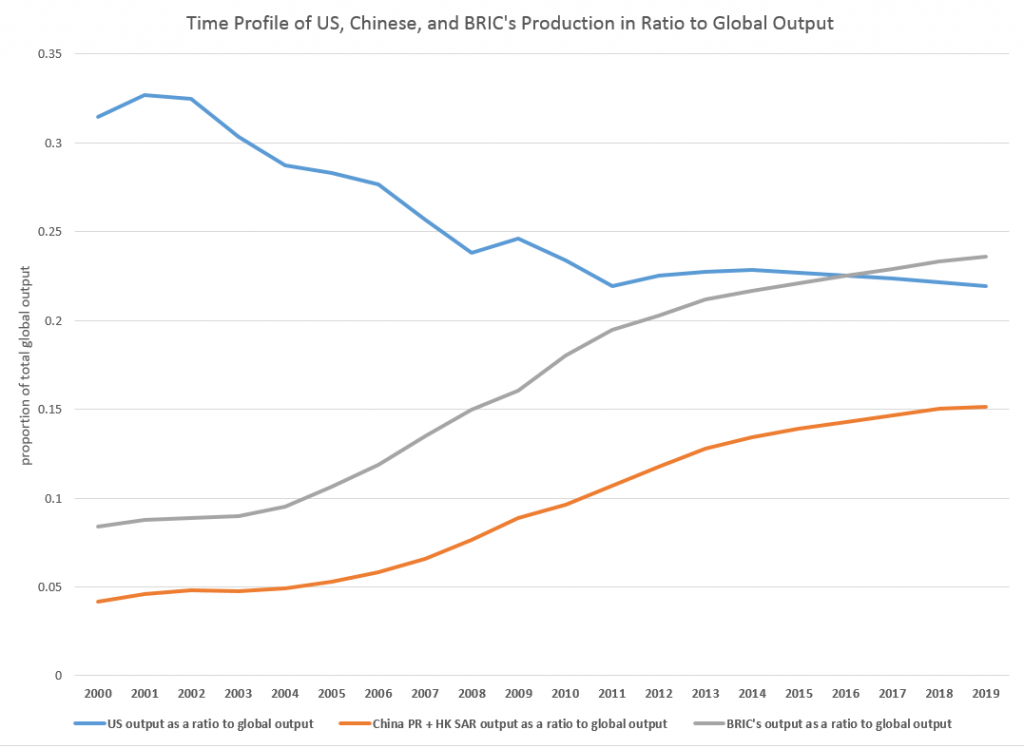
The WEO database is interesting, because it’s country detail allows development of charts, such as this.

gbobalproout

So, based on this country detail on GDP and projections thereof, the BRIC’s (Brazil, Russia, India, and China) will surpass US output, measured in current dollar equivalents, in a couple of years.

In purchasing power parity (PPP) terms, China is currently or will soon pass the US GDP, incidentally. Thus, according to the Big Mac index, a hamburger is 41 percent undervalued in China, compared to the US. So boosting Chinese production 41 percent puts its value greater than US output. However, the global totals would change if you take this approach, and it’s not clear the Chinese proportion would outrank the US yet.

The Impacts of Recession

The method of caging together GDP forecasts to the year 2030, the second benchmark we want to consider in this series of posts, might be based on some type of average GDP growth rate.

However, there is a fundamental issue with this, one I think which may play significantly into the actual numbers we will see in coming years.

Notice, for example, the major “wobble” in the global GDP curve historically around 2008-2009. The Great Recession, in fact, was globally synchronized, although it only caused a slight inflection in Chinese and BRIC growth. Europe and Japan, however, took a major hit, bringing global totals down for those years.

Looking at 2015-2020 and, certainly, 2015-2030, it would be nothing short of miraculous if there were not another globally synchronized recession. Currently, for example, as noted in an earlier post here, the Eurozone, including Germany, moved into zero to negative growth last quarter, and there has been a huge drop in Japanese production. Also, Chinese economic growth is ratcheting down from it atmospheric levels of recent years, facing a massive real estate bubble and debt overhang.

But how to include a potential future recession in economic projections?

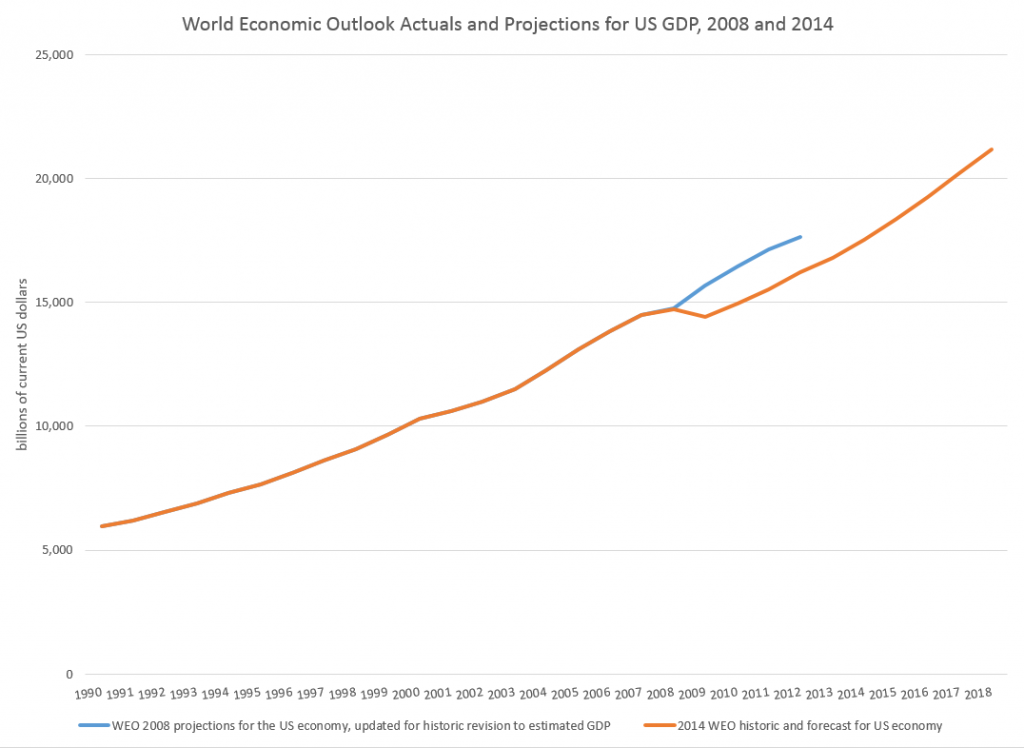
One guide might be to look at how past projections have related to these types of events. Here, for example, is a comparison of the 2008 and 2014 US GDP projections in the WEO’s.

WEOUS

So, according to the IMF, the Great Recession resulted in a continuing loss of US production through until the present.

This corresponds with the concept that, indeed, the GDP time series is, to a large extent, a random walk with drift, as Nelson and Plosser suggested decades ago (triggering a huge controversy over unit roots).

And this chart highlights a meaning for potential GDP. Thus, the capability to produce things did not somehow mysteriously vanish in 2008-2009. Rather, there was no point in throwing up new housing developments in a market that was already massively saturated, Not only that, but the financial sector was unable to perform its usual duties because it was insolvent – holding billions of dollars of apparently worthless collateralized mortgage securities and other financial innovations.

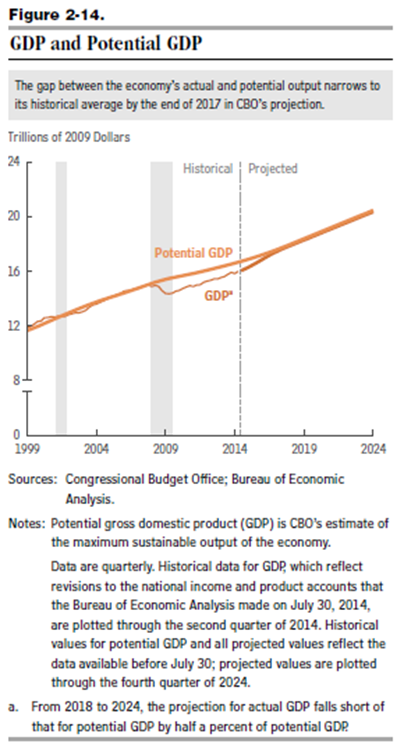
There is a view, however, that over a long period of time some type of mean reversion crops up.

This is exemplified in the 2014 Congressional Budget Office (CBO) projections, as shown in this chart from the underlying detail.

CBOpotentialGDP

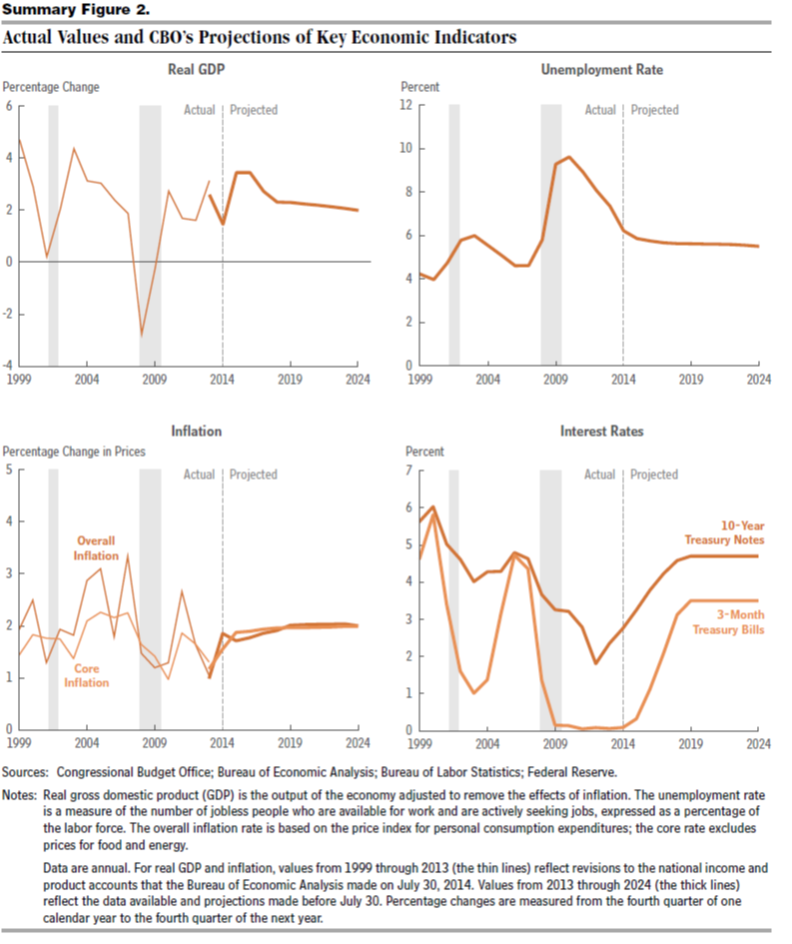
This convergence on potential GDP, which somehow is shown in the diagram with a weaker growth rate just after 2008, is based on the following forecasts of underlying drivers, incidentally.

CBOdrivers

So again, despite the choppy historical detail for US real GDP growth in the chart on the upper left, the forecast adopted by the CBO blithely assumes no recession through 2024 as well as increase in US interest rates back to historic levels by 2019.

I think this clearly suggests the Congressional Budget Office is somewhere in la-la land.

But the underlying question still remains.

How would one incorporate the impacts of an event – a recession – which is probably almost a certainty by the end of these forecast horizons, but whose timing is uncertain?

Of course, there are always scenarios, and I think, particularly for budget discussions, it would be good to display one or two of these.

I’m interested in reader suggestions on this.

Links – late August 2014

Economics Articles, Some Theoretical, Some Applied

Who’s afraid of inflation? Not Fed Chair Janet Yellen At Jackson Hole, Yellen speech on labor market conditions states that 2 percent inflation is not a hard ceiling for the Fed.

Economist’s View notes a new paper which argues that deflation is simply unnecessary, because the conditions for a “helicopter drop” of money (Milton Friedman’s metaphor) are widely met.

Three conditions must be satisfied for helicopter money always to boost aggregate demand. First, there must be benefits from holding fiat base money other than its pecuniary rate of return. Second, fiat base money is irredeemable – viewed as an asset by the holder but not as a liability by the issuer. Third, the price of money is positive. Given these three conditions, there always exists – even in a permanent liquidity trap – a combined monetary and fiscal policy action that boosts private demand – in principle without limit. Deflation, ‘lowflation’ and secular stagnation are therefore unnecessary. They are policy choices.

Stiglitz: Austerity ‘Dismal Failure,’ New Approach Needed

US housing market loses momentum

Fannie Mae economists have downgraded their expectations for the U.S. housing market in the second half of this year, even though they are more optimistic about the prospects for overall economic growth.

How Detroit’s Water Crisis Is Part Of A Much Bigger Problem

“Have we truly become a society to where we’ll go and build wells and stuff in third world countries but we’ll say to hell with our own right here up under our nose, our next door neighbors, the children that our children play with?”

Economic harassment and the Ferguson crisis

According to .. [ArchCity Defenders] recent report .. the Ferguson court is a “chronic offender” in legal and economic harassment of its residents….. the municipality collects some $2.6 million a year in fines and court fees, typically from small-scale infractions like traffic violations…the second-largest source of income for that small, fiscally-strapped municipality….

And racial profiling appears to be the rule. In Ferguson, “86% of vehicle stops involved a black motorist, although blacks make up just 67% of the population,” the report states. “After being stopped in Ferguson, blacks are almost twice as likely as whites to be searched (12.1% vs. 7.9%) and twice as likely to be arrested.” But those searches result in the discovery of contraband at a much lower rate than searches of whites.

Once the process begins, the system begins to resemble the no-exit debtors’ prisons of yore. “Clients reported being jailed for the inability to pay fines, losing jobs and housing as a result of the incarceration, being refused access to the Courts if they were with their children or other family members….

“By disproportionately stopping, charging, and fining the poor and minorities, by closing the Courts to the public, and by incarcerating people for the failure to pay fines, these policies unintentionally push the poor further into poverty, prevent the homeless from accessing the housing, treatment, and jobs they so desperately need to regain stability in their lives, and violate the Constitution.” And they increase suspicion and disrespect for the system.

… the Ferguson court processed the equivalent of three warrants and $312 in fines per household in 2013.

Science

Astronauts find living organisms clinging to the International Space Station, and aren’t sure how they got there

international-space-station-complete-640x408

A Mathematical Proof That The Universe Could Have Formed Spontaneously From Nothing

What caused the Big Bang itself? For many years, cosmologists have relied on the idea that the universe formed spontaneously, that the Big Bang was the result of quantum fluctuations in which the Universe came into existence from nothing.

1_INtAsuxJF7cMqoCBmesz-w

Big Data Trends In 2014 (infographic – click to enlarge)

Aureus-analytics-infographic-option-2

Calling the Next Recession – The Need for New Policy Responses

Yesterday I saw a headline on Reuters,

U.S. retail sales pause, seen rebounding in months ahead

with a story that made the best out of a recent stall in US consumer spending, especially for cars.

I also noticed –

Japan’s Economy Contracts Sharply

Real gross domestic product, the total value of all goods and services produced in the economy, shrank 6.8% in the three months through June on an annualized basis from the prior quarter

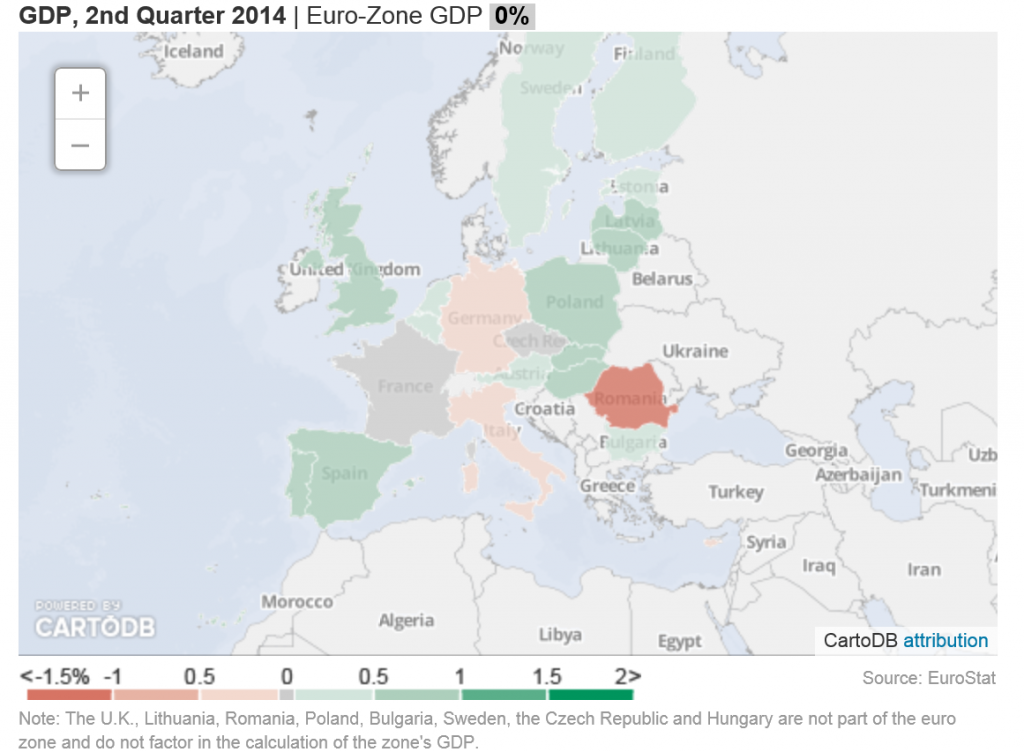
In Europe, the economic tea leaves suggest a developing recession in Italy, negative growth in Germany, and stasis in France, as highlighted in this Wall Street Journal graphic.

EUprospects

Mish Shedlock, furthermore, is all over the bizarre new data coming out of China on bank loans in the standard and shadow banking systems.

New Yuan Loans and Shadow Banking Collapse in China; Record Bank Deposit Slump

All this after the 1st Quarter surprise drop in US real GDP of -2.7 percent, quarter-over-quarter.

A Note on How I Forecast the Global Economy

So my experience is with enterprise level IT companies with markets in the major global economic regions – Europe, Japan, China, the US and the ROW (rest of the world).

The idea is to keep tabs on regional developments to predict sales and, in some respects, to mix and match resources to the most promising markets.

After you do this for a while, it’s obvious there are interdependencies between these markets, in particular trade interdependencies.

Europe provides a large market for Chinese products – a market which has flagged in recent years with prolonged economic troubles in peripheral EU zone areas. The United States also provides China important markets for its goods.

Japan, as one of the largest economies in the world, is in the mix here too.

Bottom line – if all the major global economic regions (except South America?) are flagging, a synchronized global recession is increasingly likely.

What the Problem Is

This is sort of a “plain-vanilla” forecast, and might be fine-tuned with quantitative models – although none of these is especially accurate on a global scale.

But the deeper issue and problem has to do with the US Federal Reserve and many other central banks. And the failure to follow standard fiscal policy measures during the last economic downturn.

A new recession in the United States in 2014 or 2015 would find the US Federal Reserve Bank with no policy tools. The federal funds rate, the overnight rate directly controlled by the Fed, currently is virtually zero. The bond-buying program known as “quantitative easing (QE)” is scheduled to end in October, which means it is still running. The Fed balance sheet already includes more than $4 trillion in liabilities, more than 75 percent of which were incurred fighting the last recession.

That leaves fiscal policy as the only real response to a new recession.

However, the prospects for Congress to step up to the bat in the next two years do not look good.

Barry Ritholtz highlights the problem with Congress in a recent Bloomberg column – Naming the Biggest Losers in America.

The drag from federal government usually is a simple and obvious fix. During a recession and recovery, spending should rise and the Fed should make credit less expensive.

Except in this cycle. Before you start telling me about beliefs and ideology and the deficit, all one needs to do is compare federal spending during the 2001 recession cycle, with a Republican controlling the White House and a split Congress, to the present cycle. Apparently, the importance of reducing deficits and having a smaller government only applies when the GOP doesn’t control the White House.

Look also at state and local government, another huge drag on the economy. Block grants to the states could have helped to pay for police, emergency workers, teachers, road and bridge maintenance as they have in past recessions. But they weren’t, for partisan political reasons. The nation is worse off for it.

Business equipment investment and other forms of capital expenditures have been jump started with an accelerated depreciation tax allowances in past recessions. For some reason, this was allowed to lapse in 2013. This wasn’t very smart; if anything, they should have been extended and made more aggressive.

The biggest drag of all has been the persistent weakness in residential real estate. The recent increases in home prices are the result of record-low mortgage rates and limited inventory, not an economic recovery. As we noted in “The Best Housing Program You’ve Never Heard Of,” there were some attempts to ameliorate this, but they amounted to too little too late.

The bottom line is that as a nation, and mainly because of Congress, we haven’t risen to the challenges we face. There has been little intelligence, no creativity, negligible cooperation, and an epic failure of civic responsibility.

Amen.

Reflections

All this highlights for me that we need to face facts on US Federal Reserve policy, which currently is stuck at the zero lower bound for the federal funds rate and is still buying long term bonds.

The next recession is likely to hit before the Fed “normalizes” interest rates and its QE programs.

Also, the character of the US Congress is unlikely to convert en masse to Keynesian economics in the next two years.

This means, in turn, that unorthodox measures to stimulate the US and global economy will be necessary.

What are they?

Walmart and China – Icons of the Age

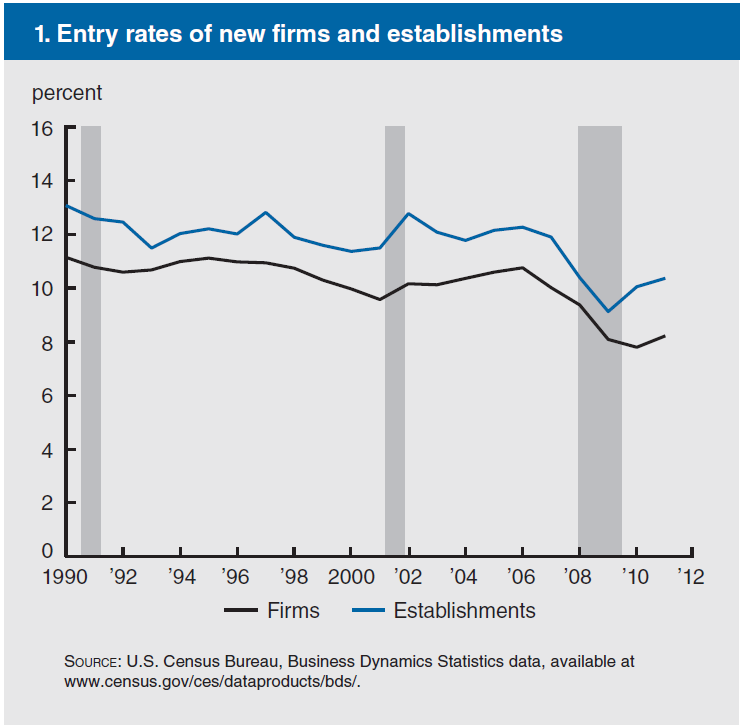
Here’s a puzzle. Why has the rate of new business creation declined fairly consistently for the past 20 or so years? This contrasts with the idea the US is an entrepreneurial nation, that it is the heartland of the “free market” and place where new jobs are created by myriads of startups.

newbuscreate

This pattern is well-established, and is validated by several sources, including a recent Brookings report and Letter of the Chicago Federal Reserve Bank.

There are a cluster of causes, but two words are iconic – Walmart and China.

The Big Box store is a major factor behind the decline in small business startups, with Walmart being the leading superstore. And, for the most part, Big Box stores act as conduits for Chinese-made consumer goods.

Superstore Community Impact

In 2012, Walmart employed about 1 percent of the American workforce in its nearly 5000 stores, and clocked sales of $444 billion in the $17 trillion US economy overall. Certainly significant.

The story is that a Walmart comes to town and Mainstreet shutters up, becomes a ghost town. Gone are dozens of small proprietors and, many say, the sense of community. Instead we have endless aisles of cheap products from China – aisles where clerical assistance is scanty and the clerks often seem kind of lost in the vastness of it all.

Well, elements of this story are well-documented.

For example, there is a great website maintained by the Kennedy School at Harvard which updates the impact studies, even linking the coming of Walmart to an increase in obsesity somehow (lower wages, cheaper deep fat fried food?).

The first Walmart, Target, and K-Mart stores opened in 1962 with a focus on deep discounts and suburban locations.

In the five decades since, the American retail landscape and built environment have been profoundly altered. At the end of 2013, Wal-Mart had 4,700 stores in the United States and Puerto Rico, while Target operated nearly 1,800 locations and Kmart just over 1,200. Then there are smaller chains — still huge by any measure — as well as “category killers” and all the diverse residents of the shopping-mall ecosystem.

Selling a Cheaper Mousetrap: Wal-Mart’s Effect on Retail Prices shows that Wal-Mart’s price impact is large and can be beneficial to consumers.

The analysis combines data on the opening dates of all US Wal-Mart stores with average city-level retail prices of several narrowly-defined commonly-purchased goods over the period 1982-2002. I focus on 10 specific items likely to be sold at Wal-Mart stores and analyze their price dynamics in 165 US cities before and after Wal-Mart entry. I find price declines of 1.5%-3% for many products in the short run, with the largest price effects occurring for aspirin, laundry detergent, toothpaste and shampoo. Long-run price declines tend to be much larger, and in some specifications range from 7-13%. These effects are driven mostly by relatively small cities, which have high ratios of retail establishments to population.

The redoubtable Jerry Hausman of MIT argues that the Bureau of Labor Statistics (BLS) Consumer Price Index (CPI) calculations should be adjusted downward, when full account of Walmart and other superstores’ impact on retail is folded into the calculation.

The jobs impact has been widely studied and is difficult to assess in a controlled framework, but one thing is certain – pay is generally lower (partly since there are no more owner/operators). See also A Downward Push.

One question is whether this is a race to the bottom. But the antidote, should this be true, is not my immediate focus. Rather I want to try to trace the connections between the Big Box stores and other collateral and linked developments.

Big Box Stores as Channels For Chinese Goods

There’s a scrappy website that sends people to check where the goods in Target, K-Mart and Walmart come from – concluding that the vast majority of goods are made in China.

Again, Walmart is iconic.

The Wal-Mart effect claims that Wal-Mart was responsible for $27 billion in U.S. imports from China in 2006 and 11% of the growth of the total U.S. trade deficit with China between 2001 and 2006

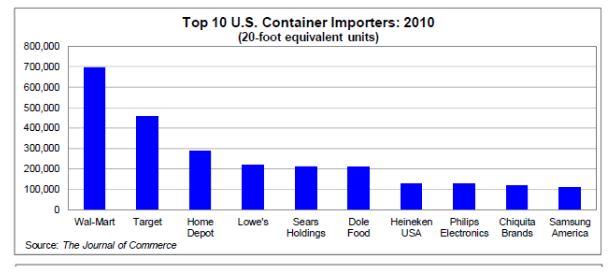
Cargo containers are the innovation which makes this possible, and there is no clearer evidence for the supply sources for the Big Box stores than their record of imports with cargo containers.

This chart shows the number of standard-sized containers going to the top ten container importers.

top10

So the supply-chain extends from Guandong Province to Kansas City, using cargo containers which are first shipped on the ocean, then loaded onto rail cars or trucks and moved to distribution centers, then put out on shelves in the Big Box stores.

China and US Manufacturing

It is no secret that Chinese tools, Chinese-made textiles, and Chinese-assembled electronics generally are cheaper than equivalent goods made in the United States. And it is not just China. There are other low wage supply areas, such as the Malquidores along the border with Mexico and in Guadalahara, as well as contract manufacturers in Vietnam and Eastern Europe.

But, again, China-made consumer goods are iconic, and they have displaced US-made products across a swath of markets.

The Economic Policy Institute (EPI) estimated in 2007 that Chinese-made goods for Walmart alone displaced 200,000 US jobs.

Altogether over the period 2001 to 2006 the US trade deficit with China is estimated to have eliminated 1.8 million US jobs.

Interestingly, this estimate, developed by a left-leaning research institute in the middle of the last decade, is now more-or-less echoed by mainstream economics – or at least by recent research published in the American Economic Review.

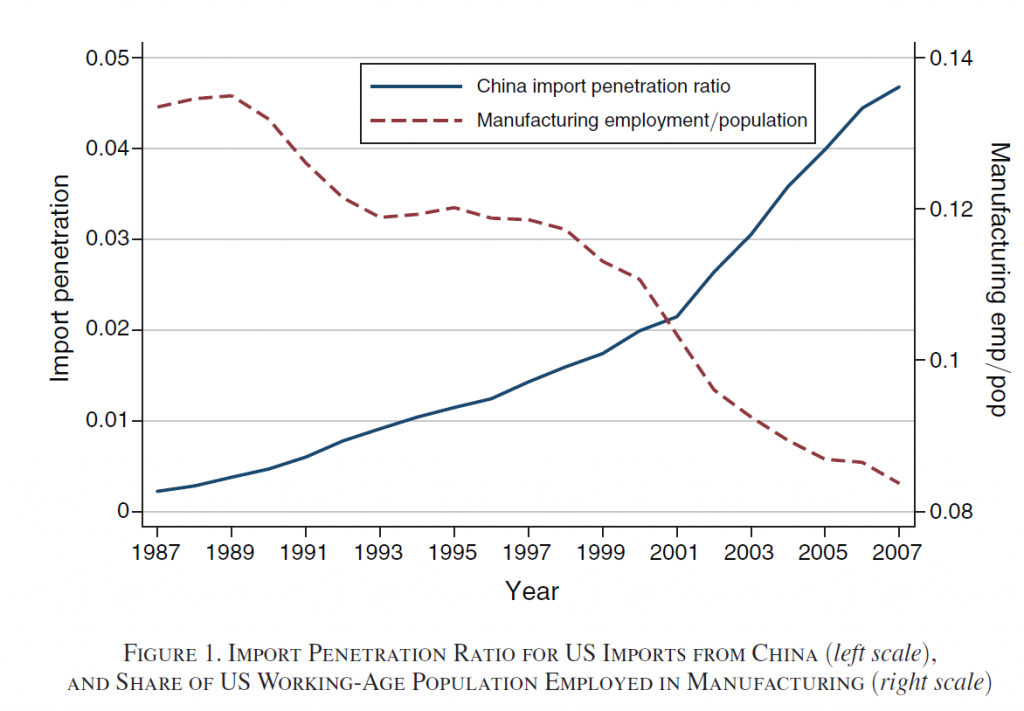
The China Syndrome: Local Labor Market Effects of Import Competition in the United States

Chinabad1

We find that local labor markets that are exposed to rising low-income-country imports due to China’s rising competitiveness experience increased unemployment, decreased labor-force participation, and increased use of disability and other transfer benefits, as well as lower wages.

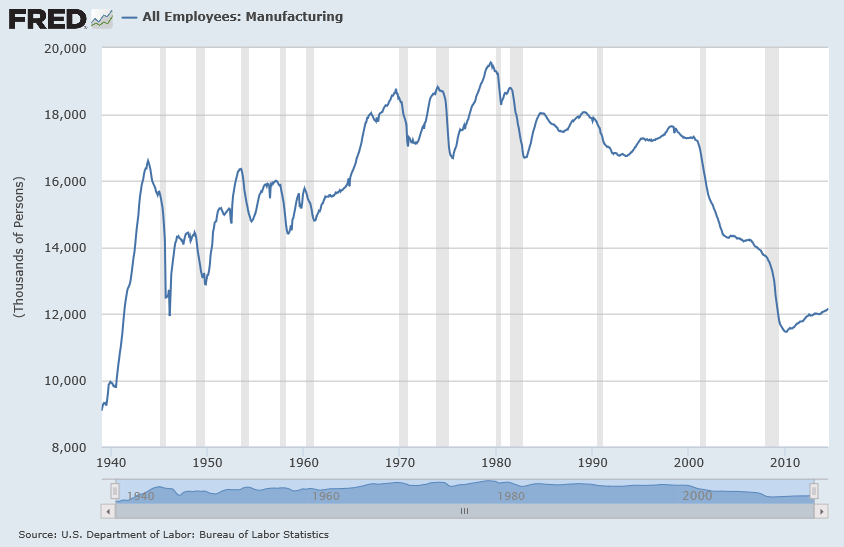
Just to be clear, here is a chart showing the dynamics of US manufacturing employment over the last 60 or so years.

Manuemp

US employment in manufacturing has fallen to the level it was in the late 1940’s.

Additionally, about 4 million of the 12 million persons currently employed in manufacturing are administrative and support personnel.

The US Trade Deficit

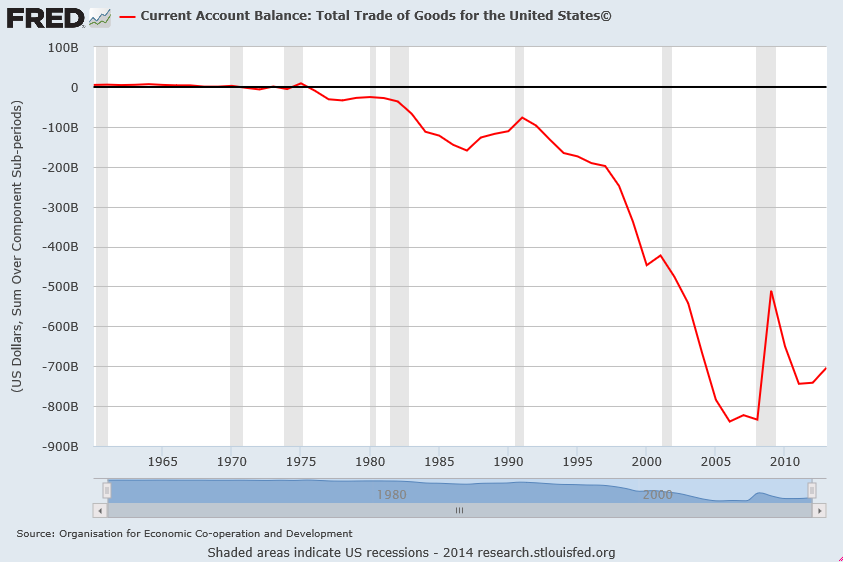
While we are viewing a collage of graphs on the US condition, let’s not forget this memorable chart of the US trade deficit.

tradedeficit

Interestingly, the US balance of trade went south in synch with the activities of the World Trade Organization and agreements on opening trade around the world.

Of course, Walmart is not exclusively or even entirely responsible for these developments, but is part of the story.

Summing Up

Well, I began with the puzzle of the decline in new business formation in the US, focusing on Walmart and then Chinese products. Along the way, I highlight other possible connections, such as decline of US manufacturing employment and lower wages as well as prices.

Any exploration along these lines is bound to seem anecdotal, but at least there are numbers and charts to speak for themselves, to an extent.

On the one hand, we have new shopping centers with Big Box stores springing up all over the place, limiting opportunities for smaller businesses in the community. On the other hand, there is decline of US manufacturing, and loss of jobs accessible to persons without college education or special skills, jobs that can pay about double or triple what standard fast food sector jobs pay.

These twin trends clearly drive polarization of the US economy and society, mitigated to a degree by the lower cost of consumer goods supplied under this new system.

Looking ahead, can the magic of cheap imports can go on indefinitely?  There are bottlenecks of workers with certain skills now emerging in China, and wages are rising there.

Possibly, contract manufacturers and joint ventures can move on to other locales, like Vietnam or Bangladesh.

But at some point, geopolitical risk and problems of infrastructure may slow outsourcing.

One thing – the rejoicing about “in-sourcing” – factories coming back state-side – seems premature, almost an example of wishful thinking.  There are few numbers to back up the happy talk.

In the meanwhile, the slack thinking of American elites to the effect that it’s not necessary and may even be counterproductive to really educate a workforce that will predominately occupy low-paying service sectors jobs may come back to haunt us.

Investments in infrastructure are lagging. Federal spending on medical research has been cut back. Expenditures on R&D are flat to declining in many fields.

Practically the only “deal” available to many younger people without pedigrees or family resources is the US military. And production of defense goods is one area of US manufacturing where high performance activity continues – although offshore contracts there could, in my opinion, sap or even sabotage the ultimate performance of the equipment and material.

I’m working on companion pieces in coming weeks. I want to develop a big picture of the US economy and society at this moment, although I will continue to focus on business forecasting per se in the posts.

Links early August 2014

Economy/Business

Economists React to July’s Jobs Report: ‘Not Weak, But…’

U.S. nonfarm employers added 209,000 jobs in July, slightly below forecasts and slower than earlier gains, while the unemployment rate ticked up to 6.2% from June. But employers have now added 200,000 or more jobs in six consecutive months for the first time since 1997.

The most important charts to see before the huge July jobs report – interesting to see what analysts were looking at just before the jobs announcement.

Despite sharp selloff, too early to worry about a correction

Venture Capital: Deals Beyond the Valley

7 Most Expensive Luxury Cars

BMW

Base price $136,000.

Contango And Backwardation Strategy For VIX ETFs Here you go!

Climate/Weather

Horrid California Drought Gets Worse Has a map showing drought conditions at intervals since 2011, dramatic.

IT

Amazon’s Cloud Is Growing So Fast It’s Scaring Shareholders

Amazon has pulled off a pretty amazing trick over the past decade. It’s invented and then built a nearly $5 billion cloud computing business catering to fickle software developers and put the rest of the technology industry on the defensive. Big enterprise software companies such as IBM and HP and even Google are playing catchup, even as they acknowledge that cloud computing is the tech industry’s future.

But what kind of a future is that to be? Yesterday Amazon said that while its cloud business grew by 90 percent last year, it was significantly less profitable. Amazon’s AWS cloud business makes up the majority of a balance sheet item it labels as “other” (along with its credit card and advertising revenue) and that revenue from that line of business grew by 38 percent. Last quarter, revenue grew by 60 percent. In other words, Amazon is piling on customers faster than it’s adding dollars to its bottom line.

The Current Threat

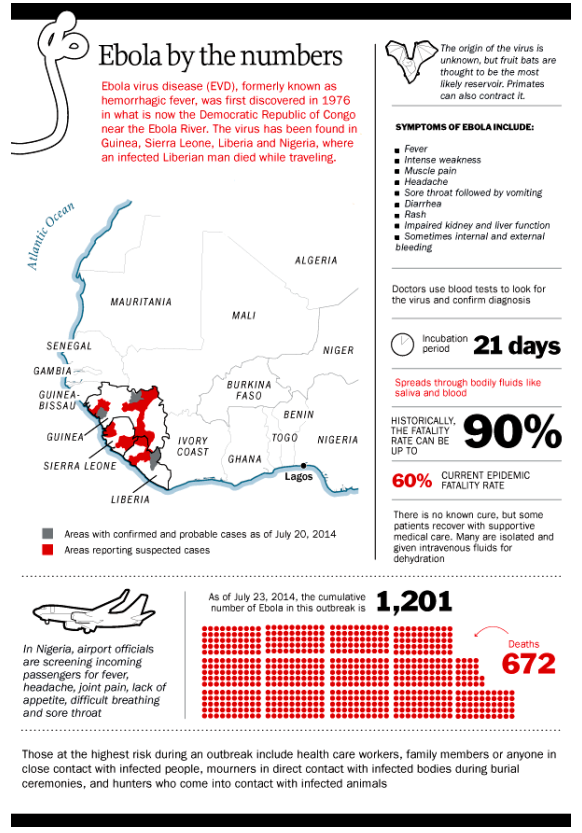
Infographic: Ebola By the Numbers

ebola

Data Science

Statistical inference in massive data sets Interesting and applicable procedure illustrated with Internet traffic numbers.

The Business Cycle

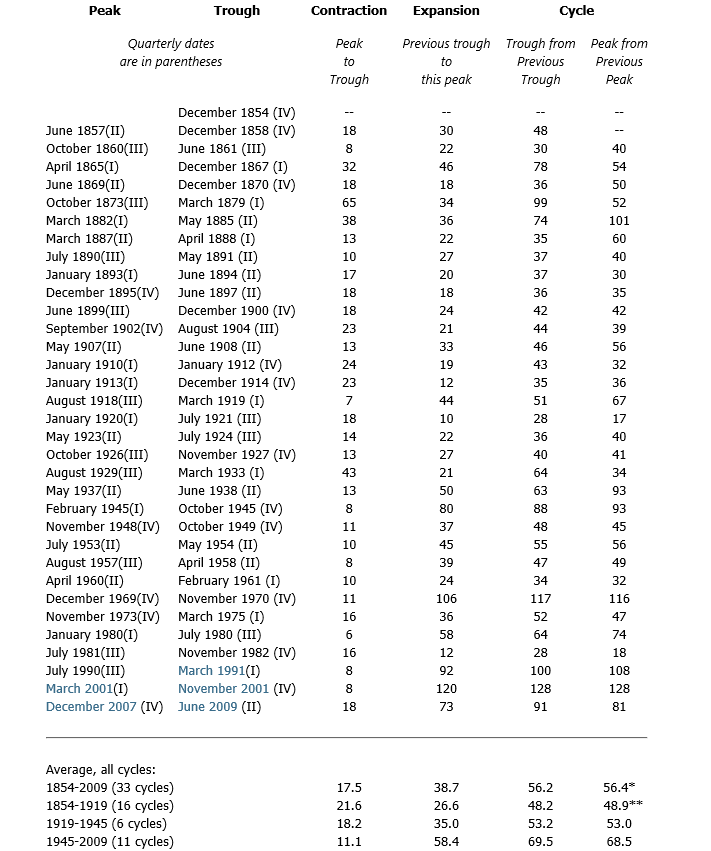
The National Bureau of Economic Research (NBER) has a standing committee which designates the start and finish of recessions, or more precisely, the dates of the peaks and troughs of the US business cycle.

And the NBER site maintains a complete record of the US business cycle, dating back to the middle 1800’s, as shown in the following tables.

NBERbsdates

Periods of contraction, from peak to trough, are typically shorter than periods of expansion – or the movement from previous trough to the next peak.

Since World War II, the average length of the business cycle, variously measured from trough to trough or from peak to peak, is more than 5 years.

Focusing on the current situation, we are interested in the length of time from the previous peak of the business cycle in December 2007 to the next peak. The longest peak to peak period was over the prosperity of the 1990’s, and lasted more than 10 years (128 months).

So, it would be unusual if the peak of this current business cycle were much later than 2017-2018.

In terms of predicting turning points, matters are complicated by the fact that, unlike many European countries, the NBER does not define a recession in terms of two consecutive quarters of decline in real GDP.

Rather, a recession is a significant decline in economic activity spread across the economy, lasting more than a few months, normally visible in real GDP, real income, employment, industrial production, and wholesale-retail sales.

But just predicting the onset of two consecutive quarters of decline in real GDP is challenging. Indeed, the record of macroeconomic forecasting is very poor in this regard.

Part of the problem with the concept of a “cycle” in this context is the irregularity of the fluctuations derived by standard filters and methods.

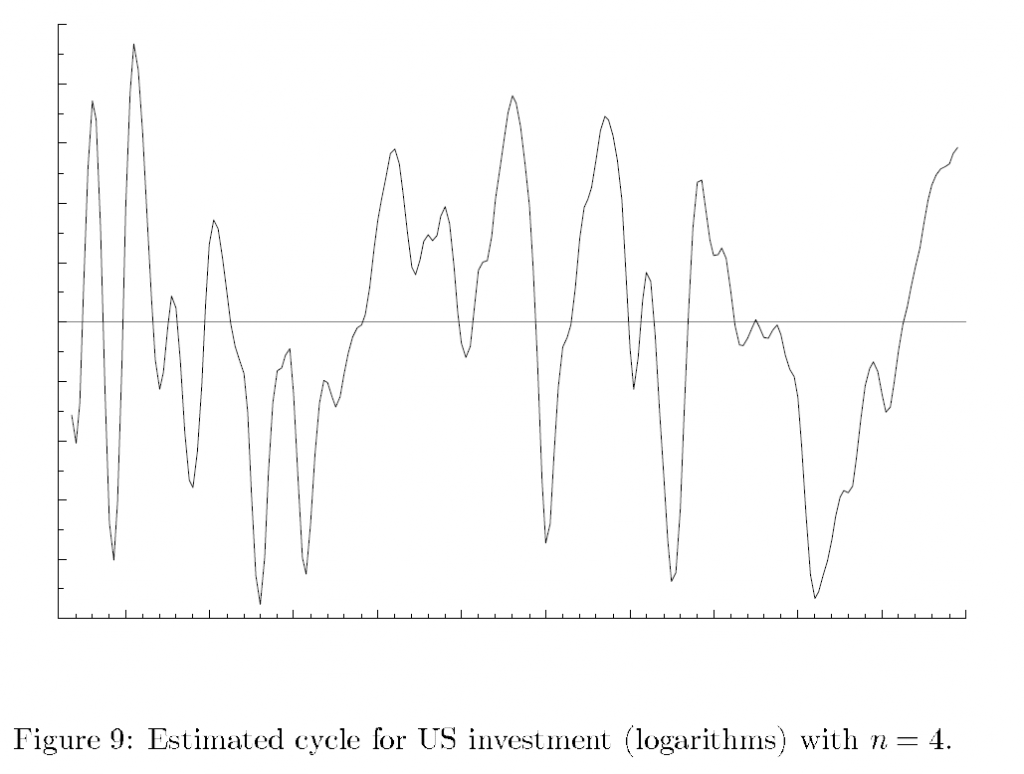
Harvey, for example, applies low band and pass Butterworth filters to US total investment and other macroeconomic series, deriving, at one pont, an investment “cycle” that looks like this.

Invcycle

So almost everything that makes a cycle useful in prediction is missing from this investment cycle. Thus, one cannot conclude that a turning point will occur, when the amplitude of the cycle is reached, since the amplitudes of these quasi-cycles vary considerably. Similarly, the “period” of the cycle is by no means fixed, but is basically stochastic, with a certain variance sometimes expressed as a “hyperparameter.” Only a certain quality of smoothness presents itself, and, of course, is a result of the filtering parameters that are applied.

In my opinion, industry cycles make a certain amount of sense, for particular industries, over particular spans of time. What I mean is that identification of such industry cycles improves predictability of the underlying series – be it sales or inventories or what have you.

The business cycle, on the other hand, is something of a metaphor, or maybe just an evocative phrase.

True, there are periods of economic contraction and periods of expansion.

But the extraction of macroeconomic cycles often does not improve predictability, because the fluctuations so identified are highly irregular from a number of different viewpoints.

I’ve sort of confirmed this is a quantitative sense by applying various cycle-extraction softwares to US real GDP to see whether any product or approach gave a hint that the Great Recession which began in 2008 would (a) occur, and (b) be as dramatic as it was. So far, no go.

And, of course, Ng points out that the Great Recession was fundamentally different than, say, recessions in the 1960’s sand 1970’s in that it was a balance sheet recession.