US Growth Stalls

The US Bureau of Economic Analysis (BEA) announced today that,

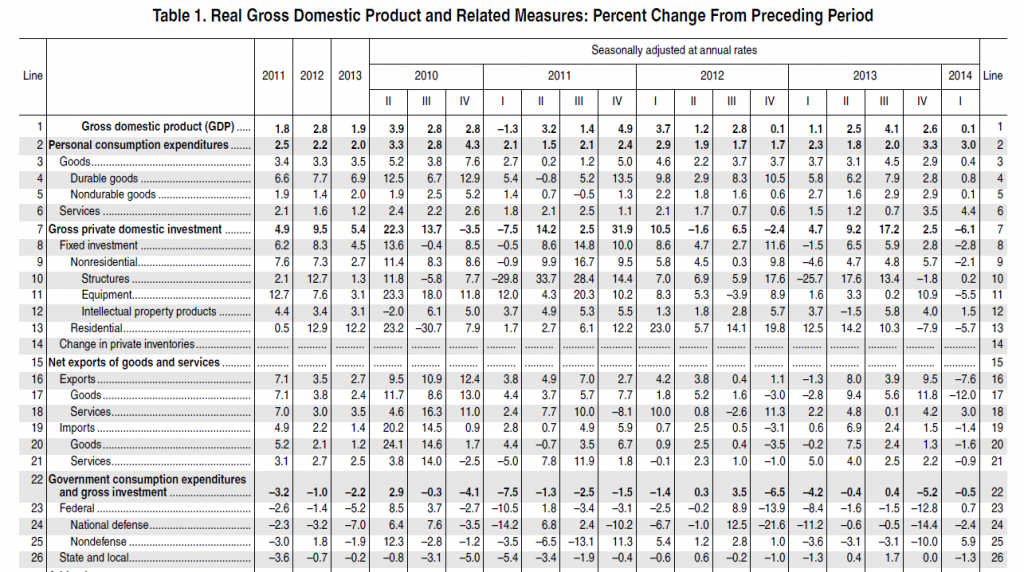
Real gross domestic product — the output of goods and services produced by labor and property located in the United States — increased at an annual rate of 0.1 percent in the first quarter (that is, from the fourth quarter of 2013 to the first quarter of 2014), according to the “advance” estimate released by the Bureau of Economic Analysis.  In the fourth quarter, real GDP increased 2.6 percent.

This flatline growth number is in stark contrast to the median forecast of 83 economists surveyed by Bloomberg, which called for a 1.2 percent increase for the first quarter.

Bloomberg writes in a confusingly titled report – Dow Hits Record as Fed Trims Stimulus as Economy Improves

The pullback in growth came as snow blanketed much of the eastern half of the country, keeping shoppers from stores, preventing builders from breaking ground and raising costs for companies including United Parcel Service Inc. Another report today showing a surge in regional manufacturing this month adds to data on retail sales, production and employment that signal a rebound is under way as temperatures warm.

Here’s is the BEA table of real GDP, along with the advanced estimates for the first quarter 2014 (click to enlarge).

usgdp

The large negative slump in investment in equipment (-5.5) indicates to me something more is going on than bad weather.

Indeed, Econbrowser notes that,

Both business fixed investment and new home construction fell in the quarter, which would be ominous developments if they’re repeated through the rest of this year. And a big drop in exports reminds us that America is not immune to weakness elsewhere in the world.

Even the 2% growth in consumption spending is not all that encouraging. As Bricklin Dwyer of BNP Paribas noted, 1.1% of that consumption growth– more than half– was attributed to higher household expenditures on health care.

What May Be Happening

I think there is some amount of “happy talk” about the US economy linked to the urgency about reducing Fed bond purchases. So just think of what might happen if the federal funds rate is still at the zero bound when another recession hits. What tools would the Fed have left? Somehow the Fed has to position itself rather quickly for the inevitable swing of the business cycle.

I have wondered, therefore, whether some of the pronouncements recently from the Fed did not have a unrealistic slant.

So, as the Fed unwinds quantitative easing (QE), dropping bond (mortgage-backed securities) purchases to zero, surely there will be further impacts on the housing markets.

Also, China is not there this time to take up the slack.

And it is always good to remember that new employment numbers are basically a lagging indicator of the business cycle.

Let’s hope for a better second and third quarter, and that this flatline growth for the first quarter is a blip.

More on Automatic Forecasting Packages – Autobox Gold Price Forecasts

Yesterday, my post discussed the statistical programming language R and Rob Hyndman’s automatic forecasting package, written in R – facts about this program, how to download it, and an application to gold prices.

In passing, I said I liked Hyndman’s disclosure of his methods in his R package and “contrasted” that with leading competitors in the automatic forecasting market space –notably Forecast Pro and Autobox.

This roused Tom Reilly, currently Senior Vice-President and CEO of Automatic Forecast Systems – the company behind Autobox.

62_tom

Reilly, shown above, wrote  –

You say that Autobox doesn’t disclose its methods.  I think that this statement is unfair to Autobox.  SAS tried this (Mike Gilliland) on the cover of his book showing something purporting to a black box.  We are a white box.  I just downloaded the GOLD prices and recreated the problem and ran it. If you open details.htm it walks you through all the steps of the modeling process.  Take a look and let me know your thoughts.  Much appreciated!

AutoBox Gold Price Forecast

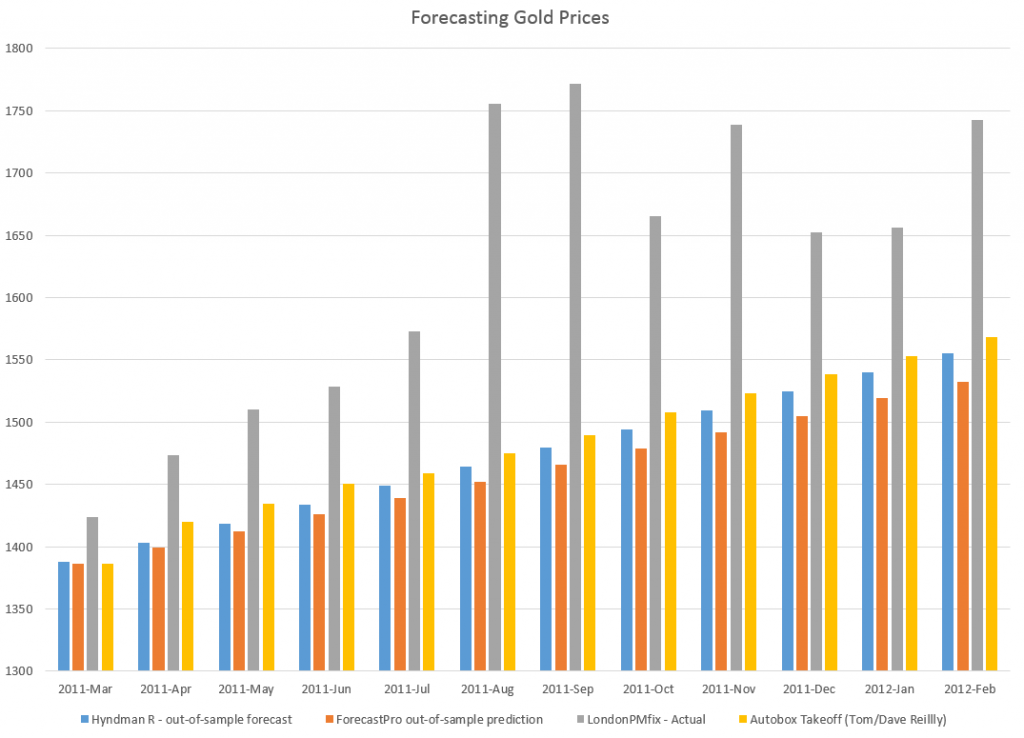
First, disregarding the issue of transparency for a moment, let’s look at a comparison of forecasts for this monthly gold price series (London PM fix).

A picture tells the story (click to enlarge).

ABFPHcomp

So, for this data, 2007 to early 2011, Autobox dominates. That is, all forecasts are less than the respective actual monthly average gold prices. Thus, being linear, if one forecast method is more inaccurate than another for one month, that method is less accurate than the forecasts generated by this other approach for the entire forecast horizon.

I guess this does not surprise me. Autobox has been a serious contender in the M-competitions, for example, usually running just behind or perhaps just ahead of Forecast Pro, depending on the accuracy metric and forecast horizon. (For a history of these “accuracy contests” see Markridakis and Hibon’s article on M3).

And, of course, this is just one of many possible forecasts that can be developed with this time series, taking off from various ending points in the historic record.

The Issue of Transparency

In connection with all this, I also talked with Dave Reilly, a founding principal of Autobox, shown below.

DaveReilly

Among other things, we went over the “printout” Tom Reilly sent, which details the steps in the estimation of a final time series model to predict these gold prices.

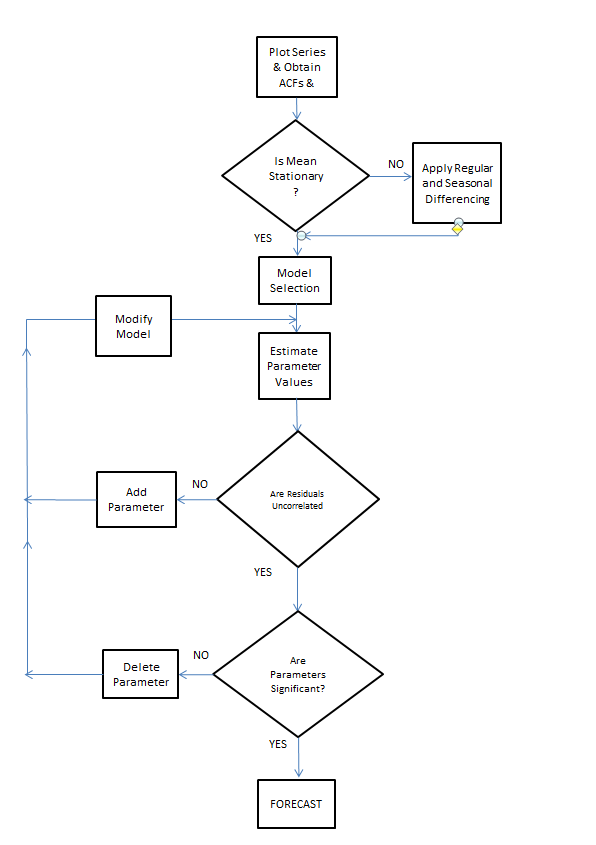
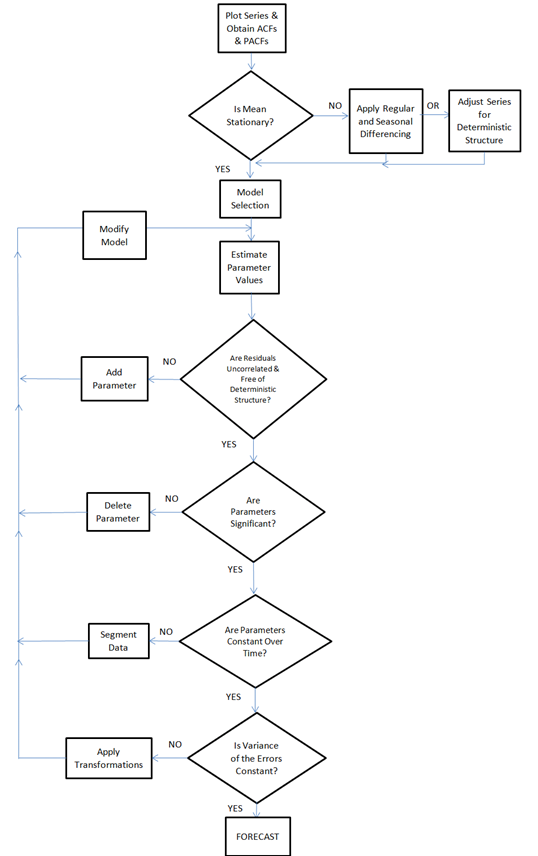
A blog post on the Autobox site is especially pertinent, called Build or Make your own ARIMA forecasting model? This discussion contains two flow charts which describe the process of building a time series model, I reproduce here, by kind permission.

The first provides a plain vanilla description of Box-Jenkins modeling.

Rflowchart1

The second flowchart adds steps revised for additions by Tsay, Tiao, Bell, Reilly & Gregory Chow (ie chow test).

Rflowchart2

Both start with plotting the time series to be analyzed and calculating the autocorrelation and partial autocorrelation functions.

But then additional boxes are added for accounting for and removing “deterministic” elements in the time series and checking for the constancy of parameters over the sample.

The analysis run Tom Reilly sent suggests to me that “deterministic” elements can mean outliers.

Dave Reilly made an interesting point about outliers. He suggested that the true autocorrelation structure can be masked or dampened in the presence of outliers. So the tactic of specifying an intervention variable in the various trial models can facilitate identification of autoregressive lags which otherwise might appear to be statistically not significant.

Really, the point of Autobox model development is to “create an error process free of structure.” That a Dave Reilly quote.

So, bottom line, Autobox’s general methods are well-documented. There is no problem of transparency with respect to the steps in the recommended analysis in the program. True, behind the scenes, comparisons are being made and alternatives are being rejected which do not make it to the printout of results. But you can argue that any commercial software has to keep some kernel of its processes proprietary.

I expect to be writing more about Autobox. It has a good track record in various forecasting competitions and currently has a management team that actively solicits forecasting challenges.

Automatic Forecasting Programs – the Hyndman Forecast Package for R

I finally started learning R.

It’s a vector and matrix-based statistical programming language, a lot like MathWorks Matlab and GAUSS. The great thing is that it is free. I have friends and colleagues who swear by it, so it was on my to-do list.

The more immediate motivation, however, was my interest in Rob Hyndman’s automatic time series forecast package for R, described rather elegantly in an article in the Journal of Statistical Software.

This is worth looking over, even if you don’t have immediate access to R.

Hyndman and Exponential Smoothing

Hyndman, along with several others, put the final touches on a classification of exponential smoothing models, based on the state space approach. This facilitates establishing confidence intervals for exponential smoothing forecasts, for one thing, and provides further insight into the modeling options.

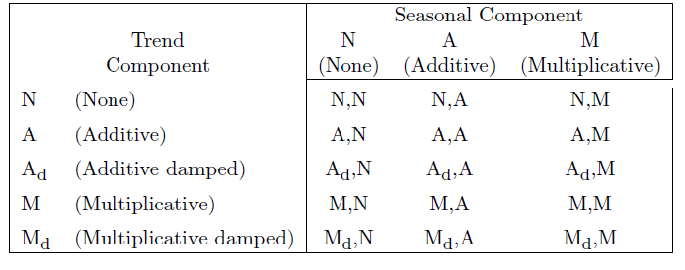
There are, for example, 15 widely acknowledged exponential smoothing methods, based on whether trend and seasonal components, if present, are additive or multiplicative, and also whether any trend is damped.

15expmethods

When either additive or multiplicative error processes are added to these models in a state space framewoprk, the number of modeling possibilities rises from 15 to 30.

One thing the Hyndman R Package does is run all the relevant models from this superset on any time series provided by the user, picking a recommended model for use in forecasting with the Aikaike information criterion.

Hyndman and Khandakar comment,

Forecast accuracy measures such as mean squared error (MSE) can be used for selecting a model for a given set of data, provided the errors are computed from data in a hold-out set and not from the same data as were used for model estimation. However, there are often too few out-of-sample errors to draw reliable conclusions. Consequently, a penalized method based on the in-sample  t is usually better.One such approach uses a penalized likelihood such as Akaike’s Information Criterion… We select the model that minimizes the AIC amongst all of the models that are appropriate for the data.

Interestingly,

The AIC also provides a method for selecting between the additive and multiplicative error models. The point forecasts from the two models are identical so that standard forecast accuracy measures such as the MSE or mean absolute percentage error (MAPE) are unable to select between the error types. The AIC is able to select between the error types because it is based on likelihood rather than one-step forecasts.

So the automatic forecasting algorithm, involves the following steps:

1. For each series, apply all models that are appropriate, optimizing the parameters (both smoothing parameters and the initial state variable) of the model in each case.

2. Select the best of the models according to the AIC.

3. Produce point forecasts using the best model (with optimized parameters) for as many steps ahead as required.

4. Obtain prediction intervals for the best model either using the analytical results of Hyndman et al. (2005b), or by simulating future sample paths..

This package also includes an automatic forecast module for ARIMA time series modeling.

One thing I like about Hyndman’s approach is his disclosure of methods. This, of course, is in contrast with leading competitors in the automatic forecasting market space –notably Forecast Pro and Autobox.

Certainly, go to Rob J Hyndman’s blog and website to look over the talk (with slides) Automatic time series forecasting. Hyndman’s blog, mentioned previously in the post on bagging time series, is a must-read for statisticians and data analysts.

Quick Implementation of the Hyndman R Package and a Test

But what about using this package?

Well, first you have to install R on your computer. This is pretty straight-forward, with the latest versions of the program available at the CRAN site. I downloaded it to a machine using Windows 8 as the OS. I downloaded both the 32 and 64-bit versions, just to cover my bases.

Then, it turns out that, when you launch R, a simple menu comes up with seven options, and a set of icons underneath. Below that there is the work area.

Go to the “Packages” menu option. Scroll down until you come on “forecast” and load that.

That’s the Hyndman Forecast Package for R.

So now you are ready to go, but, of course, you need to learn a little bit of R.

You can learn a lot by implementing code from the documentation for the Hyndman R package. The version corresponding to the R file that can currently be downloaded is at

http://cran.r-project.org/web/packages/forecast/forecast.pdf

Here are some general tutorials:

http://cran.r-project.org/doc/contrib/Verzani-SimpleR.pdf

http://cyclismo.org/tutorial/R/

http://cran.r-project.org/doc/manuals/R-intro.html#Simple-manipulations-numbers-and-vectors

http://www.statmethods.net/

And here is a discussion of how to import data into R and then convert it to a time series – which you will need to do for the Hyndman package.

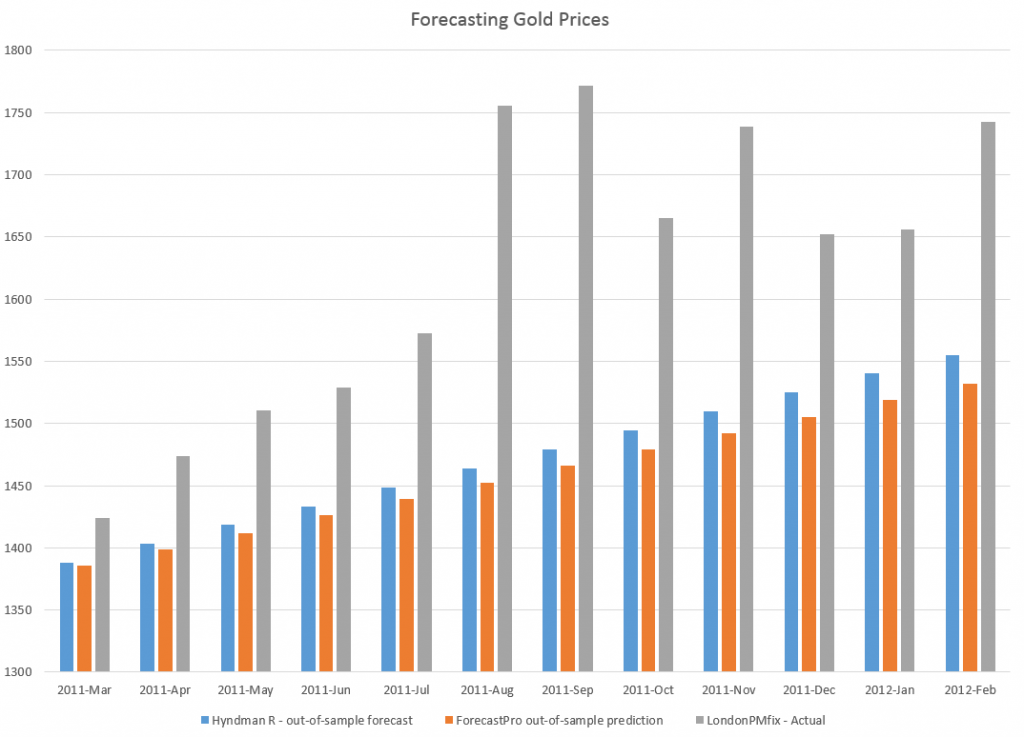
I used the exponential smoothing module to forecast monthly averages from London gold PM fix price series, comparing the results with a ForecastPro run. I utilized data from 2007 to February 2011 as a training sample, and produced forecasts for the next twelve months with both programs.

The Hyndman R package and exponential smoothing module outperformed Forecast Pro in this instance, as the following chart shows.

RFPcomp

Another positive about the R package is it is possible to write code to produce a whole number of such out-of-sample forecasts to get an idea of how the module works with a time series under different regimes, e.g. recession, business recovery.

I’m still caging together the knowledge to put programs like that together and appropriately save results.

But, my introduction to this automatic forecasting package and to R has been positive thus far.

Links – April 26, 2014

These Links help orient forecasting for companies and markets. I pay particular attention to IT developments. Climate change is another focus, since it is, as yet, not fully incorporated in most longer run strategic plans. Then, primary global markets, like China or the Eurozone, are important. I usually also include something on data science, predictive analytics methods, or developments in economics. Today, I include an amazing YouTube of an ape lighting a fire with matches.

China

Xinhua Insight: Property bubble will not wreck China’s economy

Information Technology (IT)

Thoughts on Amazon earnings for Q1 2014

Amazon

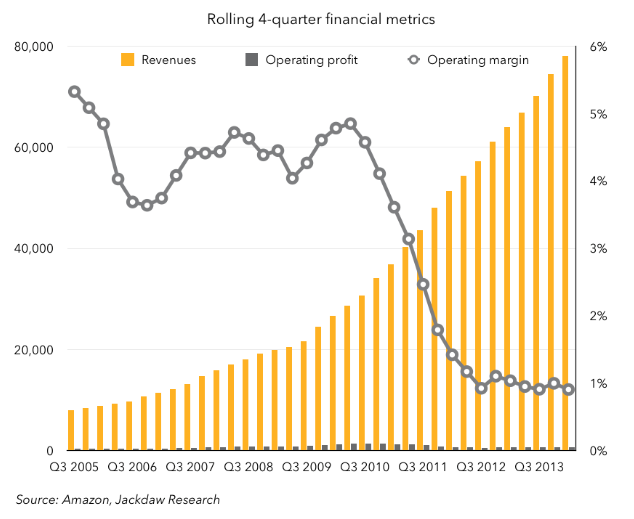
This chart perfectly captures Amazon’s current strategy: very high growth at 1% operating margins, with the low margins caused by massive investment in the infrastructure necessary to drive growth. It very much feels as though Amazon recognizes that there’s a limited window of opportunity for it to build the sort of scale and infrastructure necessary to dominate e-commerce before anyone else does, and it’s scraping by with minimal margins in order to capture as much as possible of that opportunity before it closes.

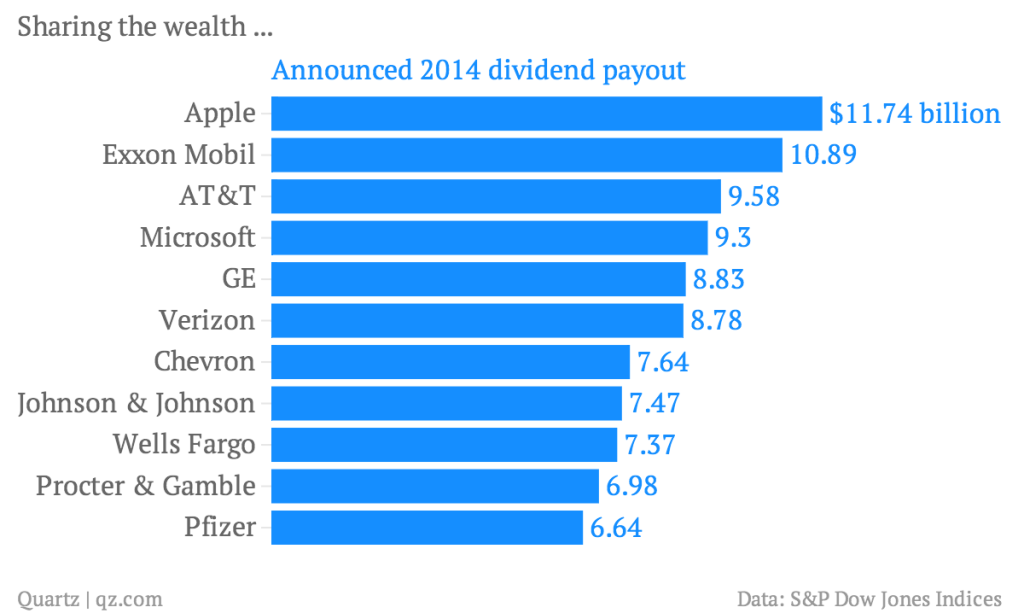
Apple just became the world’s biggest-dividend stock

Apple

The Disruptive Potential of Artificial Intelligence Applications Interesting discussion of vertical search, virtual assistants, and online product recommendations.

Hi-tech giants eschew corporate R&D, says report

..the days of these corporate “idea factories” are over according to a new study published by the American Institute of Physics (AIP). Entitled Physics Entrepreneurship and Innovation (PDF), the 308-page report argues that many large businesses are closing in-house research facilities and instead buying in new expertise and technologies by acquiring hi-tech start-ups.

Climate Change

Commodity Investors Brace for El Niño

Commodities investors are bracing themselves for the ever-growing possibility for the occurrence of a weather phenomenon known as El Niño by mid-year which threatens to play havoc with commodities markets ranging from cocoa to zinc.

The El Niño phenomenon, which tends to occur every 3-6 years, is associated with above-average water temperatures in the central and eastern Pacific and can, in its worst form, bring drought to West Africa (the world’s largest cocoa producing region), less rainfall to India during its vital Monsoon season and drier conditions for the cultivation of crops in Australia.

Economics

Researchers Tested The ‘Gambler’s Fallacy’ On Real-Life Gamblers And Stumbled Upon An Amazing Realization I love this stuff. I always think of my poker group.

..gamblers appear to be behaving as though they believe in the gambler’s fallacy, that winning or losing a bunch of bets in a row means that the next bet is more likely to go the other way. Their reactions to that belief — with winners taking safer bets under the assumption they’re going to lose and losers taking long-shot bets believing their luck is about to change — lead to the opposite effect of making the streaks longer

Foreign Affairs Focus on Books: Thomas Piketty on Economic Inequality


Is the U.S. Shale Boom Going Bust?

Among drilling critics and the press, contentious talk of a “shale bubble” and the threat of a sudden collapse of America’s oil and gas boom have been percolating for some time. While the most dire of these warnings are probably overstated, a host of geological and economic realities increasingly suggest that the party might not last as long as most Americans think.

Apes Can Definitely Use Tools

Bonobo Or Boy Scout? Great Ape Lights Fire, Roasts Marshmallows


Forecasting Controversies – Impacts of QE

Where there is smoke, there is fire, and other similar adages are suggested by an arcane statistical controversy over quantitative easing (QE) by the US Federal Reserve Bank.

Some say this Fed policy, estimated to have involved $3.7 trillion dollars in asset purchases, has been a bust, a huge waste of money, a give-away program to speculators, but of no real consequence to Main Street.

Others credit QE as the main force behind lower long term interest rates, which have supported US housing markets.

Into the fray jump two elite econometricians – Johnathan Wright of Johns Hopkins and Christopher Neeley, Vice President of the St. Louis Federal Reserve Bank.

The controversy provides an ersatz primer in estimation and forecasting issues with VAR’s (vector autoregressions). I’m not going to draw out all the nuances, but highlight the main features of the argument.

The Effect of QE Announcements From the Fed Are Transitory – Lasting Maybe Two or Three Months

Basically, there is the VAR (vector autoregression) analysis of Johnathan Wright of Johns Hopkins Univeristy, which finds that  –

..stimulative monetary policy shocks lower Treasury and corporate bond yields, but the effects die o¤ fairly fast, with an estimated half-life of about two months.

This is in a paper What does Monetary Policy do to Long-Term Interest Rates at the Zero Lower Bound? made available in PDF format dated May 2012.

More specifically, Wright finds that

Over the period since November 2008, I estimate that monetary policy shocks have a significant effect on ten-year yields and long-maturity corporate bond yields that wear o¤ over the next few months. The effect on two-year Treasury yields is very small. The initial effect on corporate bond yields is a bit more than half as large as the effect on ten-year Treasury yields. This finding is important as it shows that the news about purchases of Treasury securities had effects that were not limited to the Treasury yield curve. That is, the monetary policy shocks not only impacted Treasury rates, but were also transmitted to private yields which have a more direct bearing on economic activity. There is slight evidence of a rotation in breakeven rates from Treasury Inflation Protected Securities (TIPS), with short-term breakevens rising and long-term forward breakevens falling.

Not So, Says A Federal Reserve Vice-President

Christopher Neeley at the St. Louis Federal Reserve argues Wright’s VAR system is unstable and has poor performance in out-of-sample predictions. Hence, Wright’s conclusions cannot be accepted, and, furthermore, that there are good reasons to believe that QE has had longer term impacts than a couple of months, although these become more uncertain at longer horizons.

ChristopherNeely

Neeley’s retort is in a Federal Reserve working paper How Persistent are Monetary Policy Effects at the Zero Lower Bound?

A key passage is the following:

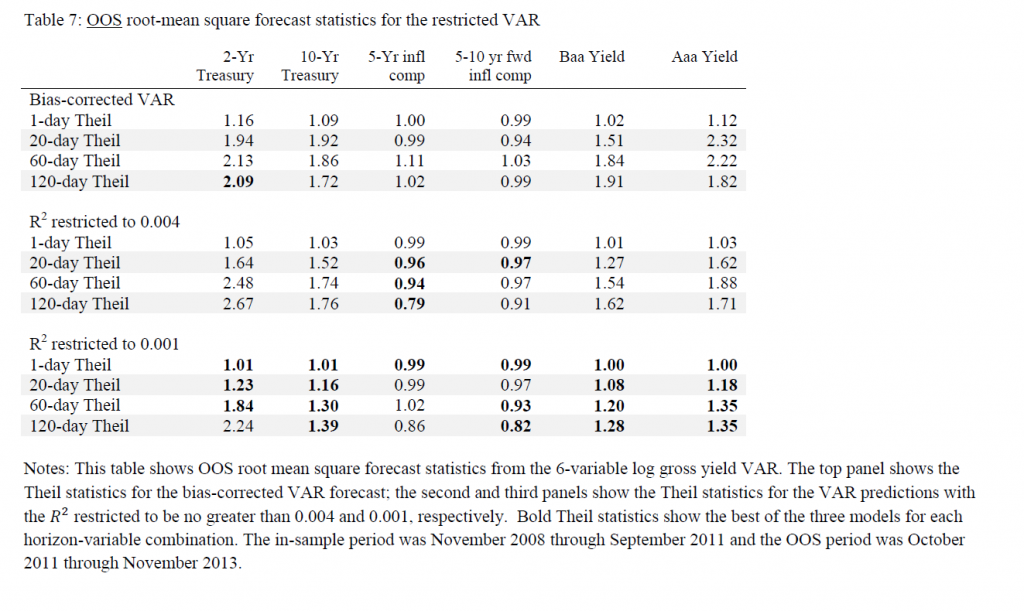
Specifically, although Wright’s VAR forecasts well in sample, it forecasts very poorly out-of-sample and fails structural stability tests. The instability of the VAR coefficients imply that any conclusions about the persistence of shocks are unreliable. In contrast, a naïve, no-change model out-predicts the unrestricted VAR coefficients. This suggests that a high degree of persistence is more plausible than the transience implied by Wright’s VAR. In addition to showing that the VAR system is unstable, this paper argues that transient policy effects are inconsistent with standard thinking about risk-aversion and efficient markets. That is, the transient effects estimated by Wright would create an opportunity for risk-adjusted  expected returns that greatly exceed values that are consistent with plausible risk aversion. Restricted VAR models that are consistent with reasonable risk aversion and rational asset pricing, however, forecast better than unrestricted VAR models and imply a more plausible structure. Even these restricted models, however, do not outperform naïve models OOS. Thus, the evidence supports the view that unconventional monetary policy shocks probably have fairly persistent effects on long yields but we cannot tell exactly how persistent and our uncertainty about the effects of shocks grows with the forecast horizon.

And, it’s telling, probably, that Neeley attempts to replicate Wright’s estimation of a VAR with the same data, checking the parameters, and then conducting additional tests to show that this model cannot be trusted – it’s unstable.

Pretty serious stuff.

Neeley gets some mileage out of research he conducted at the end of the 1990’s in Predictability in International Asset Returns: A Re-examination where he again called into question the longer term forecasting capability of VAR models, given their instabilities.

What is a VAR model?

We really can’t just highlight this controversy without saying a few words about VAR models.

A simple autoregressive relationship for a time series yt can be written as

yt = a1yt-1+..+anyt-n + et

Now if we have other variables (wt, zt..) and we write yt and all these other variables as equations in which the current values of these variables are functions of lagged values of all the variables.

The matrix notation is somewhat hairy, but that is a VAR. It is a system of autoregressive equations, where each variable is expressed as a linear sum of lagged terms of all the other variables.

One of the consequences of setting up a VAR is there are lots of parameters to estimate. So if p lags are important for each of three variables, each equation contains 3p parameters to estimate, so altogether you need to estimate 9p parameters – unless it is reasonable to impose certain restrictions.

Another implication is that there can be reduced form expressions for each of the variables – written only in terms of their own lagged values. This, in turn, suggests construction of impulse-response functions to see how effects propagate down the line.

Additionally, there is a whole history of Bayesian VAR’s, especially associated with the Minneapolis Federal Reserve and the University of Minnesota.

My impression is that, ultimately, VAR’s were big in the 1990’s, but did not live up to their expectations, in terms of macroeconomic forecasting. They gave way after 2000 to the Stock and Watson type of factor models. More variables could be encompassed in factor models than VAR’s, for one thing. Also, factor models often beat the naïve benchmark, while VAR’s frequently did not, at least out-of-sample.

The Naïve Benchmark

The naïve benchmark is a martingale, which often boils down to a simple random walk. The best forecast for the next period value of a martingale is the current period value.

This is the benchmark which Neeley shows the VAR model does not beat, generally speaking, in out-of-sample applications.

Naive

When the ratio is 1 or greater, this means that the mean square forecast error of the VAR is greater than the benchmark model.

Reflections

There are many fascinating details of these papers I am not highlighting. As an old Republican Congressman once said, “a billion here and a billion there, and pretty soon you are spending real money.”

So the defense of QE in this instance boils down to invalidating an analysis which suggests the impacts of QE are transitory, lasting a few months.

There is no proof, however, that QE has imparted lasting impacts on long term interest rates developed in this relatively recent research.

The Future, Technology, Hacking, Surveillance

And now for something completely different.

As something of a technologist – at one time one of the few economists working directly in IT – I have this problem with revelations about surveillance of US citizens and the loss of privacy, threats from hacking, and so forth.

I basically believe that if something is technically possible, it will be done – somewhere, sometime.

So we can’t put the nuclear genie back in the box.

Similarly, I do not think that the full scope of bioengineering in the future is being considered or discussed. Science fiction is a better guide to the future, than are the usual sober discussions.

So when it comes to surveillance, security logic interfaces with almost limitless technical potential. “If we get all the cell phone data, we might find something that would save a city from a dirty bomb (or name your other threat).” Furthermore, with server farms and new storage capability, new encryption, it is technically possible to collect everything. So, “until that pesky Senator figures out this whole IT infrastructure (paid for out of black budget items), we’re just going to do it.”

So there you have it. The motives are to protect and to maintain standards of security we are used to. Of course, this entire system might be subverted to sinister purposes by a demagogue at some future time. “Sorry – no technical fix for that problem. But what the hey, we’re all good guys and regular gals and fellows here, eh?”

I find this discussion on Inventing the Future (on CoolTechNews) outstanding, well worth an hour or so. It’s easy to watch, as you get into it.

Obviously, there are going to be efforts to counter these invasions, even this annihilation, of privacy. For example, in England, listening in on the cell phone conversations of members of the Royal family is proving problematic to the Murdoch media combine. I wonder, too, whether Bill Gates appreciates having all his communications monitored by nameless persons and parties, despite his apparent support in a recent Rolling Stones interview.

But what about the privacy of business discussions? There’s got to be some pushback here, since there are moments in a negotiation or in putting together a takeover strategy, when leaking the mindset and details of one party could derail their efforts entirely.

So it seems to me that, in some sense, free market capitalism actually requires an envelope of privacy in dealings at some point. Otherwise, everything is reduced to a kind of level playing field.

So I do expect pushback to the surveillance society. Maybe new encryption systems, or an enclave concept – places or locales which are surveillance-free.

The Interest Elasticity of Housing Demand

What we really want to know, in terms of real estate market projections, is the current or effective interest elasticity of home sales.

So, given that the US Federal Reserve has embarked on the “taper,” we know long term interest rates will rise (and have since the end of 2012).

What, then, is the likely impact of moving the 30 year fixed mortgage rate from around 4 percent back to its historic level of six percent or higher?

What is an Interest Elasticity?

Recall that the concept of a demand elasticity here is the percentage change in demand – this case housing sales, divided by the percentage change in the mortgage interest rate.

Typically, thus, the interest elasticity of housing demand is a negative number, indicating that higher interest rates result in lower housing demand, other things being equal.

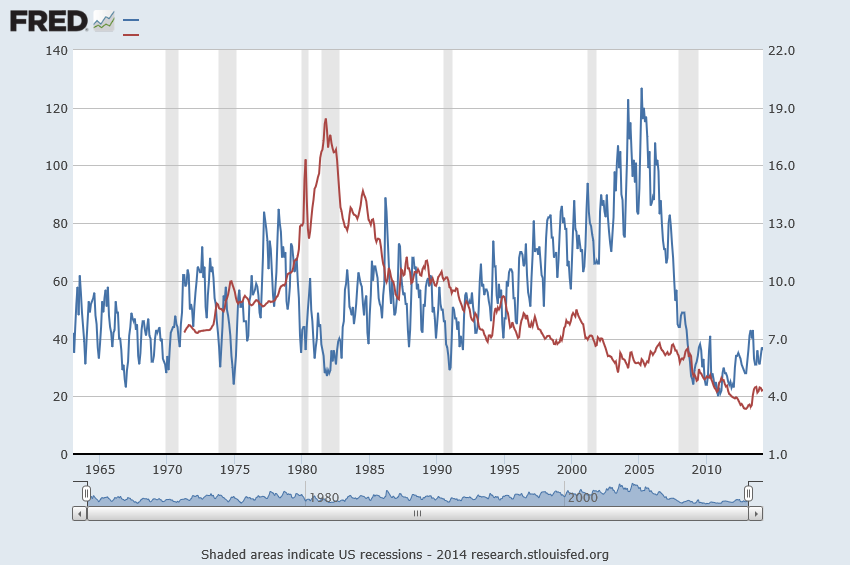
This “other things being equal” (ceteris paribus) is the hooker, of course, as is suggested by the following chart from FRED.

30mortsale

Here the red line is the 30 year fixed mortgage rate (right vertical axis) and the blue line is housing sales (left vertical axis).

A Rough and Ready Interest Rate Elasticity

Now the thing that jumps out at you when you glance over these two curves is the way housing sales (the blue line) drops when the 30 year fixed mortgage rate went through the roof in about 1982, reaching a peak of nearly 20 percent.

After the rates came down again in about 1985, an approximately 20 year period of declining mortgage interest rates ensued – certainly with bobbles and blips in this trend.

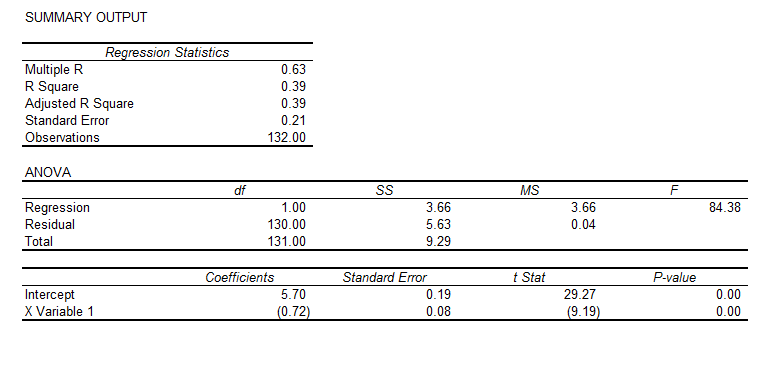
Now suppose we take just the period 1975-85, and calculate a simple interest rate elasticity. This involves getting the raw numbers behind these lines on the chart, and taking log transformations of them. We calculate the regression,

interestelasticityregThis corresponds to the equation,

ln(sales)=   5.7   –   0.72*ln(r)

where the t-statistics of the constant term and coefficient of the log of the interest rate r are highly significant, statistically.

This equation implies that the interest elasticity of housing sales in this period is -0.72. So a 10 percent increase in the 30-year fixed mortgage rate is associated with an about 7 percent reduction in housing sales, other things being equal.

In the spirit of heroic generalization, let’s test this elasticity by looking at the reduction in the mortgage rate after 1985 to 2005, and compare this percent change with the change in the housing sales over this period.

So at the beginning of 1986, the mortgage rate was 10.8 and sales were running 55,000 per month. At the end of 2005, sales had risen to 87, 000 per month and the 30 year mortgage rate for December was 6.27.

So the mortgage interest rates fell by 53 percent and housing sales rose 45 percent – calculating these percentage changes over the average base of the interest rates and house sales. Applying a -0.72 price elasticity to the (negative) percent change in interest rates suggests an increase in housing sales of 38 percent.

That’s quite remarkable, considering other factors operative in this period, such as consistent population growth.

OK, so looking ahead, if the 30 year fixed mortgage rate rises 33 percent to around 6 percent, housing sales could be expected to drop around 20-25 percent.

Interestingly, recent research conducted at the Wharton School and the Board of Governors of the Federal Reserve suggests that,

The relationship between the mortgage interest rate and a household’s demand for mortgage debt has important implications for a host of public policy questions. In this paper, we use detailed data on over 2.7 million mortgages to provide novel estimates of the interest rate elasticity of mortgage demand. Our empirical strategy exploits a discrete jump in interest rates generated by the conforming loan limit|the maximum loan size eligible for securitization by Fannie Mae and Freddie Mac. This discontinuity creates a large notch” in the intertemporal budget constraint of prospective mortgage borrowers, allowing us to identify the causal link between interest rates and mortgage demand by measuring the extent to which loan amounts bunch at the conforming limit. Under our preferred specifications, we estimate that 1 percentage point increase in the rate on a 30-year fixed-rate mortgage reduces first mortgage demand by between 2 and 3 percent. We also present evidence that about one third of the response is driven by borrowers who take out second mortgages while leaving their total mortgage balance unchanged. Accounting for these borrowers suggests a reduction in total mortgage debt of between 1.5 and 2 percent per percentage point increase in the interest rate. Using these estimates, we predict the changes in mortgage demand implied by past and proposed future increases to the guarantee fees charged by Fannie and Freddie. We conclude that these increases would directly reduce the dollar volume of new mortgage originations by well under 1 percent.

So a 33 percent increase in the 30 year fixed mortgage rate, according to this analysis, would reduce mortgage demand by well under 33 percent. So how about 20-25 percent?

I offer this “take-off” as an example of an exploratory analysis. Thus, the elasticity estimate developed with data from the period of greatest change in rates provides a ballpark estimate of the change in sales over a longer period of downward trending interest rates. This supports a forward projection, which, at a first order approximation seem consistent with estimates from a completely different line of analysis.

All this suggests a more comprehensive analysis might be warranted, taking into account population growth, inflation, and, possibly, other factors.

The marvels of applied economics in a forecasting context.

Lead picture courtesy of the University of Maryland Department of Economics.

Forecasting Housing Markets – 3

Maybe I jumped to conclusions yesterday. Maybe, in fact, a retrospective analysis of the collapse in US housing prices in the recent 2008-2010 recession has been accomplished – but by major metropolitan area.

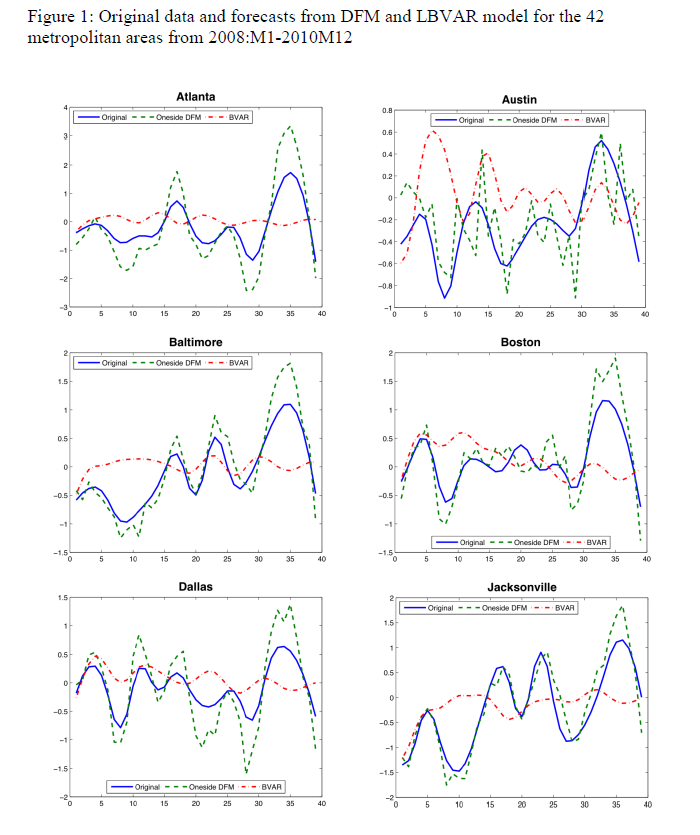
The Yarui Li and David Leatham paper Forecasting Housing Prices: Dynamic Factor Model versus LBVAR Model focuses on out-of-sample forecasts for house price indices for 42 metropolitan areas. Forecast models are built with data from 1980:01 to 2007:12. These models – dynamic factor and Large-scale Bayesian Vector Autoregressive (LBVAR) models – are used to generate forecasts of the one- to twelve- months ahead price growth 2008:01 to 2010:12.

Judging from the graphics and other information, the dynamic factor model (DFM) produces impressive results.

For example, here are out-of-sample forecasts of the monthly growth of housing prices (click to enlarge).

DFMhousing

The house price indices for the 42 metropolitan areas are from the Office of Federal Housing Enterprise Oversight (OFEO). The data for macroeconomic indicators in the dynamic factor and VAR models are from the DRI/McGraw Hill Basic Economics Database provided by IHS Global Insight.

I have seen forecasting models using Internet search activity which purportedly capture turning points in housing price series, but this is something different.

The claim here is that calculating dynamic or generalized principal components of some 141 macroeconomic time series can lead to forecasting models which accurately capture fluctuations in cumulative growth rates of metropolitan house price indices over a forecasting horizon of up to 12 months.

That’s pretty startling, and I for one would like to see further output of such models by city.

But where is the publication of the final paper? The PDF file linked above was presented at the Agricultural & Applied Economics Association’s 2011 Annual Meeting in Pittsburgh, Pennsylvania, July, 2011. A search under both authors does not turn up a final publication in a refereed journal, but does indicate there is great interest in this research. The presentation paper thus is available from quite a number of different sources which obligingly archive it.

Yarui

Currently, the lead author, Yarui Li, Is a Decision Tech Analyst at JPMorgan Chase, according to LinkedIn, having received her PhD from Texas A&M University in 2013. The second author is Professor at Texas A&M, most recently publishing on VAR models applied to business failure in the US.

Dynamic Principal Components

It may be that dynamic principal components are the new ingredient accounting for an uncanny capability to identify turning points in these dynamic factor model forecasts.

The key research is associated with Forni and others, who originally documented dynamic factor models in the Review of Economics and Statistics in 2000. Subsequently, there have been two further publications by Forni on this topic:

Do financial variables help forecasting inflation and real activity in the euro area?

The Generalized Dynamic Factor Model, One Sided Estimation and Forecasting

Forni and associates present this method of dynamic prinicipal componets as an alternative to the Stock and Watson factor models based on many predictors – an alternative with superior forecasting performance.

Run-of-the-mill standard principal components are, according to Li and Leatham, based on contemporaneous covariances only. So they fail to exploit the potentially crucial information contained in the leading-lagging relations between the elements of the panel.

By contrast, the Forni dynamic component approach is used in this housing price study to

obtain estimates of common and idiosyncratic variance-covariance matrices at all leads and lags as inverse Fourier transforms of the corresponding estimated spectral density matrices, and thus overcome(s)[ing] the limitation of static PCA.

There is no question but that any further discussion of this technique must go into high mathematical dudgeon, so I leave that to another time, when I have had an opportunity to make computations of my own.

However, I will say that my explorations with forecasting principal components last year have led to me to wonder whether, in fact, it may be possible to pull out some turning points from factor models based on large panels of macroeconomic data.

Forecasting Housing Markets – 2

I am interested in business forecasting “stories.” For example, the glitch in Google’s flu forecasting program.

In real estate forecasting, the obvious thing is whether quantitative forecasting models can (or, better yet, did) forecast the collapse in housing prices and starts in the recent 2008-2010 recession (see graphics from the previous post).

There are several ways of going at this.

Who Saw The Housing Bubble Coming?

One is to look back to see whether anyone saw the bursting of the housing bubble coming and what forecasting models they were consulting.

That’s entertaining. Some people, like Ron Paul, and Nouriel Roubini, were prescient.

Roubini earned the soubriquet Dr. Doom for an early prediction of housing market collapse, as reported by the New York Times:

On Sept. 7, 2006, Nouriel Roubini, an economics professor at New York University, stood before an audience of economists at the International Monetary Fund and announced that a crisis was brewing. In the coming months and years, he warned, the United States was likely to face a once-in-a-lifetime housing bust, an oil shock, sharply declining consumer confidence and, ultimately, a deep recession. He laid out a bleak sequence of events: homeowners defaulting on mortgages, trillions of dollars of mortgage-backed securities unraveling worldwide and the global financial system shuddering to a halt. These developments, he went on, could cripple or destroy hedge funds, investment banks and other major financial institutions like Fannie Mae and Freddie Mac.

NR

Roubini was spot-on, of course, even though, at the time, jokes circulated such as “even a broken clock is right twice a day.” And my guess is his forecasting model, so to speak, is presented in Crisis Economics: A Crash Course in the Future of Finance, his 2010 book with Stephen Mihm. It is less a model than whole database of tendencies, institutional facts, areas in which Roubini correctly identifies moral hazard.

I think Ron Paul, whose projections of collapse came earlier (2003), was operating from some type of libertarian economic model.  So Paul testified before House Financial Services Committee on Fannie Mae and Freddy Mac, that –

Ironically, by transferring the risk of a widespread mortgage default, the government increases the likelihood of a painful crash in the housing market,” Paul predicted. “This is because the special privileges granted to Fannie and Freddie have distorted the housing market by allowing them to attract capital they could not attract under pure market conditions. As a result, capital is diverted from its most productive use into housing. This reduces the efficacy of the entire market and thus reduces the standard of living of all Americans.

On the other hand, there is Ben Bernanke, who in a CNBC interview in 2005 said:

7/1/05 – Interview on CNBC 

INTERVIEWER: Ben, there’s been a lot of talk about a housing bubble, particularly, you know [inaudible] from all sorts of places. Can you give us your view as to whether or not there is a housing bubble out there?

BERNANKE: Well, unquestionably, housing prices are up quite a bit; I think it’s important to note that fundamentals are also very strong. We’ve got a growing economy, jobs, incomes. We’ve got very low mortgage rates. We’ve got demographics supporting housing growth. We’ve got restricted supply in some places. So it’s certainly understandable that prices would go up some. I don’t know whether prices are exactly where they should be, but I think it’s fair to say that much of what’s happened is supported by the strength of the economy.

Bernanke was backed by one of the most far-reaching economic data collection and analysis operations in the United States, since he was in 2005 a member of the Board of Governors of the Federal Reserve System and Chairman of the President’s Council of Economic Advisors.

So that’s kind of how it is. Outsiders, like Roubini and perhaps Paul, make the correct call, but highly respected and well-placed insiders like Bernanke simply cannot interpret the data at their fingertips to suggest that a massive bubble was underway.

I think it is interesting currently that Roubini, in March, promoted the idea that Yellen Is Creating another huge Bubble in the Economy

But What Are the Quantitative Models For Forecasting the Housing Market?

In a long article in the New York Times in 2009, How Did Economists Get It So Wrong?, Paul Krugman lays the problem at the feet of the efficient market hypothesis –

When it comes to the all-too-human problem of recessions and depressions, economists need to abandon the neat but wrong solution of assuming that everyone is rational and markets work perfectly.

Along these lines, it is interesting that the Zillow home value forecast methodology builds on research which, in one set of models, assumes serial correlation and mean reversion to a long-term price trend.

Zillow

Key research in housing market dynamics includes Case and Shiller (1989) and Capozza et al (2004), who show that the housing market is not efficient and house prices exhibit strong serial correlation and mean reversion, where large market swings are usually followed by reversals to the unobserved fundamental price levels.

Based on the estimated model parameters, Capozza et al are able to reveal the housing market characteristics where serial correlation, mean reversion, and oscillatory, convergent, or divergent trends can be derived from the model parameters.

Here is an abstract from critical research underlying this approach done in 2004.

An Anatomy of Price Dynamics in Illiquid Markets: Analysis and Evidence from Local Housing Markets

This research analyzes the dynamic properties of the difference equation that arises when markets exhibit serial correlation and mean reversion. We identify the correlation and reversion parameters for which prices will overshoot equilibrium (“cycles”) and/or diverge permanently from equilibrium. We then estimate the serial correlation and mean reversion coefficients from a large panel data set of 62 metro areas from 1979 to 1995 conditional on a set of economic variables that proxy for information costs, supply costs and expectations. Serial correlation is higher in metro areas with higher real incomes, population growth and real construction costs. Mean reversion is greater in large metro areas and faster growing cities with lower construction costs. The average fitted values for mean reversion and serial correlation lie in the convergent oscillatory region, but specific observations fall in both the damped and oscillatory regions and in both the convergent and divergent regions. Thus, the dynamic properties of housing markets are specific to the given time and location being considered.

The article is not available for free download so far as I can determine. But it is based on earler research, dating back to the later 1990’s in the pdf The Dynamic Structure of Housing Markets.

The more recent Housing Market Dynamics: Evidence of Mean Reversion and Downward Rigidity by Fannie Mae researchers, lists a lot of relevant research on the serial correlation of housing prices, which is usually locality-dependent.

In fact, the Zillow forecasts are based on ensemble methods, combining univariate and multivariate models – a sign of modernity in the era of Big Data.

So far, though, I have not found a truly retrospective study of the housing market collapse, based on quantitative models. Perhaps that is because only the Roubini approach works with such complex global market phenomena.

We are left, thus, with solid theoretical foundations, validated by multiple housing databases over different time periods, that suggests that people invest in housing based on momentum factors – and that this fairly obvious observation can be shown statistically, too.
Real Estate Forecasts – 1

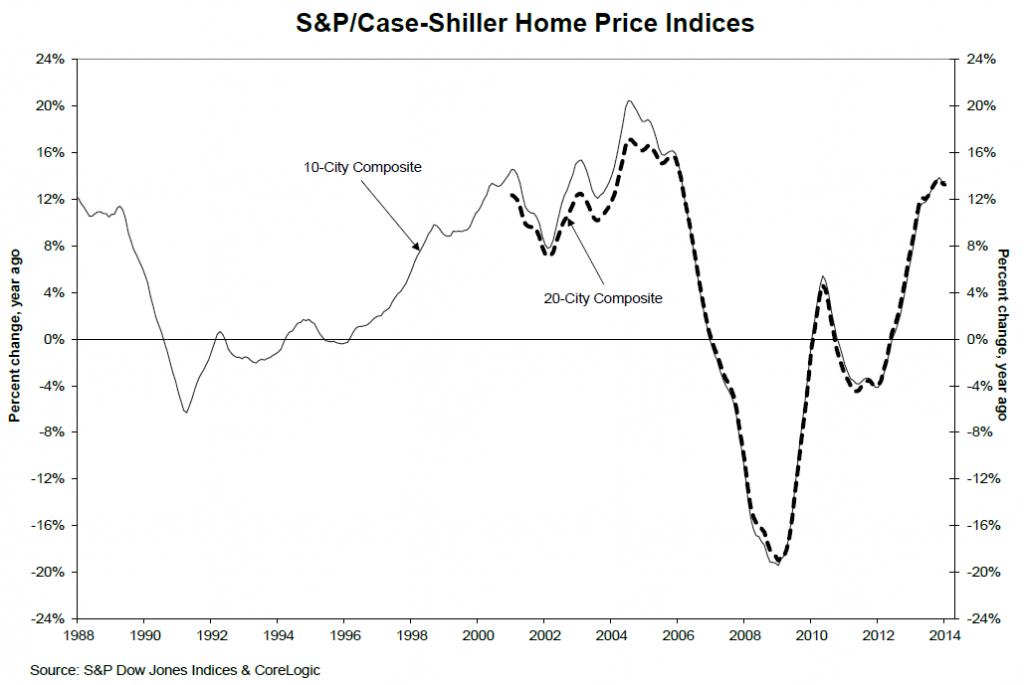
Nationally, housing prices peaked in 2014, as the following Case-Shiller chart shows.

CS2014

The Case Shiller home price indices have been the gold standard and the focus of many forecasting efforts. A key feature is reliance on the “repeat sales method.” This uses data on properties that have sold at least twice to capture the appreciated value of each specific sales unit, holding quality constant.

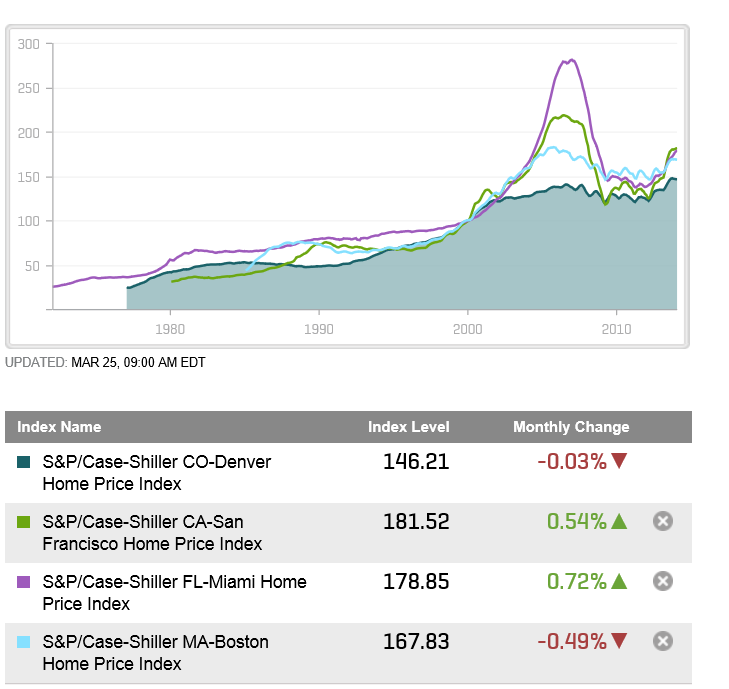
The following chart shows Case-Shiller (C-S) house indexes for four MSA’s (metropolitan statistical areas) – Denver, San Francisco, Miami, and Boston.

CScities

The price “bubble” was more dramatic in some cities than others.

Forecasting Housing Prices and Housing Starts

The challenge to predictive modeling is more or less the same – how to account for a curve which initially rises, and then falls (in some cases dramatically), “stabilizes” and begins to climb again, although with increased volatility, again as long term interest rates rise. 

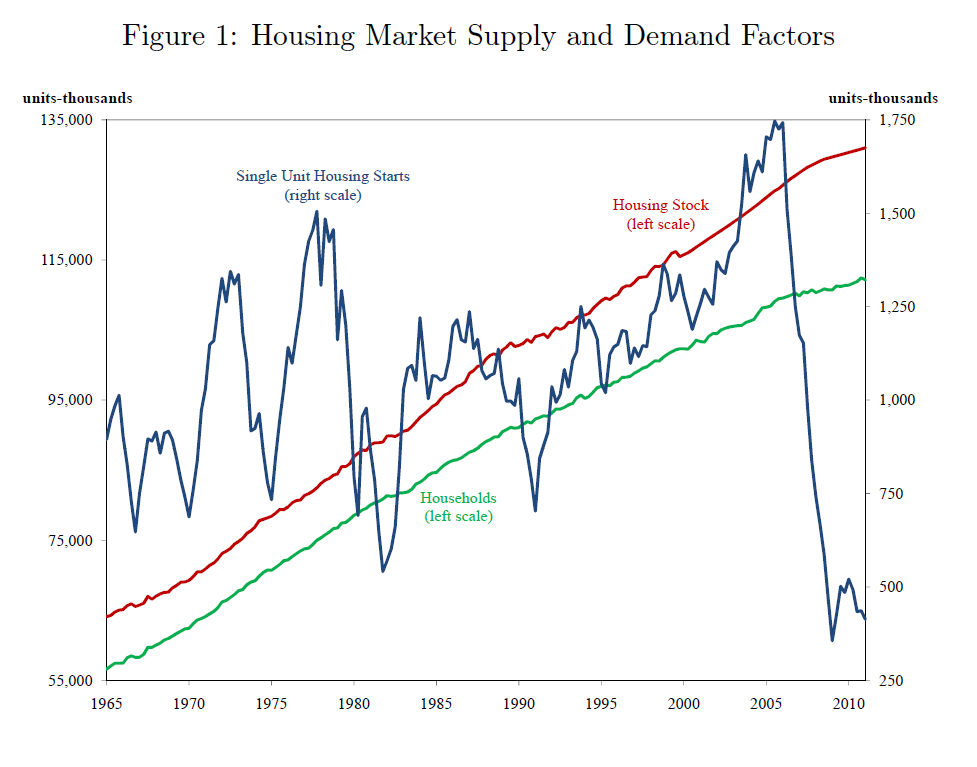
Volatility is a feature of housing starts, also, when compared with growth in households and the housing stock, as highlighted in the following graphic taken from an econometric analysis by San Francisco Federal Reserve analysts.

SandDfactorshousingThe fluctuations in housing starts track with drivers such as employment, energy prices, prices of construction materials, and real mortgage rates, but the short term forecasting models, including variables such as current listings and even Internet search activity, are promising.

Companies operating in this space include CoreLogic, Zillow and Moody’s Analytics. The sweet spot in all these services is to disaggregate housing price forecasts more local levels – the county level, for example.

Finally, in this survey of resources, one of the best housing and real estate blogs is Calculated Risk.

I’d like to post more on these predictive efforts, their statistical rationale, and their performance.

Also, the Federal Reserve “taper” of Quantitative Easing (QE) currently underway is impacting long term interest rates and mortgage rates.

The key question is whether the US housing market can withstand return to “normal” interest rate conditions in the next one to two years, and how that will play out.

Sales and new product forecasting in data-limited (real world) contexts