Category Archives: asset bubbles

Today’s Stock Market

Shakespeare’s Hamlet says at one point, “There are more things Horatio, than are dreamt of in your philosophy.” This is also a worthy thought when it comes to stock market forecasts.

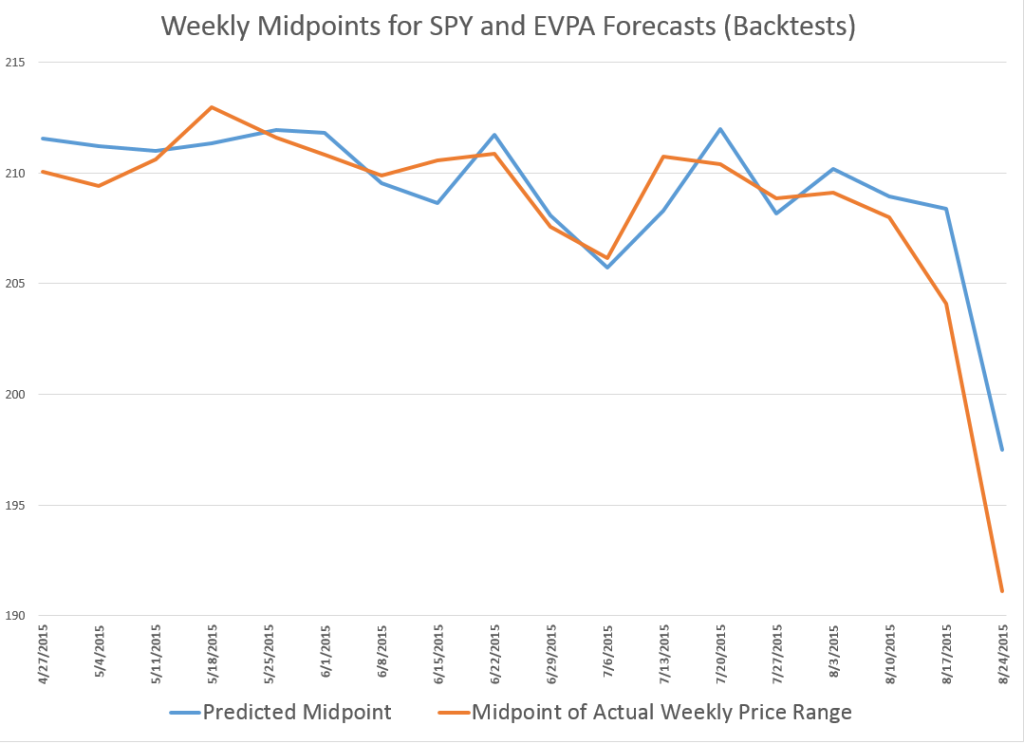
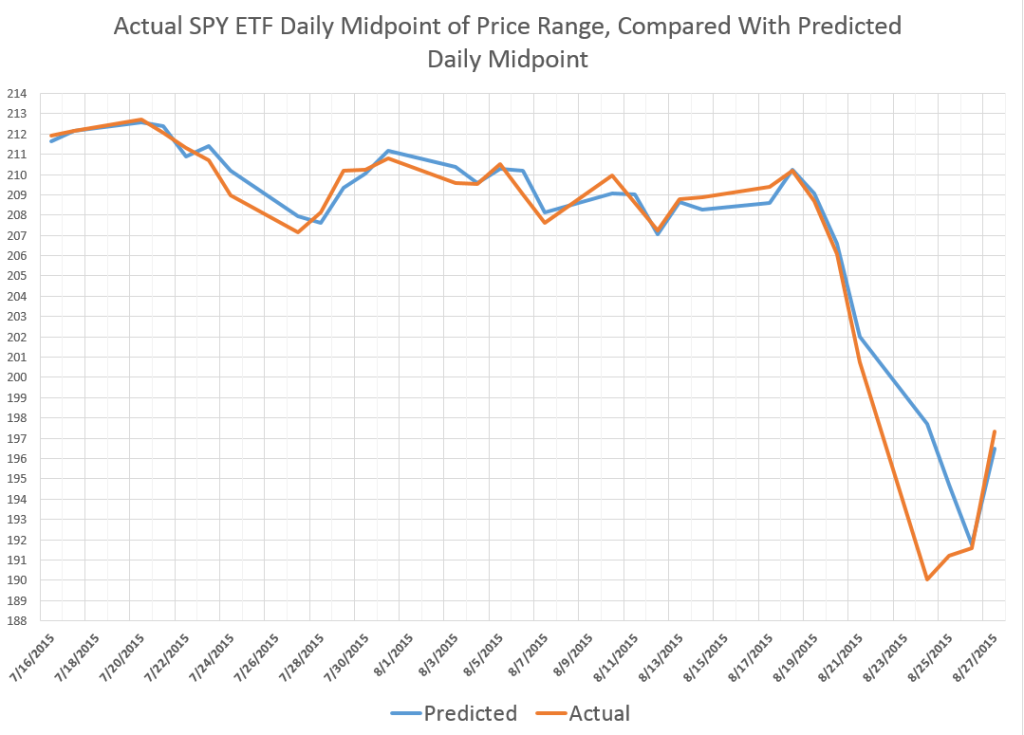
So here is a chart showing recent daily predictions of the midpoint (MP) of the daily price ranges for the SPY exchange traded fund (ETF), compared with the actual dollar value of the midpoint of the trading range for each day.

FlashCrash

The predictions are generated by the EVPA – extreme value prediction algorithm. This is a grown-up version of the idea that ratios, like the ratio between the opening price and the previous high or low, can give us a leg up in predicting the high or low prices (or midpoint) for a trading day.

Note the EVPA is quite accurate up to recent days, when forecast errors amplify at the end of the week of August 21. In fact, in backtests to 1994, EVPA forecasts the daily MP with a mean absolute percent error (MAPE) less that 0.4%.

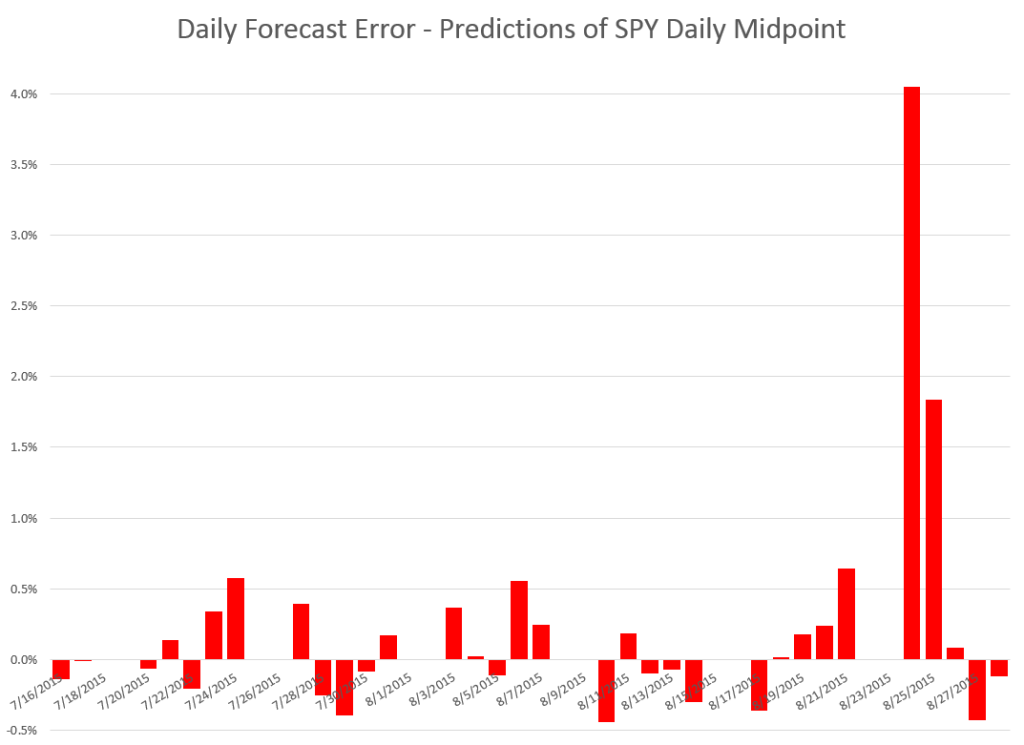
Here is a chart of the forecast errors corresponding to the predicted and actuals in the first chart above.

FCerror

Note the apparently missing bars for some dates are just those forecasts which show such tiny errors they don’t even make it to the display, which is dominated by the forecast error August 24 at about 4 percent.

Note also, the EVPA adjusts quickly, so that by Monday August 28th – when the most dramatic drop in the midpoint (closing price, etc.) occurs – the forecasts (or backcasts) show much lower forecast error (-0.1%).

Where This Is All Going

The EVPA keys off the opening price, which this morning is listed as 198.11 – lower than Friday’s closing price of 199.24.

This should tell you that the predictions for the day are not particularly rosy, and, indeed, the EVPA forecast for the week’s MP of the trading range is almost flat, compared to the midpoint of the trading range for last week. My forecast of the MP for this week is up 0.13%.

What that means, I am not quite sure.

Here is a chart showing the performance of the weekly EVPA forecasts of the SPY MP for recent weeks.

WeeklySPYMP

This chart does not include the forecast for the current week.

What I find really interesting is that, according to this model, the slide in the SPY might have been spotted as early as the second week in August.

The EVPA is an amazing piece of data analytics, but it exists in an environment of enormous complexity. Studies showing that various international stock markets are cointegrated, and the sense of this clearly applies to Chinese and US stock markets. Also, there is talk of pulling the punchbowl of “free money” or zero interest rates, and that seems to have a dampening effect on the trading outlook.

Quite frankly, in recent weeks I have been so absorbed in R programming, testing various approaches, and, as noted in my previous post, weddings, that I have neglected these simple series. No longer. I plan to make these two prediction series automatic with my systems.

We will see.

Chinese Stock Market Collapse

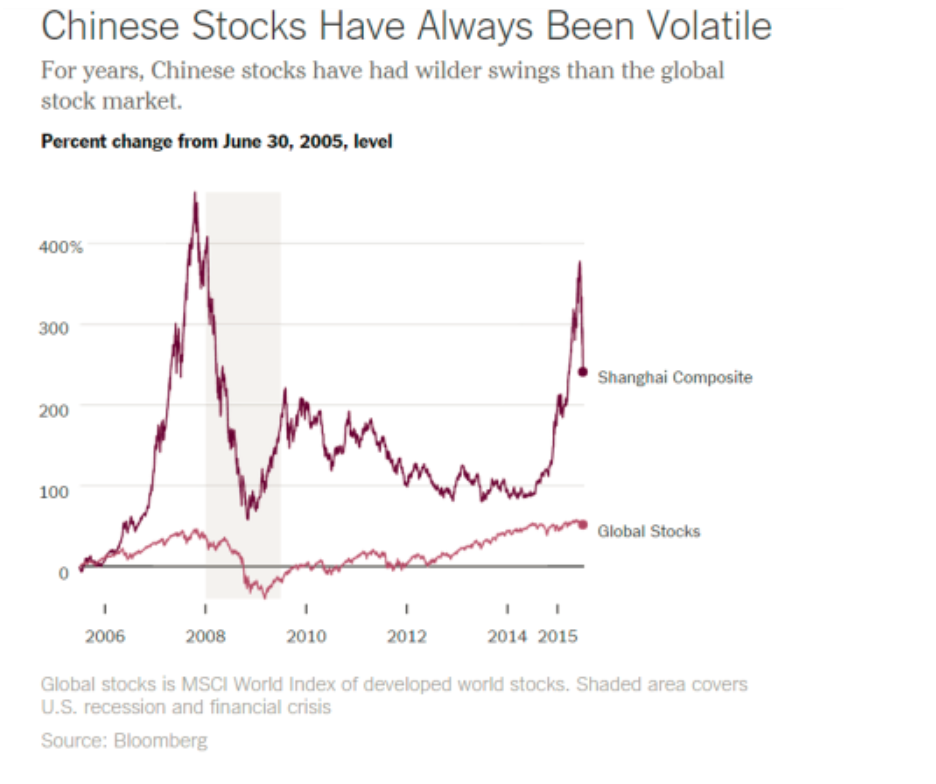
Chinese stocks are more volatile, in terms of percent swings, than stocks on other global markets, as this Bloomberg chart highlights.

ChinaStockVolatileGlobal

So the implication is maybe that the current bursting of the Chinese stock bubble is not such a big deal for the global economy, or perhaps it can be contained – despite signs of correlations between the Global Stocks and Shanghai Composite series.

Facts and Figures

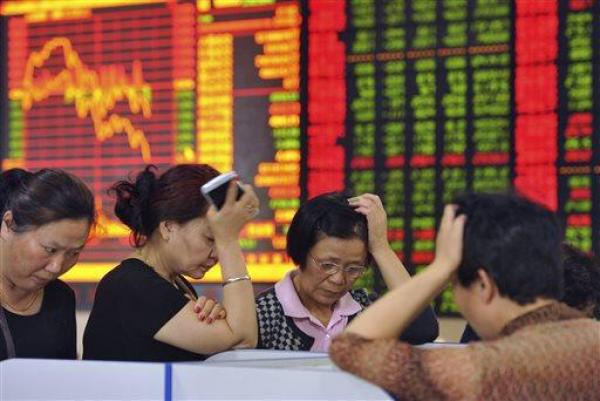
Panic selling hit the major Chinese exchanges in Shanghai and Shenzeng, spreading now to the Hong Kong exchange.

Trades on most companies are limited or frozen, and major indexes continue to drop, despite support from the Chinese government.

Chinese Trading Suspensions Freeze $1.4 Trillion of Shares Amid Rout

The rout in Chinese shares has erased at least $3.2 trillion in value, or twice the size of India’s entire stock market. The Shenzhen Composite Index has led declines with a 38 percent plunge since its June 12 peak, as margin traders unwound bullish bets.

China: The Stock Market Meltdown Continues

Briefly put, there are few alternatives for saving in China. The formal banking system provides negative returns (low deposit yields, lower than inflation typically). Housing is no longer returning positive capital gains — partly as a consequence of deliberate policy actions to moderate a perceived housing bubble. So, what’s left (given you can’t easily save in overseas assets)? Equities. We have a typical boom-bust phenomenon, amplified by underdeveloped financial markets, opacity in valuations, and uncertainty regarding the government’s intentions (and will-power).

Stock Sell-Off Is Unabated in China (New York Times)

Most of the trades on Chinese exchanges are made by “retail traders,” basically individuals speculating on the market. These individuals often are highly leveraged or operating with borrowed money.

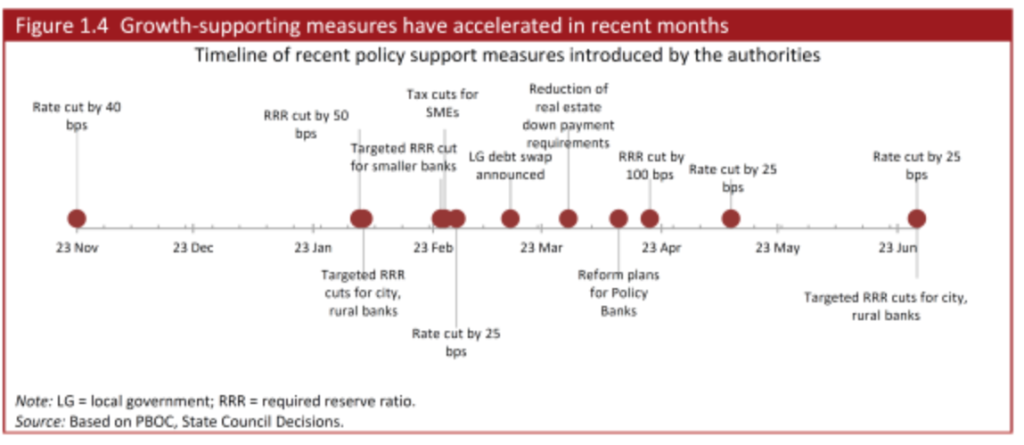
The Chinese markets moved into bubble territory several months back, and when a correction hit and as it accelerated recently, the Chinese government has tried all sorts of stuff, some charted below.

Chinameasures

Public/private funds to buy stocks and slow the fall in their prices have been created, also.

Risks of Contagion

It’s hard for foreign investors to gain access to the Chinese markets, where there are different classes of stocks for Chinese and foreign traders. So, by that light, only a few percent of Chinese stocks are held by foreign interests, and direct linkages between the sharp turn in values in China and elsewhere should be limited.

There may indirect linkages going from the Chinese stock market to the Chinese economy, and then to foreign supplies.

Here’s why the crash in Chinese stocks matters so much to Australia, i.e.  Australian property markets and reduced Chinese demand for iron.

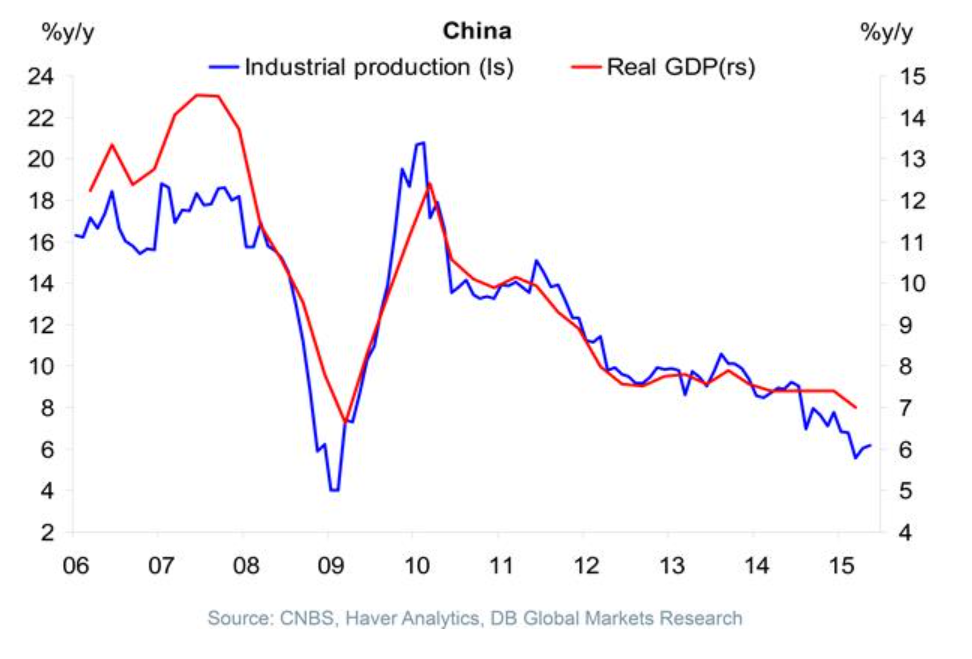
Iron ore demand by China and the drop in Chinese stocks actually seems more related to somewhat independent linkage with the longer term cascade down by Chinese GDP growth, illustrated here (See Ongoing Developments in China).

ChinaGDPgr

But maybe the most dangerous and unpredictable linkage is psychological.

Thus, the Financial Express of India reports Shanghai blues trigger panic selling on Dalal Street, metals feel the heat

Forecasting the Downswing in Markets – II

Because the Great Recession of 2008-2009 was closely tied with asset bubbles in the US and other housing markets, I have a category for asset bubbles in this blog.

In researching the housing and other asset bubbles, I have been surprised to discover that there are economists who deny their existence.

By one definition, an asset bubble is a movement of prices in a market away from fundamental values in a sustained manner. While there are precedents for suggesting that bubbles can form in the context of rational expectations (for example, Blanchard’s widely quoted 1982 paper), it seems more reasonable to consider that “noise” investors who are less than perfectly informed are part of the picture. Thus, there is an interesting study of the presence and importance of “out-of-town” investors in the recent run-up of US residential real estate prices which peaked in 2008.

The “deviations from fundamentals” approach in econometrics often translates to attempts to develop or show breaks in cointegrating relationships, between, for example, rental rates and housing prices. Let me just say right off that the problem with this is that the whole subject of cointegration of nonstationary time series is fraught with statistical pitfalls – such as weak tests to reject unit roots. To hang everything on whether or not Granger causation can or cannot be shown is to really be subject to the whims of random influences in the data, as well as violations of distributional assumptions on the relevant error terms.

I am sorry if all that sounds kind of wonkish, but it really needs to be said.

Institutionalist approaches seem more promising – such as a recent white paper arguing that the housing bubble and bust was the result of a ..

supply-side phenomenon, attributable to an excess of mispriced mortgage finance: mortgage-finance spreads declined and volume increased, even as risk increased—a confluence attributable only to an oversupply of mortgage finance.

But what about forecasting the trajectory of prices, both up and then down, in an asset bubble?

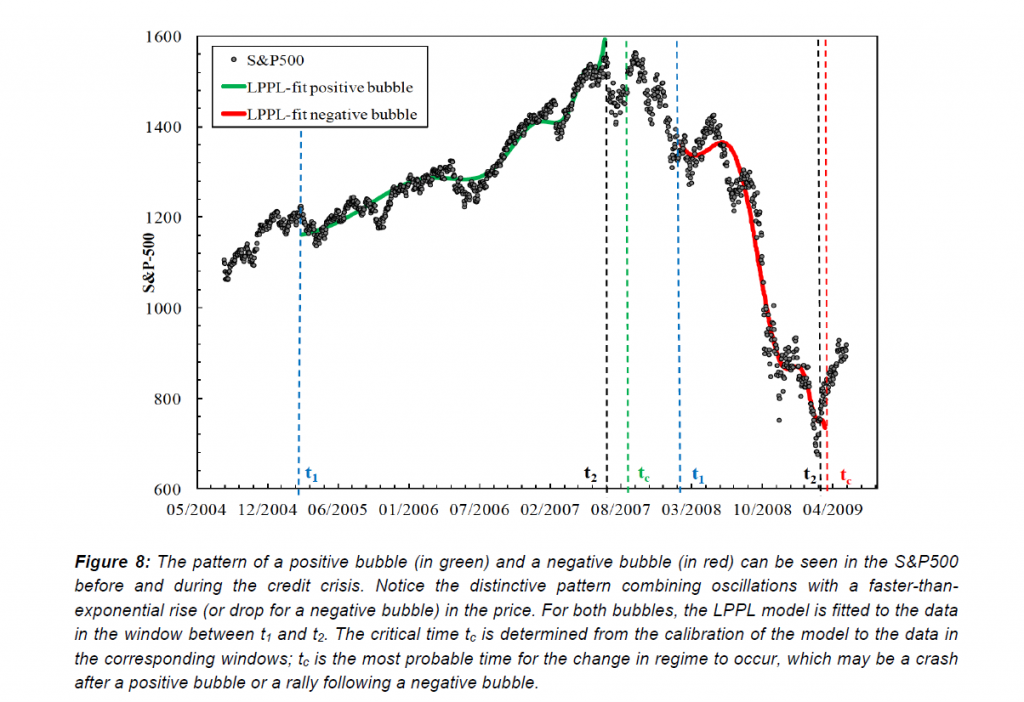
What can we make out of charts such as this, in a recent paper by Sornette and Cauwels?

negativebubble

Sornett and the many researchers collaborating with him over the years are working with a paradigm of an asset bubble as a faster than exponential increase in prices. In an as yet futile effort to extend the olive branch to traditional economists (Sornette is a geophysicist by training), Sornette evokes the “bubbles following from rational expectations meme.” The idea is that it could be rational for an investor to participate in a market that is in the throes of an asset bubble, providing that the investor believes that his gains in the near future adequately compensate for the increased risk of a collapse of prices. This is the “greater fool” theory to a large extent, and I always take delight in pointing out that one of the most intelligent of all human beings – Isaac Newton – was burned by exactly such a situation hundreds of years ago.

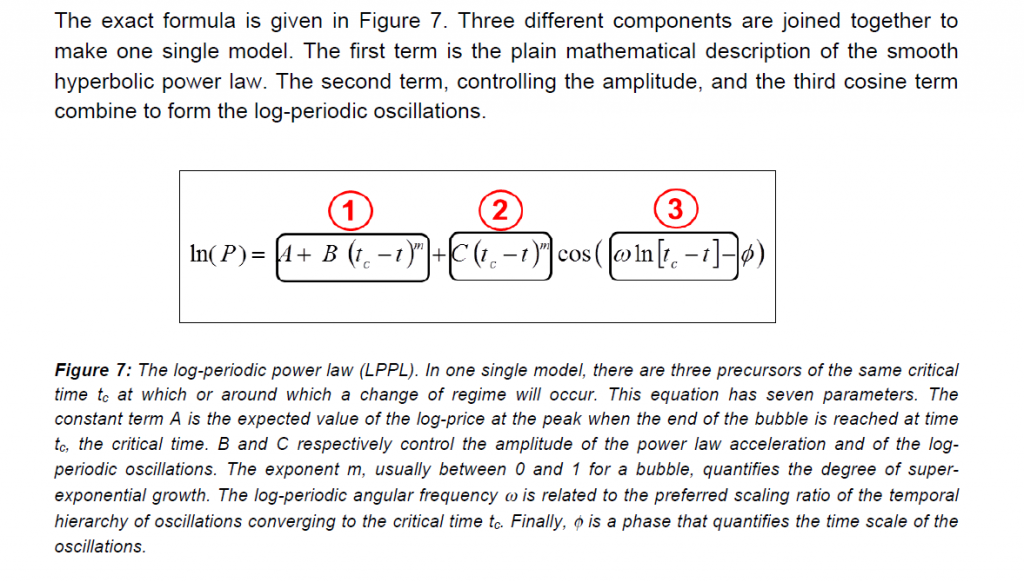
In any case, the mathematics of the Sornette et al approach are organized around the log-periodic power law, expressed in the following equation with the Sornette and Cauwels commentary (click to enlarge).

LPPL

From a big picture standpoint, the first thing to observe is that there is a parameter tc in the equation which is the “critical time.”

The whole point of this mathematical apparatus, which derives in part from differential equations and some basic modeling approaches common in physics, is that faster than exponential growth is destined to reach a point at which it basically goes ballistic. That is the critical point. The purpose of forecasting in this context then is to predict when this will be, when will the asset bubble reach its maximum price and then collapse?

And the Sornette framework allows for negative as well as positive price movements according to the dynamics in this equation. So, it is possible, if we can implement this, to predict how far the market will fall after the bubble pops, so to speak, and when it will turn around.

Pretty heady stuff.

The second big picture feature is to note the number of parameters to be estimated in fitting this model to real price data – minimally constants A, B, and C, an exponent m, the angular frequency ω and phase φ, plus the critical time.

For the mathematically inclined, there is a thread of criticism and response, more or less culminating in Clarifications to questions and criticisms on the Johansen–Ledoit–Sornette financial bubble model which used to be available as a PDF download from ETC Zurich.

In brief, the issue is whether the numerical analysis methods fitting the data to the LPPL model arrive at local, instead of global maxima. Obviously, different values for the parameters can lead to wholly different forecasts for the critical time tc.

To some extent, this issue can be dealt with by running a great number of estimations of the parameters, or by developing collateral metrics for adequacy of the estimates.

But the bottom line is – regardless of the extensive applications of this approach to all manner of asset bubbles internationally and in different markets – the estimation of the parameters seems more in the realm of art, than science, at the present time.

However, it may be that mathematical or computational breakthroughs are possible.

I feel these researchers are “very close.”

In any case, it would be great if there were a package in R or the like to gin up these estimates of the critical time, applying the log-periodic power law.

Then we could figure out “how low it can go.’

And, a final note to this post – it is ironic that as I write and post this, the stock markets have recovered from their recent swoon and are setting new records. So I guess I just want to be prepared, and am not willing to believe the runup can go on forever.

I’m also interested in methodologies that can keep forecasters usefully at work, during the downswing.

Speculators and Oil Prices

One of the more important questions in the petroleum business is the degree to which speculators influence oil prices.

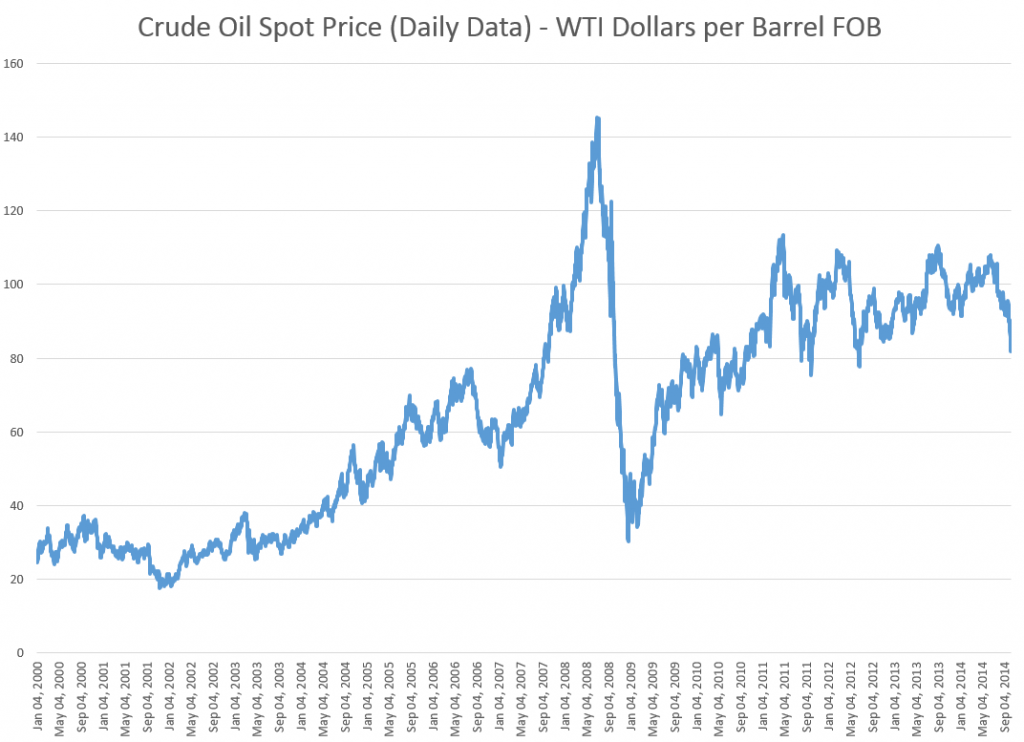
CrudeOilSpotPrice

If speculators can significantly move oil spot prices, there might be “overshooting” on the downside, in the current oil price environment. That is, the spot price of oil might drop more than fundamentals warrant, given that spot prices have dropped significantly in recent weeks and the Saudi’s may not reduce production, as they have in the past.

This issue can be rephrased more colorfully in terms of whether the 2008 oil price spike, shown below, was a “bubble,” driven in part by speculators, or whether, as some economists argue, things can be explained in terms of surging Chinese demand and supply constraints.

James Hamilton’s Causes and Consequences of the Oil Shock of 2007–08, Spring 2009, documents a failure of oil production to increase between 2005-2007, and the exponential growth in Chinese petroleum demand through 2007.

Hamilton, nevertheless, admits “the speed and magnitude of the price collapse leads one to give serious consideration to the alternative hypothesis that this episode represents a speculative price bubble that popped.”

Enter hedge fund manager Michael Masters stage left.

In testimony before the US Senate, Masters blames the 2007-08 oil price spike on speculators, and specifically on commodity index trading funds which held a quarter trillion dollars worth of futures contracts in 2008.

Hamilton characterizes Masters’ position as follows,

A typical strategy is to take a long position in a near-term futures contract, sell it a few weeks before expiry, and use the proceeds to take a long position in a subsequent near-term futures contract. When commodity prices are rising, the sell price should be higher than the buy, and the investor can profit without ever physically taking delivery. As more investment funds sought to take positions in commodity futures contracts for this purpose, so that the number of buys of next contracts always exceeded the number of sells of expiring ones, the effect, Masters argues, was to drive up the futures price, and with it the spot price. This “financialization” of commodities, according to Masters, introduced a speculative bubble in the price of oil.

Where’s the Beef?

If speculators were instrumental in driving up oil prices in 2008, however, where is the inventory build one would expect to accompany such activity? As noted above, oil production 2005-2007 was relatively static.

There are several possible answers.

One is simply that activity in the futures markets involve “paper barrels of oil” and that pricing of real supplies follows signals being generated by the futures markets. This is essentially Masters’ position.

A second, more sophisticated response is that the term structure of the oil futures markets changed, running up to 2008. The sweet spot changed from short term to long term futures, encouraging “ground storage,” rather than immediate extraction and stockpiling of inventories in storage tanks. Short term pricing followed the lead being indicated by longer term oil futures. The MIT researcher Parsons makes this case in a fascinating paper Black Gold & Fool’s Gold: Speculation in the Oil Futures Market.

..successful innovations in the financial industry made it possible for paper oil to be a financial asset in a very complete way. Once that was accomplished, a speculative bubble became possible. Oil is no different from equities or housing in this regard.

A third, more conventional answer is that, in fact, it is possible to show a direct causal link from activity in the oil futures markets to oil inventories, despite the appearances of flat production leading up to 2008.

Where This Leads

The uproar on this issue is related to efforts to increase regulation on the nasty speculators, who are distorting oil and other commodity prices away from values determined by fundamental forces.

While that might be a fine objective, I am more interested in the predictive standpoint.

Well, there is enough here to justify collecting a wide scope of data on production, prices, storage, reserves, and futures markets, and developing predictive models. It’s not clear the result would be most successful short term, or for the longer term. But I suspect forward-looking perspective is possible through predictive analytics in this area.

Top graphic from Evil Speculator.

Video Friday – the Outlook for the Rest of the Year

Here is the latest Wells Fargo economic outlook video, featuring John Silvia – one of the top forecasters, according to Bloomberg.

 Then, there is David Stockman, reminding us all about geopolitical and financial risks just at the time the Malaysian airliners got shot out of the sky.

Stockman, former Reagan Budget Director and Wall Street operator, has really become what commentators generally call an “iconoclast.”

And, I’m sorry, but I find it most useful to draw opinions from across a wide range. “Triangulation” is my best method to arrive at a perspective on the future.

The Next Recession – Will It Be A Global Meltdown?

One my focuses is the global economy and any cracks in the firmament which might presage the next recession. I rely a lot on my Twitter account to keep me on the crest of the wave, in this regard.

I’m really concerned, as are many of my colleagues and contacts in business and government.

We’ve hardly escaped the effects of last recession 2008-2009. Those are US dates, of course, set by the National Bureau of Economic Research (NBER) the official recession “dater” in this country.

There have been a series of rolling impacts and consequences of this so-called “Great Recession.”

Europe

Housing or real estate bubbles were present in Europe, too, particularly in Spain and Ireland. Then, there was the problem of the Greek economy and state, which did not support the level of public debt that had been garnered by, in some cases, corrupt public officials. And European problems were complicated by the currency union of the euro in a context where there is not, as yet, a centralized EU state. Anyway, not to reprise the whole matter blow-by-blow, but most of Europe, with the exception of Germany, plunged into recession and struggled with austerity policies that made things worse for Main Street or, as they like to say in Britain, “High Street.”

Many European countries are just now coming out of recession, and overall, the growth rate in the EU area is almost indistinguishable from zero.

So another recession in the next one to two years would really set them back.

China

Part of the problem China has been experiencing is related to the persisting downturn in most of Europe, since Europe is a big trading partner. And so, for that matter is the United States, which bought less from China during the recession years.

But another problem is that China now is experiencing a mojo big property bubble of its own.

Newly wealthy Chinese do not really have any place to put their money, except real estate. The Chinese, like the Japanese, are big savers, and for many middle class families, buying the second apartment or even a house is an investment for the future. Yet Chinese real estate prices have skyrocketed, leaving the average Chinese wage earner in the dust, with less and less hope of ever owning a residence.

Apparently, in connection with this real estate speculation, a large shadow banking system has emerged. Some estimates circulate on Twitter suggesting this rivals the size of the official Chinese banking system.

Can “market socialism” or “market Leninism” experience a financial crisis, based on too many debts that cannot be paid?

I’ve been to China a few times, and done some business there – all the while trying to understand how things are set up. My feeling is that one should not impute banking practices that seem pro forma in, say, Great Britain or the US, to the Chinese. I think they are much more ready to “break the rules” in order to keep the party going (which is sort of a pun).

Having said that, I do think a Chinese crisis could develop if property values collapse, as they are wont to do in bubble mode.

Again, it’s hard to say how this might play out, since the victims and suffering would be among the nouveau riche of China, of whom there are millions, and many more average families who have invested their nest egg in a hot property.

But I can’t think that collapse of real estate values in modern China would not have worldwide repurcussions.

The Rest of the World

Regrettably, I cannot go through other major regions, one-by-one, but I’d have to say that things are not so good. The BRIC’s as a group all have more problems than a few years back, when they were hailed as the bright new centers of economic growth by that Goldman Sachs analyst. That’s Brazil, Russia, India, and China, of course.

Possibilities of Increased Conflict

There is a kind of axiom of geopolitics and social interaction that when the pie is growing and everybody can get more, even though their slice may not have been very big to begin with, there is a tendency for people to make do, go about their business and so forth. Reverse this and you have the concept that shrinking the pie – as austerity policies and the Great Recession have done – tends to increase levels of conflict. At first, to the extent that people have the idea that “we are all in this together” there may be increased cooperation. But that is not the current situation in almost any society. Quite the contrary, as Piketty and the Occupy Movement highlight, there is growing awareness of inequality of wealth and income.

There are armed conflicts in Syria, the Ukraine, Afghanistan (resurgent Taliban), and areas and regions in Africa. The Indian elections recently installed a Hindu nationalist who hopefully will be a reformer, but may, if the going gets tough, revert or acquiesce to more conflict with Pakistan and with non-Hindu populations within India. Pakistan, one of the world’s nuclear powers, appears to be extremely unstable politically. There are deep civil divisions in Thailand between city and rural areas that parallel class divisions. China is flexing its muscles in the South China Sea.

And we may be moving from an era of US-centric global capitalism to a time when the Eurasian supercontinent will become significantly more important and perhaps decoupled from Wall Street and the City of London. Already, there are threats to dollar supremacy, and, historically, as US economic power is eclipsed by the more rapidly growing economies of Asia, some adjustment seems predictable.

In all this, Hollywood can be counted on to roll out some really corking new international intrigue films, perhaps (although I doubt it) with more complex plots.

The Situation with the US Federal Reserve Bank

The point of this international survey and reprise of recent business history is to highlight areas where surprises may originate, shaking the markets, and perhaps triggering the next recession.

But the most likely suspect is the US Federal Reserve Bank.

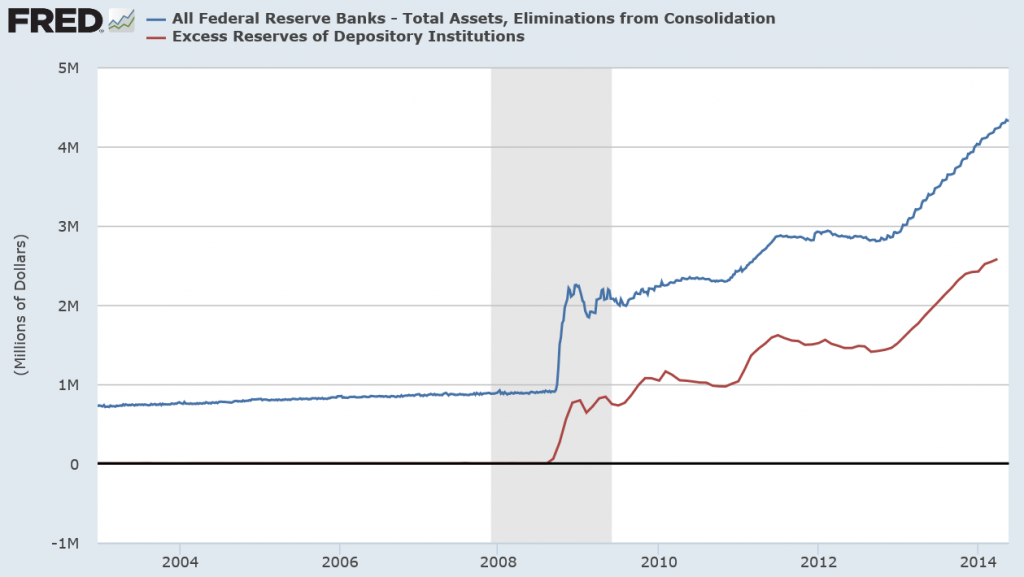
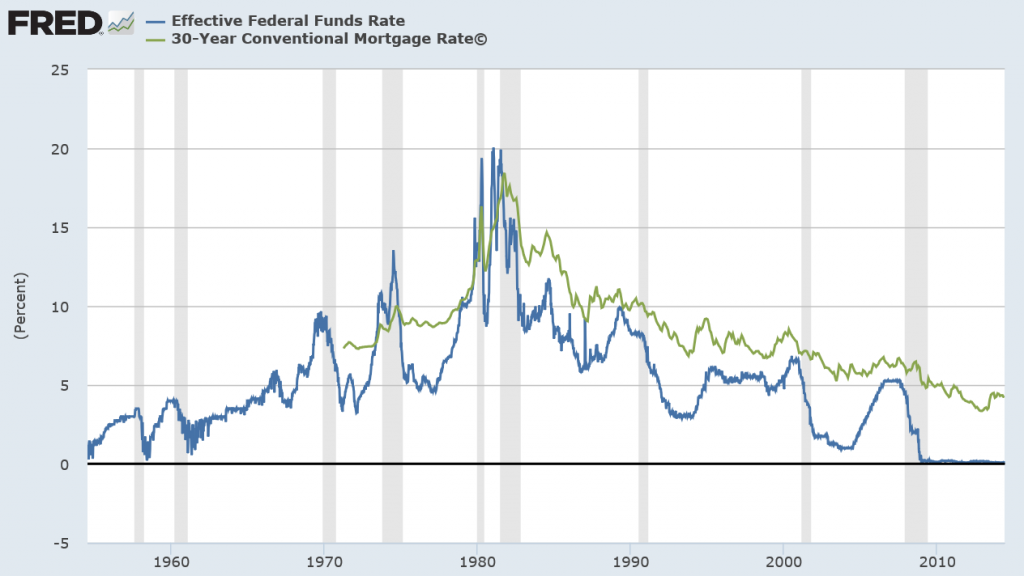
Two graphs speak volumes.
interestratesnew

Fedassets

Seeking to encourage economic recovery, the US Federal Reserve dropped the federal funds rate to a number effectively almost zero – a historically low number. This zero bound federal funds rate has persisted since the end of 2009, or for about five years.

The Fed also has engaged in new policies, whereby it goes into private bond markets and buys long term bonds – primarily mortgage-backed securities. The second chart tracks this inasmuch as a good portion of the more than 4 trillion in Fed assets (for which there are corresponding liabilities, of course) are these mortgage-backed securities. In effect, the Fed has purchased a sizeable portion of the US housing market – one might say “nationalize” except that would be forgetting the fact that the Fed is actually a private institution whose governance is appointed by the Executive Branch of the US government.

In any case, this bond-buying is the famous “quantitative easing” (QE) and is mirrored in the accumulation of excess reserves by the banking system. Generally, that is, banks and financial institutions issue mortgages, sell them among themselves to be packaged in mortgage-backed securities, and the Fed has been buying these.

Banks can easily loan these excess reserves, but they consistently have not. Why is an interesting question beyond the scope of this discussion, but the consequence is that the Fed’s actions are “firewalled” from increasing the rate of inflation, which is what ordinarily you might think would occur given that various metrics of money supply also have surged upward.

Now “Fed-watching” is its own little cottage industry among financial commentators, and I am not going to second-guess the media here. The Fed has announced a plan to “taper” these purchases of long term bonds. This is likely to increase the mortgage rates and, probably to some extent, based on expectations already has.

So, the long and the short of it are that this set of policies – zero federal funds rate and bond buying cannot go on forever.

If economic growth has been low-grade since 2010 with these low interest rates, what is the reasonable outlook for a higher interest rate regime?

Timing of the Next Recession

When is the most likely time for a recession, for example? Would it be later in 2014, in 2015, or thereafter, maybe in 2016.

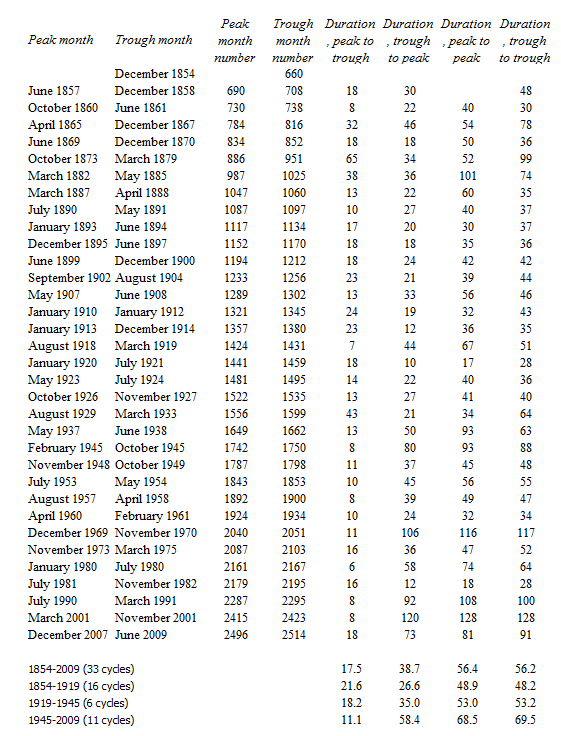
Here is a table of all the recessions in the US since the middle 1850’s along with facts about their duration (source: NBER).
NBERRecess

Without even considering averages, the maximum period of trough to trough – that is, from the bottom of one recession to the bottom of the next – has been 128 months or ten years and eight months. Here, incidentally, the month numbers begin January 1800, for what that’s worth.

Thus, at the outside, based on these empirics, the trough of the next recession is likely to occur no later than early 2020.

Note that we have already blown through the average length from trough to trough of about 58.4 months or about five years from June 2009.

On a simple probabilistic basis, therefore, we are moving into the tail of the distribution of business cycle durations, suggesting that the chances of a downturn are in some sense already above 50 percent.

And note that the experience of the current business recovery is nothing like this historically maximum span in the 1990’s between the trough of the recession of 1990-1991 and the trough of November 2001.

This business recovery persistently seems to move ahead just above or, in the last quarter of 2013, below “stall speed.”

Seemingly, a fairly minor perturbation could set off a chain reaction, given the advanced frothiness in the stock market and softness in housing prices.

More of the Same, Worse

Neil Baroifsky was special inspector with oversight authority for the TARP during the bailout phase of the Great Recession, and currently is a partner in the Litigation Department of national law firm Jenner & Block LLP.

He’s also an author and often is called on for his opinion about developments in malfeasance writ large among the finance giants – such as the Credit Suisse settlement. In connection with a recent NPR interview, Barofsky said,

Although it is good that we averted a catastrophe back in 2008, the way that we did so I believe has unfortunately set the stage for an even more devastating financial crisis in the future.

HOBSON: In the future? How far?

BAROFSKY: Well, if I knew that, Michael Lewis would be writing his next book about people who made billions on timing the markets perfectly about me, which would be great.

(LAUGHTER)

BAROFSKY: But if you look, a lot of the same broken incentives from 2008 are still there. It’s just a question of when, not if. You can’t look at the fundamental broken incentives in the financial system and really come to a conclusion other than that we’re headed down the same dangerous path that we were that culminated in the explosion of ’08.

Barofsky’s point is readily supported by facts, such as –

The US and global financial system is even more concentrated today than in 2007, making “too big to fail”and even bigger potential problem now, than before the Great Recession. Even Alan Greenspan has taken note.

And the “pass the buck” system, whereby bond rating agencies are paid by the originators to evaluate exotic securities (“financial innovations”) created by the banking and shadow banking industries, securities which are then passed on to pension funds and hapless investors – this system appears to still be completely in place. Talk about the concept of “moral hazard.”

Global Impact

I think you get the picture.

For one reason or another, some fairly minor event is likely to set off a cascade of consequences in US and global financial markets, leading to the next recession. Probably, within one, two, or three years, as a matter of fact. Because the US Fed, and, for that matter, other central banks will still be working their way out of the last recession, there may be fewer “policy tools” to halt the stampede to sell, cutback, and so forth. Governments could respond with aggressive fiscal policy, but that option appears limited unless there are major changes in the political climate in the US and Europe.

Personally, I think wholly new directions of policy should be contemplated at the personal, local, regional, and of course at national levels.

We need to create what I have started to call “islands of stability.” This is the old idea of local self-reliance, but in new packaging. I really think there should be discussions widely across the US at least about how to decouple from the global economy and, indeed, from the financial concentrations on Wall Street. As a matter of self-preservation, until such time as more courageous national policies can be undertaken to reign in such obvious risks.
Daily Updates on Whether Key Financial Series Are Going Into Bubble Mode

Financial and asset bubbles are controversial, amazingly enough, in standard economics, where a bubble is defined as a divergence in a market from fundamental value. The problem, of course, is what is fundamental value. Maybe investors in the dot.com frenzy of the late 1990’s believed all the hype about never-ending and accelerating growth in IT, as a result of the Internet.

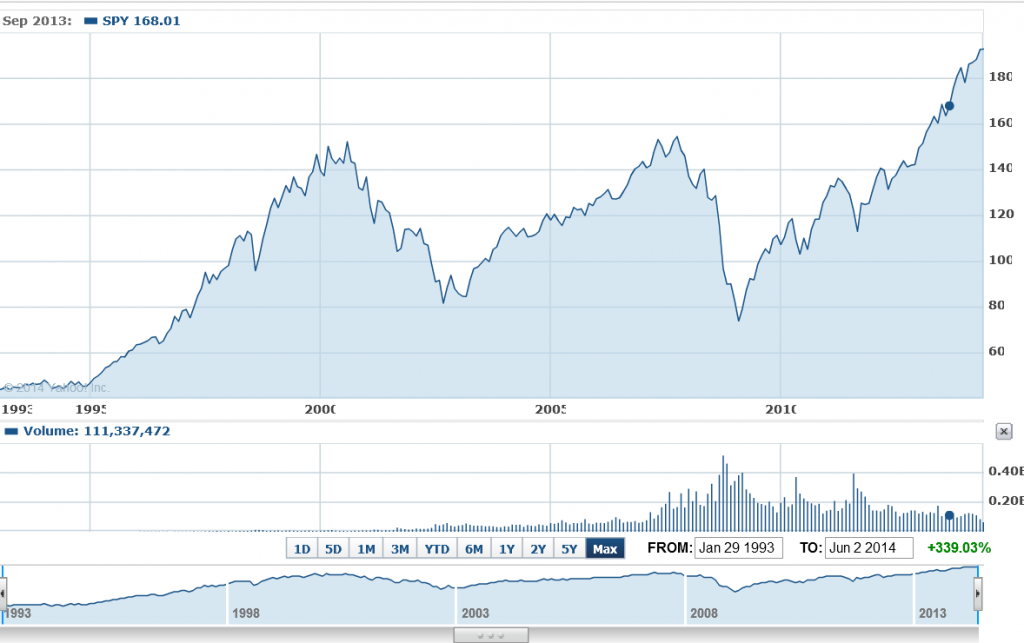
So we have this chart for the ETF SPY which tracks the S&P500. Now, there are similarities between the upswing of the two previous peaks – which both led to busts – and the current surge in the index.

sp500yahoo

Where is this going to end?

Well, I’ve followed the research of Didier Sornette and his co-researchers, and, of course, Sornette’s group has an answer to this question, which is “probably not well.” Currently, Professor Sornette occupies the Chair of Entreprenuerial Risk at the Swiss Federal Institute of Technology in Zurich.

There is an excellent website maintained by ETH Zurich for the theory and empirical analysis of financial bubbles.

Sornette and his group view bubbles from a more mathematical perspective, finding similarities in bubbles of durations from months to years in the concept of “faster than exponential growth.” At some point, that is, asset prices embark on this type of trajectory. Because of various feedback mechanisms in financial markets, as well as just herding behavior, asset prices in bubble mode oscillate around an accelerating trajectory which – at some point that Sornette claims can be identified mathematically – becomes unsupportable. At such a moment, there is a critical point where the probability of a collapse or reversal of the process becomes significantly greater.

This group is on the path of developing a new science of asset bubbles, if you will.

And, by this logic, there are positive and negative bubbles.

The sharp drop in stock prices in 2008, for example, represents a negative stock market bubble movement, and also is governed or described, by this theory, by an underlying differential equation. This differential equation leads to critical points, where the probability of reversal of the downward price movement is significantly greater.

I have decided I am going to compute the full price equation suggested by Sornette and others to see what prediction for a critical point emerges for the S&P 500 or SPY.

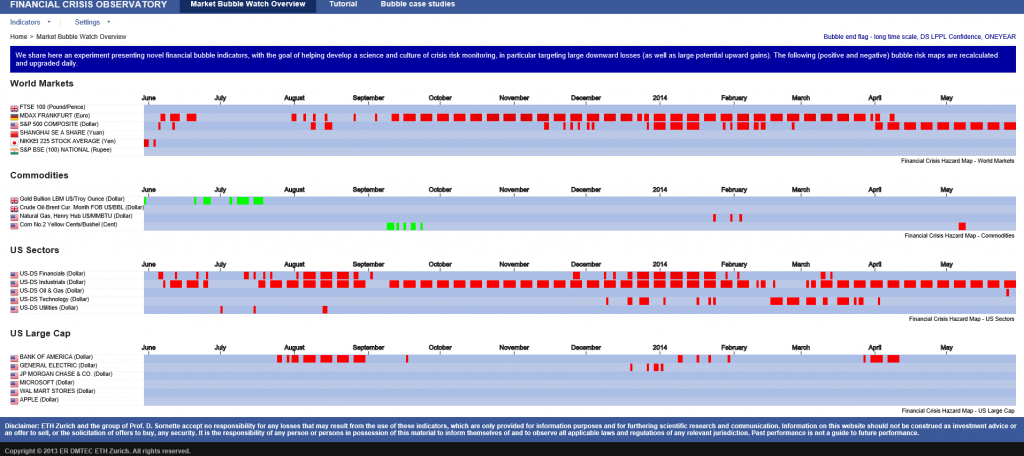
But actually, this would be for my own satisfaction, since Sornette’s group already is doing this in the Financial Crisis Observatory.

I hope I am not violating Swiss copyright rules by showing the following image of the current Financial Crisis Observatory page (click to enlarge)

FCO

As you notice there are World Markets, Commodities, US Sectors, US Large Cap categories and little red and green boxes scattered across the page, by date.

The red boxes indicate computations by the ETH Zurich group that indicate the financial series in question is going into bubble mode. This is meant as a probabilistic evaluation and is accompanied by metrics which indicate the likelihood of a critical point. These computations are revised daily, according to the site.

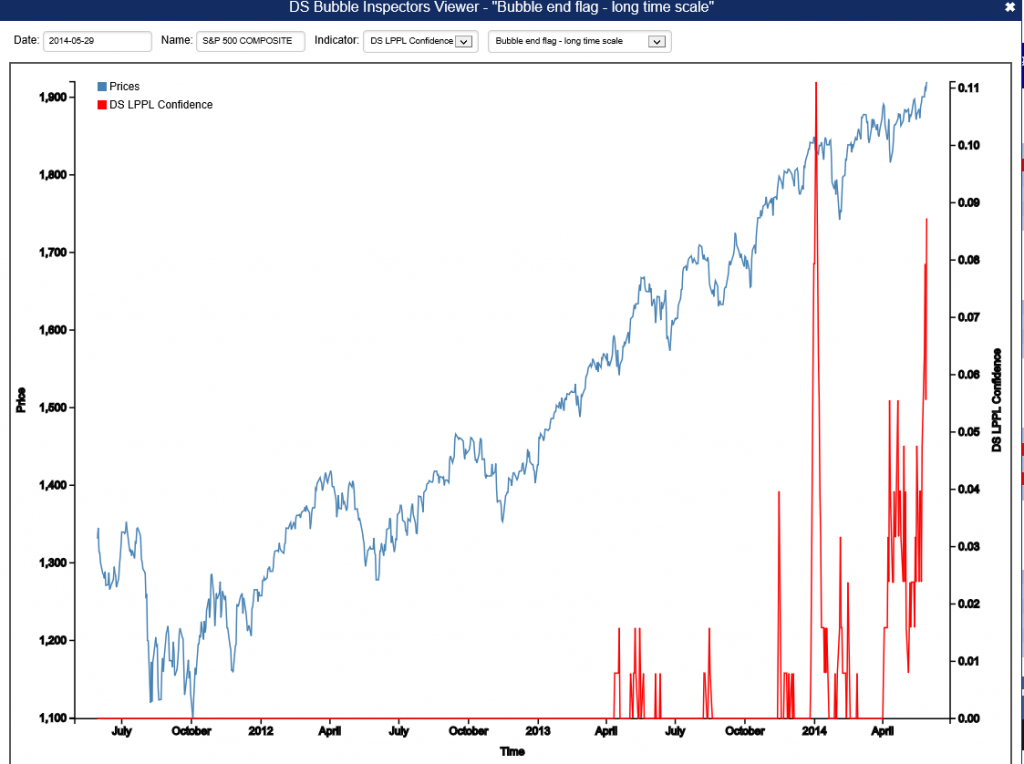
For example, there is a red box associated with the S&P 500 in late May. If you click on this red box, you  produces the following chart.

SornetteSP500

The implication is that the highest red spike in the chart at the end of December 2013 is associated with a reversal in the index, and also that one would be well-advised to watch for another similar spike coming up.

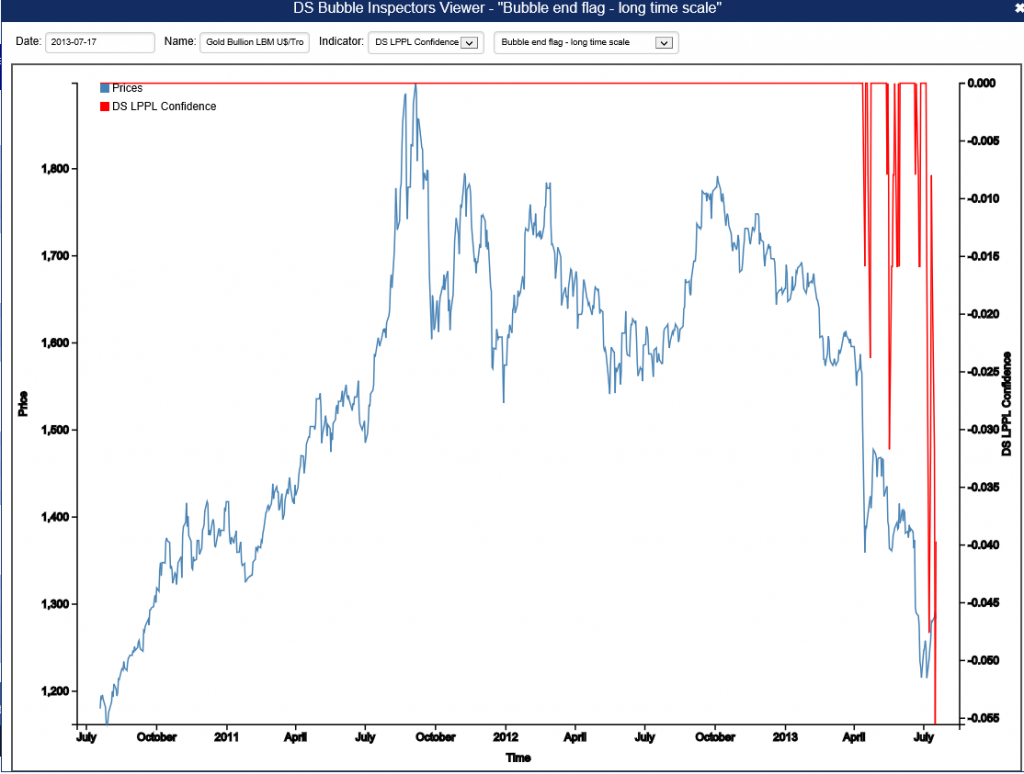
Negative bubbles, as I mention, also are in the lexicon. One of the green boxes for gold, for example, produces the following chart.

Goldnegbubble

This is fascinating stuff, and although Professor Sornette has gotten some media coverage over the years, even giving a TED talk recently, the economics profession generally seems to have given him almost no attention.

I plan a post on this approach with a worked example. It certainly is much more robust that some other officially sanctioned approaches.

Forecasting Housing Markets – 3

Maybe I jumped to conclusions yesterday. Maybe, in fact, a retrospective analysis of the collapse in US housing prices in the recent 2008-2010 recession has been accomplished – but by major metropolitan area.

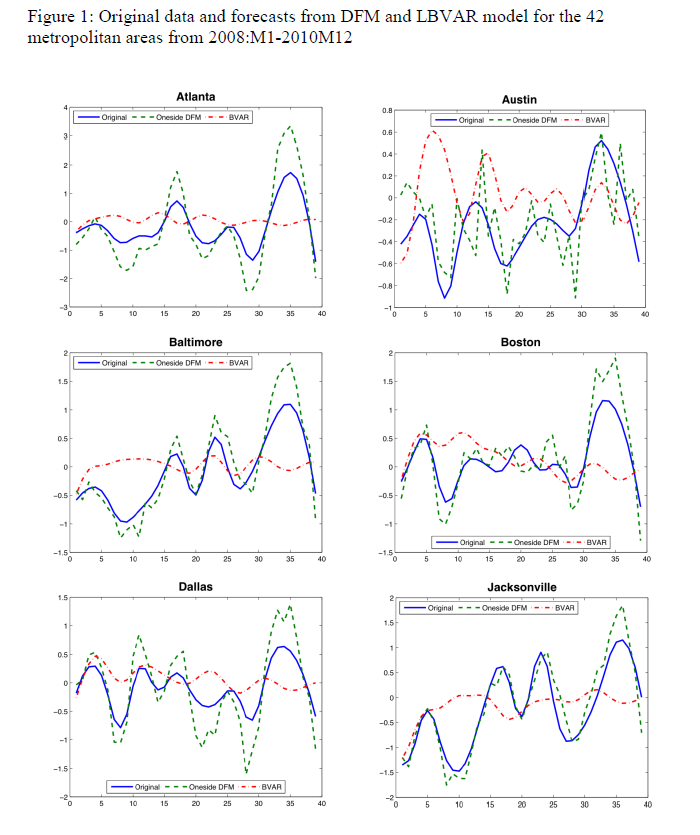
The Yarui Li and David Leatham paper Forecasting Housing Prices: Dynamic Factor Model versus LBVAR Model focuses on out-of-sample forecasts for house price indices for 42 metropolitan areas. Forecast models are built with data from 1980:01 to 2007:12. These models – dynamic factor and Large-scale Bayesian Vector Autoregressive (LBVAR) models – are used to generate forecasts of the one- to twelve- months ahead price growth 2008:01 to 2010:12.

Judging from the graphics and other information, the dynamic factor model (DFM) produces impressive results.

For example, here are out-of-sample forecasts of the monthly growth of housing prices (click to enlarge).

DFMhousing

The house price indices for the 42 metropolitan areas are from the Office of Federal Housing Enterprise Oversight (OFEO). The data for macroeconomic indicators in the dynamic factor and VAR models are from the DRI/McGraw Hill Basic Economics Database provided by IHS Global Insight.

I have seen forecasting models using Internet search activity which purportedly capture turning points in housing price series, but this is something different.

The claim here is that calculating dynamic or generalized principal components of some 141 macroeconomic time series can lead to forecasting models which accurately capture fluctuations in cumulative growth rates of metropolitan house price indices over a forecasting horizon of up to 12 months.

That’s pretty startling, and I for one would like to see further output of such models by city.

But where is the publication of the final paper? The PDF file linked above was presented at the Agricultural & Applied Economics Association’s 2011 Annual Meeting in Pittsburgh, Pennsylvania, July, 2011. A search under both authors does not turn up a final publication in a refereed journal, but does indicate there is great interest in this research. The presentation paper thus is available from quite a number of different sources which obligingly archive it.

Yarui

Currently, the lead author, Yarui Li, Is a Decision Tech Analyst at JPMorgan Chase, according to LinkedIn, having received her PhD from Texas A&M University in 2013. The second author is Professor at Texas A&M, most recently publishing on VAR models applied to business failure in the US.

Dynamic Principal Components

It may be that dynamic principal components are the new ingredient accounting for an uncanny capability to identify turning points in these dynamic factor model forecasts.

The key research is associated with Forni and others, who originally documented dynamic factor models in the Review of Economics and Statistics in 2000. Subsequently, there have been two further publications by Forni on this topic:

Do financial variables help forecasting inflation and real activity in the euro area?

The Generalized Dynamic Factor Model, One Sided Estimation and Forecasting

Forni and associates present this method of dynamic prinicipal componets as an alternative to the Stock and Watson factor models based on many predictors – an alternative with superior forecasting performance.

Run-of-the-mill standard principal components are, according to Li and Leatham, based on contemporaneous covariances only. So they fail to exploit the potentially crucial information contained in the leading-lagging relations between the elements of the panel.

By contrast, the Forni dynamic component approach is used in this housing price study to

obtain estimates of common and idiosyncratic variance-covariance matrices at all leads and lags as inverse Fourier transforms of the corresponding estimated spectral density matrices, and thus overcome(s)[ing] the limitation of static PCA.

There is no question but that any further discussion of this technique must go into high mathematical dudgeon, so I leave that to another time, when I have had an opportunity to make computations of my own.

However, I will say that my explorations with forecasting principal components last year have led to me to wonder whether, in fact, it may be possible to pull out some turning points from factor models based on large panels of macroeconomic data.

Forecasting Housing Markets – 2

I am interested in business forecasting “stories.” For example, the glitch in Google’s flu forecasting program.

In real estate forecasting, the obvious thing is whether quantitative forecasting models can (or, better yet, did) forecast the collapse in housing prices and starts in the recent 2008-2010 recession (see graphics from the previous post).

There are several ways of going at this.

Who Saw The Housing Bubble Coming?

One is to look back to see whether anyone saw the bursting of the housing bubble coming and what forecasting models they were consulting.

That’s entertaining. Some people, like Ron Paul, and Nouriel Roubini, were prescient.

Roubini earned the soubriquet Dr. Doom for an early prediction of housing market collapse, as reported by the New York Times:

On Sept. 7, 2006, Nouriel Roubini, an economics professor at New York University, stood before an audience of economists at the International Monetary Fund and announced that a crisis was brewing. In the coming months and years, he warned, the United States was likely to face a once-in-a-lifetime housing bust, an oil shock, sharply declining consumer confidence and, ultimately, a deep recession. He laid out a bleak sequence of events: homeowners defaulting on mortgages, trillions of dollars of mortgage-backed securities unraveling worldwide and the global financial system shuddering to a halt. These developments, he went on, could cripple or destroy hedge funds, investment banks and other major financial institutions like Fannie Mae and Freddie Mac.

NR

Roubini was spot-on, of course, even though, at the time, jokes circulated such as “even a broken clock is right twice a day.” And my guess is his forecasting model, so to speak, is presented in Crisis Economics: A Crash Course in the Future of Finance, his 2010 book with Stephen Mihm. It is less a model than whole database of tendencies, institutional facts, areas in which Roubini correctly identifies moral hazard.

I think Ron Paul, whose projections of collapse came earlier (2003), was operating from some type of libertarian economic model.  So Paul testified before House Financial Services Committee on Fannie Mae and Freddy Mac, that –

Ironically, by transferring the risk of a widespread mortgage default, the government increases the likelihood of a painful crash in the housing market,” Paul predicted. “This is because the special privileges granted to Fannie and Freddie have distorted the housing market by allowing them to attract capital they could not attract under pure market conditions. As a result, capital is diverted from its most productive use into housing. This reduces the efficacy of the entire market and thus reduces the standard of living of all Americans.

On the other hand, there is Ben Bernanke, who in a CNBC interview in 2005 said:

7/1/05 – Interview on CNBC 

INTERVIEWER: Ben, there’s been a lot of talk about a housing bubble, particularly, you know [inaudible] from all sorts of places. Can you give us your view as to whether or not there is a housing bubble out there?

BERNANKE: Well, unquestionably, housing prices are up quite a bit; I think it’s important to note that fundamentals are also very strong. We’ve got a growing economy, jobs, incomes. We’ve got very low mortgage rates. We’ve got demographics supporting housing growth. We’ve got restricted supply in some places. So it’s certainly understandable that prices would go up some. I don’t know whether prices are exactly where they should be, but I think it’s fair to say that much of what’s happened is supported by the strength of the economy.

Bernanke was backed by one of the most far-reaching economic data collection and analysis operations in the United States, since he was in 2005 a member of the Board of Governors of the Federal Reserve System and Chairman of the President’s Council of Economic Advisors.

So that’s kind of how it is. Outsiders, like Roubini and perhaps Paul, make the correct call, but highly respected and well-placed insiders like Bernanke simply cannot interpret the data at their fingertips to suggest that a massive bubble was underway.

I think it is interesting currently that Roubini, in March, promoted the idea that Yellen Is Creating another huge Bubble in the Economy

But What Are the Quantitative Models For Forecasting the Housing Market?

In a long article in the New York Times in 2009, How Did Economists Get It So Wrong?, Paul Krugman lays the problem at the feet of the efficient market hypothesis –

When it comes to the all-too-human problem of recessions and depressions, economists need to abandon the neat but wrong solution of assuming that everyone is rational and markets work perfectly.

Along these lines, it is interesting that the Zillow home value forecast methodology builds on research which, in one set of models, assumes serial correlation and mean reversion to a long-term price trend.

Zillow

Key research in housing market dynamics includes Case and Shiller (1989) and Capozza et al (2004), who show that the housing market is not efficient and house prices exhibit strong serial correlation and mean reversion, where large market swings are usually followed by reversals to the unobserved fundamental price levels.

Based on the estimated model parameters, Capozza et al are able to reveal the housing market characteristics where serial correlation, mean reversion, and oscillatory, convergent, or divergent trends can be derived from the model parameters.

Here is an abstract from critical research underlying this approach done in 2004.

An Anatomy of Price Dynamics in Illiquid Markets: Analysis and Evidence from Local Housing Markets

This research analyzes the dynamic properties of the difference equation that arises when markets exhibit serial correlation and mean reversion. We identify the correlation and reversion parameters for which prices will overshoot equilibrium (“cycles”) and/or diverge permanently from equilibrium. We then estimate the serial correlation and mean reversion coefficients from a large panel data set of 62 metro areas from 1979 to 1995 conditional on a set of economic variables that proxy for information costs, supply costs and expectations. Serial correlation is higher in metro areas with higher real incomes, population growth and real construction costs. Mean reversion is greater in large metro areas and faster growing cities with lower construction costs. The average fitted values for mean reversion and serial correlation lie in the convergent oscillatory region, but specific observations fall in both the damped and oscillatory regions and in both the convergent and divergent regions. Thus, the dynamic properties of housing markets are specific to the given time and location being considered.

The article is not available for free download so far as I can determine. But it is based on earler research, dating back to the later 1990’s in the pdf The Dynamic Structure of Housing Markets.

The more recent Housing Market Dynamics: Evidence of Mean Reversion and Downward Rigidity by Fannie Mae researchers, lists a lot of relevant research on the serial correlation of housing prices, which is usually locality-dependent.

In fact, the Zillow forecasts are based on ensemble methods, combining univariate and multivariate models – a sign of modernity in the era of Big Data.

So far, though, I have not found a truly retrospective study of the housing market collapse, based on quantitative models. Perhaps that is because only the Roubini approach works with such complex global market phenomena.

We are left, thus, with solid theoretical foundations, validated by multiple housing databases over different time periods, that suggests that people invest in housing based on momentum factors – and that this fairly obvious observation can be shown statistically, too.

Links – April 18

Ukraine

US financial showdown with Russia is more dangerous than it looks, for both sides Ambrose Evans-Pritchard at his most incisive.

How the Ukraine crisis ends Henry Kissinger, not always one of my favorites, writes an almost wise comment on the Ukraine from early March. Still relevant.

The West must understand that, to Russia, Ukraine can never be just a foreign country. Russian history began in what was called Kievan-Rus. The Russian religion spread from there. Ukraine has been part of Russia for centuries, and their histories were intertwined before then. Some of the most important battles for Russian freedom, starting with the Battle of Poltava in 1709 , were fought on Ukrainian soil. The Black Sea Fleet — Russia’s means of projecting power in the Mediterranean — is based by long-term lease in Sevastopol, in Crimea. Even such famed dissidents as Aleksandr Solzhenitsyn and Joseph Brodsky insisted that Ukraine was an integral part of Russian history and, indeed, of Russia.

China

The Future of Democracy in Hong Kong There is an enlightening video (about 1 hour long) interview with Veteran Hong Kong political leaders Anson Chan and Martin Lee. Beijing and local Hong Kong democratic rule appear to be on a collision course.

Inside Look At Electric Taxis Hitting China In Mass This Summer China needs these. The pollution in Beijing and other big cities from cars is stifling and getting worse.

taxi

Economy

Detecting bubbles in real time Interesting suggestion for metric to guage bubble status of an asset market.

Fed’s Yellen More Concerned About Inflation Running Below 2% Target Just a teaser, but check this Huffington Post flash video of Yellen, still at the time with the San Francisco Fed, as she lays out the dangers of deflation in early 2013. Note also the New Yorker blog on Yellen’s recent policy speech, and her silence on speculative bubbles.

Yellen

Data Analytics

Manipulate Me: The Booming Business in Behavioral Finance

Hidden Markov Models: The Backwards Algorithm

Suppose you are at a table at a casino and notice that things don’t look quite right. Either the casino is extremely lucky, or things should have averaged out more than they have. You view this as a pattern recognition problem and would like to understand the number of ‘loaded’ dice that the casino is using and how these dice are loaded. To accomplish this you set up a number of Hidden Markov Models, where the number of loaded die are the latent variables, and would like to determine which of these, if any, is more likely to be using rigged dice.