Tag Archives: predictive analytics

Evidence of Stock Market Predictability

In business forecast applications, I often have been asked, “why don’t you forecast the stock market?” It’s almost a variant of “if you’re so smart, why aren’t you rich?” I usually respond something about stock prices being largely random walks.

But, stock market predictability is really the nut kernel of forecasting, isn’t it?

Earlier this year, I looked at the S&P 500 index and the SPY ETF numbers, and found I could beat a buy and hold strategy with a regression forecasting model. This was an autoregressive model with lots of lagged values of daily S&P returns. In some variants, it included lagged values of the Chicago Board of Trade VIX volatility index returns. My portfolio gains were compiled over an out-of-sample (OS) period. This means, of course, that I estimated the predictive regression on historical data that preceded and did not include the OS or test data.

Well, today I’m here to report to you that it looks like it is officially possible to achieve some predictability of stock market returns in out-of-sample data.

One authoritative source is Forecasting Stock Returns, an outstanding review by Rapach and Zhou  in the recent, second volume of the Handbook of Economic Forecasting.

The story is fascinating.

For one thing, most of the successful models achieve their best performance – in terms of beating market averages or other common benchmarks – during recessions.

And it appears that technical market indicators, such as the oscillators, momentum, and volume metrics so common in stock trading sites, have predictive value. So do a range of macroeconomic indicators.

But these two classes of predictors – technical market and macroeconomic indicators – are roughly complementary in their performance through the business cycle. As Christopher Neeley et al detail in Forecasting the Equity Risk Premium: The Role of Technical Indicators,

Macroeconomic variables typically fail to detect the decline in the actual equity risk premium early in recessions, but generally do detect the increase in the actual equity risk premium late in recessions. Technical indicators exhibit the opposite pattern: they pick up the decline in the actual premium early in recessions, but fail to match the unusually high premium late in recessions.

Stock Market Predictors – Macroeconomic and Technical Indicators

Rapach and Zhou highlight fourteen macroeconomic predictors popular in the finance literature.

1. Log dividend-price ratio (DP): log of a 12-month moving sum of dividends paid on the S&P 500 index minus the log of stock prices (S&P 500 index).

2. Log dividend yield (DY): log of a 12-month moving sum of dividends minus the log of lagged stock prices.

3. Log earnings-price ratio (EP): log of a 12-month moving sum of earnings on the S&P 500 index minus the log of stock prices.

4. Log dividend-payout ratio (DE): log of a 12-month moving sum of dividends minus the log of a 12-month moving sum of earnings.

5. Stock variance (SVAR): monthly sum of squared daily returns on the S&P 500 index.

6. Book-to-market ratio (BM): book-to-market value ratio for the DJIA.

7. Net equity expansion (NTIS): ratio of a 12-month moving sum of net equity issues by NYSE-listed stocks to the total end-of-year market capitalization of NYSE stocks.

8. Treasury bill rate (TBL): interest rate on a three-month Treasury bill (secondary market).

9. Long-term yield (LTY): long-term government bond yield.

10. Long-term return (LTR): return on long-term government bonds.

11. Term spread (TMS): long-term yield minus the Treasury bill rate.

12. Default yield spread (DFY): difference between BAA- and AAA-rated corporate bond yields.

13. Default return spread (DFR): long-term corporate bond return minus the long-term government bond return.

14. Inflation (INFL): calculated from the CPI (all urban consumers

In addition, there are technical indicators, which are generally moving average, momentum, or volume-based.

The moving average indicators typically provide a buy or sell signal based on a comparing two moving averages – a short and a long period MA.

Momentum based rules are based on the time trajectory of prices. A current stock price higher than its level some number of periods ago indicates “positive” momentum and expected excess returns, and generates a buy signal.

Momentum rules can be combined with information about the volume of stock purchases, such as Granville’s on-balance volume.

Each of these predictors can be mapped onto equity premium excess returns – measured by the rate of return on the S&P 500 index net of return on a risk-free asset. This mapping is a simple bi-variate regression with equity returns from time t on the left side of the equation and the economic predictor lagged by one time period on the right side of the equation. Monthly data are used from 1927 to 2008. The out-of-sample (OS) period is extensive, dating from the 1950’s, and includes most of the post-war recessions.

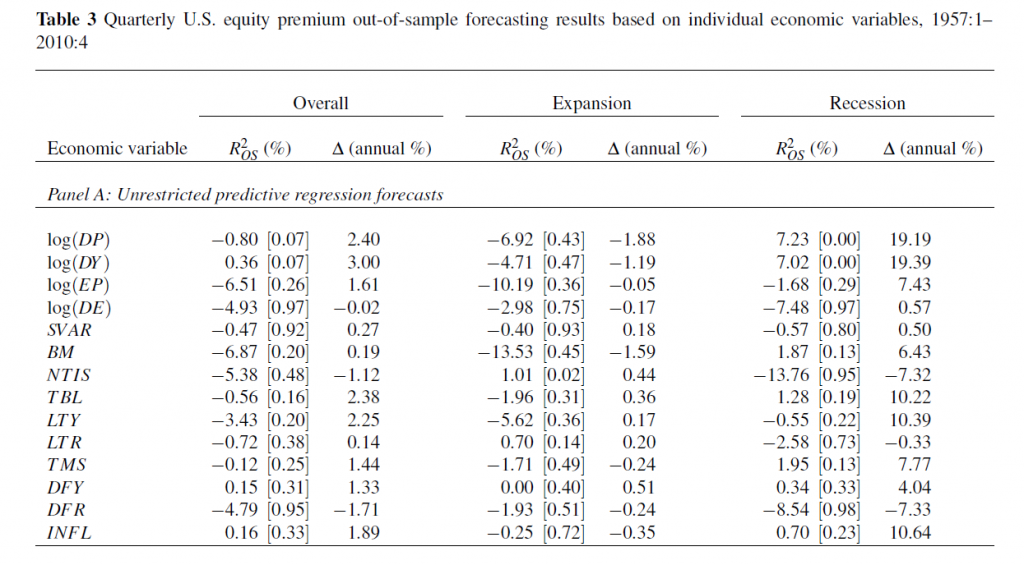
The following table shows what the authors call out-of-sample (OS) R2 for the 14 so-called macroeconomic variables, based on a table in the Handbook of Forecasting chapter. The OS R2 is equal to 1 minus a ratio. This ratio has the mean square forecast error (MSFE) of the predictor forecast in the numerator and the MSFE of the forecast based on historic average equity returns in the denominator. So if the economic indicator functions to improve the OS forecast of equity returns, the OS R2 is positive. If, on the other hand, the historic average trumps the economic indicator forecast, the OS R2 is negative.

Rapach1

(click to enlarge).

Overall, most of the macro predictors in this list don’t make it.  Thus, 12 of the 14 OS R2 statistics are negative in the second column of the Table, indicating that the predictive regression forecast has a higher MSFE than the historical average.

For two of the predictors with a positive out-of-sample R2, the p-values reported in the brackets are greater than 0.10, so that these predictors do not display statistically significant out-of-sample performance at conventional levels.

Thus, the first two columns in this table, under “Overall”, support a skeptical view of the predictability of equity returns.

However, during recessions, the situation is different.

For several the predictors, the R2 OS statistics move from being negative (and typically below -1%) during expansions to 1% or above during recessions. Furthermore, some of these R2 OS statistics are significant at conventional levels during recessions according to the  p-values, despite the decreased number of available observations.

Now imposing restrictions on the regression coefficients substantially improves this forecast performance, as the lower panel (not shown) in this table shows.

Rapach and Zhou were coauthors of the study with Neeley, published earlier as a working paper with the St. Louis Federal Reserve.

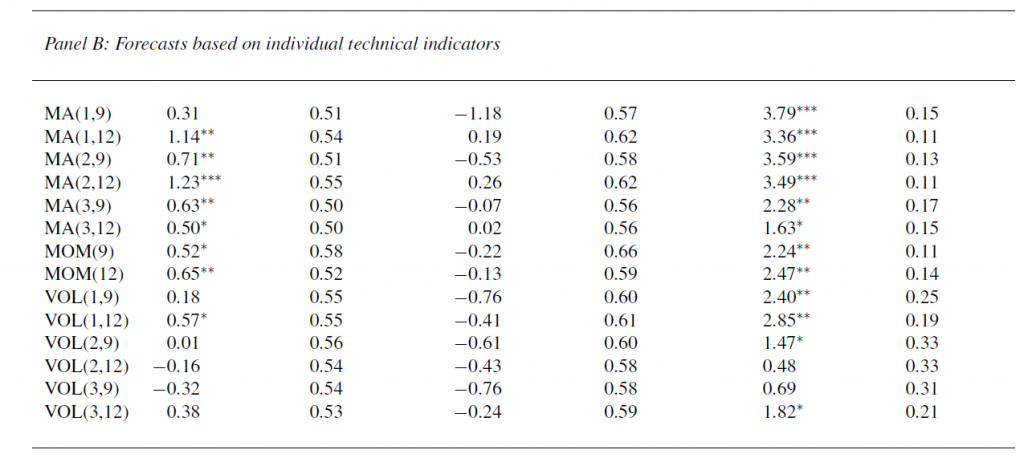
This working paper is where we get the interesting report about how technical factors add to the predictability of equity returns (again, click to enlarge).

RapachNeeley

This table has the same headings for the columns as Table 3 above.

It shows out-of-sample forecasting results for several technical indicators, using basically the same dataset, for the overall OS period, for expansions, and recessions in this period dating from the 1950’s to 2008.

In fact, these technical indicators generally seem to do better than the 14 macroeconomic indicators.

Low OS R2

Even when these models perform their best, their increase in mean square forecast error (MSFE) is only slightly more than the MSFE of the benchmark historic average return estimate.

This improved performance, however, can still achieve portfolio gains for investors, based on various trading rules, and, as both papers point out, investors can use the information in these forecasts to balance their portfolios, even when the underlying forecast equations are not statistically significant by conventional standards. Interesting argument, and I need to review it further to fully understand it.

In any case, my experience with an autoregressive model for the S&P 500 is that trading rules can be devised which produce portfolio gains over a buy and hold strategy, even when the Ris on the order of 1 or a few percent. All you have to do is correctly predict the sign of the return on the following trading day, for instance, and doing this a little more than 50 percent of the time produces profits.

Rapach and Zhou, in fact, develop insights into how predictability of stock returns can be consistent with rational expectations – providing the relevant improvements in predictability are bounded to be low enough.

Some Thoughts

There is lots more to say about this, naturally. And I hope to have further comments here soon.

But, for the time being, I have one question.

The is why econometricians of the caliber of Rapach, Zhou, and Neeley persist in relying on tests of statistical significance which are predicated, in a strict sense, on the normality of the residuals of these financial return regressions.

I’ve looked at this some, and it seems the t-statistic is somewhat robust to violations of normality of the underlying error distribution of the regression. However, residuals of a regression on equity rates of return can be very non-normal with fat tails and generally some skewness. I keep wondering whether anyone has really looked at how this translates into tests of statistical significance, or whether what we see on this topic is mostly arm-waving.

For my money, OS predictive performance is the key criterion.

Automatic Forecasting Programs – the Hyndman Forecast Package for R

I finally started learning R.

It’s a vector and matrix-based statistical programming language, a lot like MathWorks Matlab and GAUSS. The great thing is that it is free. I have friends and colleagues who swear by it, so it was on my to-do list.

The more immediate motivation, however, was my interest in Rob Hyndman’s automatic time series forecast package for R, described rather elegantly in an article in the Journal of Statistical Software.

This is worth looking over, even if you don’t have immediate access to R.

Hyndman and Exponential Smoothing

Hyndman, along with several others, put the final touches on a classification of exponential smoothing models, based on the state space approach. This facilitates establishing confidence intervals for exponential smoothing forecasts, for one thing, and provides further insight into the modeling options.

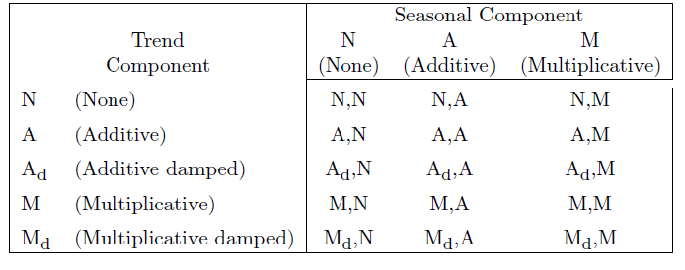
There are, for example, 15 widely acknowledged exponential smoothing methods, based on whether trend and seasonal components, if present, are additive or multiplicative, and also whether any trend is damped.

15expmethods

When either additive or multiplicative error processes are added to these models in a state space framewoprk, the number of modeling possibilities rises from 15 to 30.

One thing the Hyndman R Package does is run all the relevant models from this superset on any time series provided by the user, picking a recommended model for use in forecasting with the Aikaike information criterion.

Hyndman and Khandakar comment,

Forecast accuracy measures such as mean squared error (MSE) can be used for selecting a model for a given set of data, provided the errors are computed from data in a hold-out set and not from the same data as were used for model estimation. However, there are often too few out-of-sample errors to draw reliable conclusions. Consequently, a penalized method based on the in-sample  t is usually better.One such approach uses a penalized likelihood such as Akaike’s Information Criterion… We select the model that minimizes the AIC amongst all of the models that are appropriate for the data.

Interestingly,

The AIC also provides a method for selecting between the additive and multiplicative error models. The point forecasts from the two models are identical so that standard forecast accuracy measures such as the MSE or mean absolute percentage error (MAPE) are unable to select between the error types. The AIC is able to select between the error types because it is based on likelihood rather than one-step forecasts.

So the automatic forecasting algorithm, involves the following steps:

1. For each series, apply all models that are appropriate, optimizing the parameters (both smoothing parameters and the initial state variable) of the model in each case.

2. Select the best of the models according to the AIC.

3. Produce point forecasts using the best model (with optimized parameters) for as many steps ahead as required.

4. Obtain prediction intervals for the best model either using the analytical results of Hyndman et al. (2005b), or by simulating future sample paths..

This package also includes an automatic forecast module for ARIMA time series modeling.

One thing I like about Hyndman’s approach is his disclosure of methods. This, of course, is in contrast with leading competitors in the automatic forecasting market space –notably Forecast Pro and Autobox.

Certainly, go to Rob J Hyndman’s blog and website to look over the talk (with slides) Automatic time series forecasting. Hyndman’s blog, mentioned previously in the post on bagging time series, is a must-read for statisticians and data analysts.

Quick Implementation of the Hyndman R Package and a Test

But what about using this package?

Well, first you have to install R on your computer. This is pretty straight-forward, with the latest versions of the program available at the CRAN site. I downloaded it to a machine using Windows 8 as the OS. I downloaded both the 32 and 64-bit versions, just to cover my bases.

Then, it turns out that, when you launch R, a simple menu comes up with seven options, and a set of icons underneath. Below that there is the work area.

Go to the “Packages” menu option. Scroll down until you come on “forecast” and load that.

That’s the Hyndman Forecast Package for R.

So now you are ready to go, but, of course, you need to learn a little bit of R.

You can learn a lot by implementing code from the documentation for the Hyndman R package. The version corresponding to the R file that can currently be downloaded is at

http://cran.r-project.org/web/packages/forecast/forecast.pdf

Here are some general tutorials:

http://cran.r-project.org/doc/contrib/Verzani-SimpleR.pdf

http://cyclismo.org/tutorial/R/

http://cran.r-project.org/doc/manuals/R-intro.html#Simple-manipulations-numbers-and-vectors

http://www.statmethods.net/

And here is a discussion of how to import data into R and then convert it to a time series – which you will need to do for the Hyndman package.

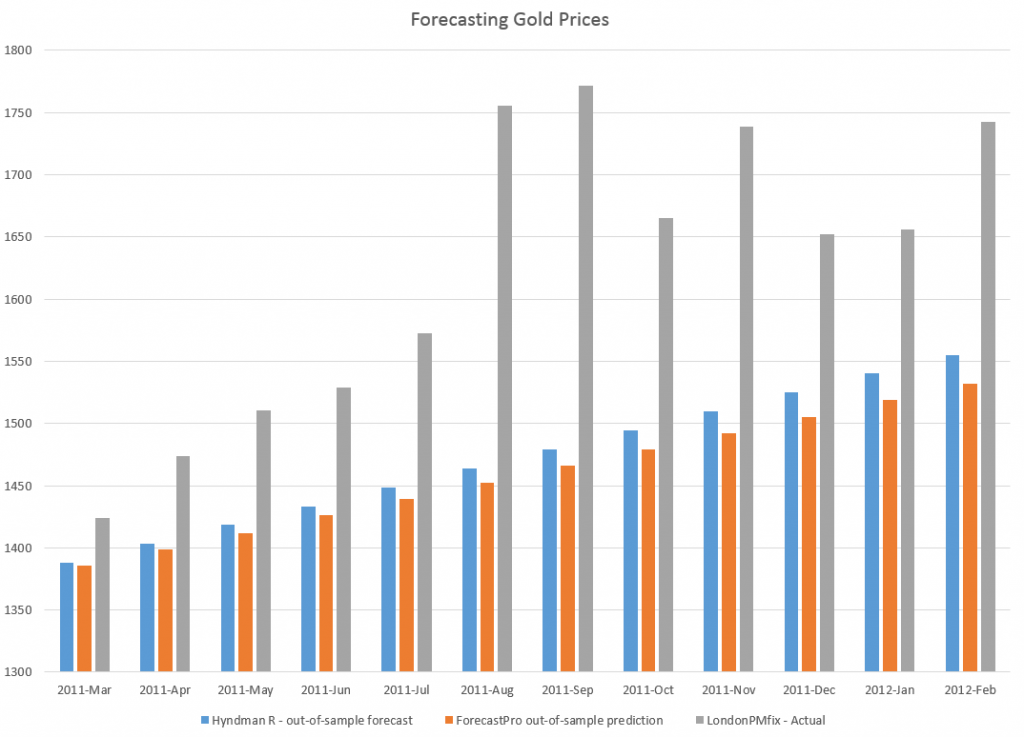
I used the exponential smoothing module to forecast monthly averages from London gold PM fix price series, comparing the results with a ForecastPro run. I utilized data from 2007 to February 2011 as a training sample, and produced forecasts for the next twelve months with both programs.

The Hyndman R package and exponential smoothing module outperformed Forecast Pro in this instance, as the following chart shows.

RFPcomp

Another positive about the R package is it is possible to write code to produce a whole number of such out-of-sample forecasts to get an idea of how the module works with a time series under different regimes, e.g. recession, business recovery.

I’m still caging together the knowledge to put programs like that together and appropriately save results.

But, my introduction to this automatic forecasting package and to R has been positive thus far.

Links – April 26, 2014

These Links help orient forecasting for companies and markets. I pay particular attention to IT developments. Climate change is another focus, since it is, as yet, not fully incorporated in most longer run strategic plans. Then, primary global markets, like China or the Eurozone, are important. I usually also include something on data science, predictive analytics methods, or developments in economics. Today, I include an amazing YouTube of an ape lighting a fire with matches.

China

Xinhua Insight: Property bubble will not wreck China’s economy

Information Technology (IT)

Thoughts on Amazon earnings for Q1 2014

Amazon

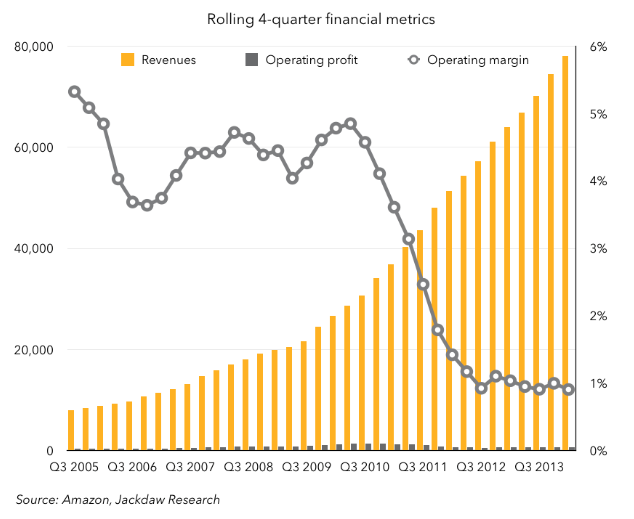
This chart perfectly captures Amazon’s current strategy: very high growth at 1% operating margins, with the low margins caused by massive investment in the infrastructure necessary to drive growth. It very much feels as though Amazon recognizes that there’s a limited window of opportunity for it to build the sort of scale and infrastructure necessary to dominate e-commerce before anyone else does, and it’s scraping by with minimal margins in order to capture as much as possible of that opportunity before it closes.

Apple just became the world’s biggest-dividend stock

Apple

The Disruptive Potential of Artificial Intelligence Applications Interesting discussion of vertical search, virtual assistants, and online product recommendations.

Hi-tech giants eschew corporate R&D, says report

..the days of these corporate “idea factories” are over according to a new study published by the American Institute of Physics (AIP). Entitled Physics Entrepreneurship and Innovation (PDF), the 308-page report argues that many large businesses are closing in-house research facilities and instead buying in new expertise and technologies by acquiring hi-tech start-ups.

Climate Change

Commodity Investors Brace for El Niño

Commodities investors are bracing themselves for the ever-growing possibility for the occurrence of a weather phenomenon known as El Niño by mid-year which threatens to play havoc with commodities markets ranging from cocoa to zinc.

The El Niño phenomenon, which tends to occur every 3-6 years, is associated with above-average water temperatures in the central and eastern Pacific and can, in its worst form, bring drought to West Africa (the world’s largest cocoa producing region), less rainfall to India during its vital Monsoon season and drier conditions for the cultivation of crops in Australia.

Economics

Researchers Tested The ‘Gambler’s Fallacy’ On Real-Life Gamblers And Stumbled Upon An Amazing Realization I love this stuff. I always think of my poker group.

..gamblers appear to be behaving as though they believe in the gambler’s fallacy, that winning or losing a bunch of bets in a row means that the next bet is more likely to go the other way. Their reactions to that belief — with winners taking safer bets under the assumption they’re going to lose and losers taking long-shot bets believing their luck is about to change — lead to the opposite effect of making the streaks longer

Foreign Affairs Focus on Books: Thomas Piketty on Economic Inequality


Is the U.S. Shale Boom Going Bust?

Among drilling critics and the press, contentious talk of a “shale bubble” and the threat of a sudden collapse of America’s oil and gas boom have been percolating for some time. While the most dire of these warnings are probably overstated, a host of geological and economic realities increasingly suggest that the party might not last as long as most Americans think.

Apes Can Definitely Use Tools

Bonobo Or Boy Scout? Great Ape Lights Fire, Roasts Marshmallows


The Interest Elasticity of Housing Demand

What we really want to know, in terms of real estate market projections, is the current or effective interest elasticity of home sales.

So, given that the US Federal Reserve has embarked on the “taper,” we know long term interest rates will rise (and have since the end of 2012).

What, then, is the likely impact of moving the 30 year fixed mortgage rate from around 4 percent back to its historic level of six percent or higher?

What is an Interest Elasticity?

Recall that the concept of a demand elasticity here is the percentage change in demand – this case housing sales, divided by the percentage change in the mortgage interest rate.

Typically, thus, the interest elasticity of housing demand is a negative number, indicating that higher interest rates result in lower housing demand, other things being equal.

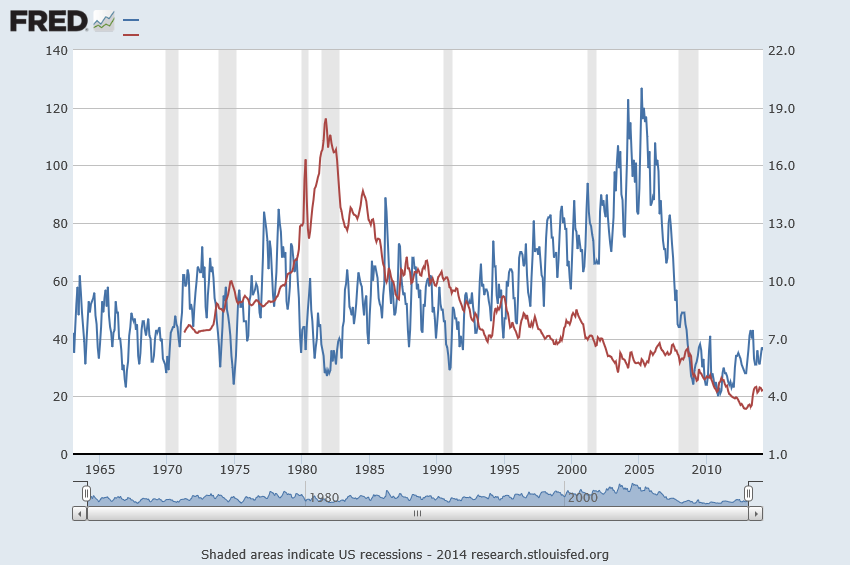
This “other things being equal” (ceteris paribus) is the hooker, of course, as is suggested by the following chart from FRED.

30mortsale

Here the red line is the 30 year fixed mortgage rate (right vertical axis) and the blue line is housing sales (left vertical axis).

A Rough and Ready Interest Rate Elasticity

Now the thing that jumps out at you when you glance over these two curves is the way housing sales (the blue line) drops when the 30 year fixed mortgage rate went through the roof in about 1982, reaching a peak of nearly 20 percent.

After the rates came down again in about 1985, an approximately 20 year period of declining mortgage interest rates ensued – certainly with bobbles and blips in this trend.

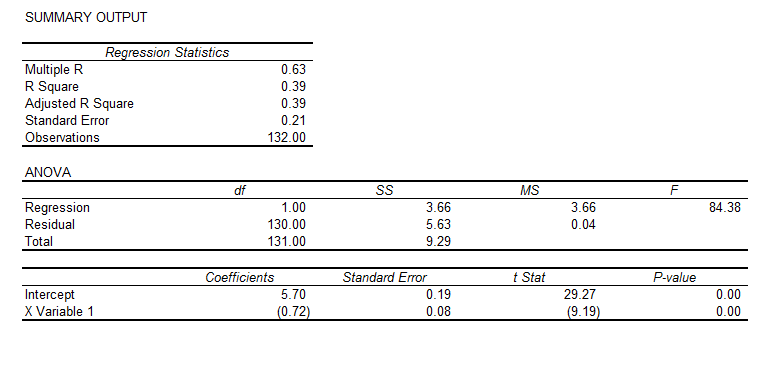
Now suppose we take just the period 1975-85, and calculate a simple interest rate elasticity. This involves getting the raw numbers behind these lines on the chart, and taking log transformations of them. We calculate the regression,

interestelasticityregThis corresponds to the equation,

ln(sales)=   5.7   –   0.72*ln(r)

where the t-statistics of the constant term and coefficient of the log of the interest rate r are highly significant, statistically.

This equation implies that the interest elasticity of housing sales in this period is -0.72. So a 10 percent increase in the 30-year fixed mortgage rate is associated with an about 7 percent reduction in housing sales, other things being equal.

In the spirit of heroic generalization, let’s test this elasticity by looking at the reduction in the mortgage rate after 1985 to 2005, and compare this percent change with the change in the housing sales over this period.

So at the beginning of 1986, the mortgage rate was 10.8 and sales were running 55,000 per month. At the end of 2005, sales had risen to 87, 000 per month and the 30 year mortgage rate for December was 6.27.

So the mortgage interest rates fell by 53 percent and housing sales rose 45 percent – calculating these percentage changes over the average base of the interest rates and house sales. Applying a -0.72 price elasticity to the (negative) percent change in interest rates suggests an increase in housing sales of 38 percent.

That’s quite remarkable, considering other factors operative in this period, such as consistent population growth.

OK, so looking ahead, if the 30 year fixed mortgage rate rises 33 percent to around 6 percent, housing sales could be expected to drop around 20-25 percent.

Interestingly, recent research conducted at the Wharton School and the Board of Governors of the Federal Reserve suggests that,

The relationship between the mortgage interest rate and a household’s demand for mortgage debt has important implications for a host of public policy questions. In this paper, we use detailed data on over 2.7 million mortgages to provide novel estimates of the interest rate elasticity of mortgage demand. Our empirical strategy exploits a discrete jump in interest rates generated by the conforming loan limit|the maximum loan size eligible for securitization by Fannie Mae and Freddie Mac. This discontinuity creates a large notch” in the intertemporal budget constraint of prospective mortgage borrowers, allowing us to identify the causal link between interest rates and mortgage demand by measuring the extent to which loan amounts bunch at the conforming limit. Under our preferred specifications, we estimate that 1 percentage point increase in the rate on a 30-year fixed-rate mortgage reduces first mortgage demand by between 2 and 3 percent. We also present evidence that about one third of the response is driven by borrowers who take out second mortgages while leaving their total mortgage balance unchanged. Accounting for these borrowers suggests a reduction in total mortgage debt of between 1.5 and 2 percent per percentage point increase in the interest rate. Using these estimates, we predict the changes in mortgage demand implied by past and proposed future increases to the guarantee fees charged by Fannie and Freddie. We conclude that these increases would directly reduce the dollar volume of new mortgage originations by well under 1 percent.

So a 33 percent increase in the 30 year fixed mortgage rate, according to this analysis, would reduce mortgage demand by well under 33 percent. So how about 20-25 percent?

I offer this “take-off” as an example of an exploratory analysis. Thus, the elasticity estimate developed with data from the period of greatest change in rates provides a ballpark estimate of the change in sales over a longer period of downward trending interest rates. This supports a forward projection, which, at a first order approximation seem consistent with estimates from a completely different line of analysis.

All this suggests a more comprehensive analysis might be warranted, taking into account population growth, inflation, and, possibly, other factors.

The marvels of applied economics in a forecasting context.

Lead picture courtesy of the University of Maryland Department of Economics.

Real Estate Forecasts – 1

Nationally, housing prices peaked in 2014, as the following Case-Shiller chart shows.

CS2014

The Case Shiller home price indices have been the gold standard and the focus of many forecasting efforts. A key feature is reliance on the “repeat sales method.” This uses data on properties that have sold at least twice to capture the appreciated value of each specific sales unit, holding quality constant.

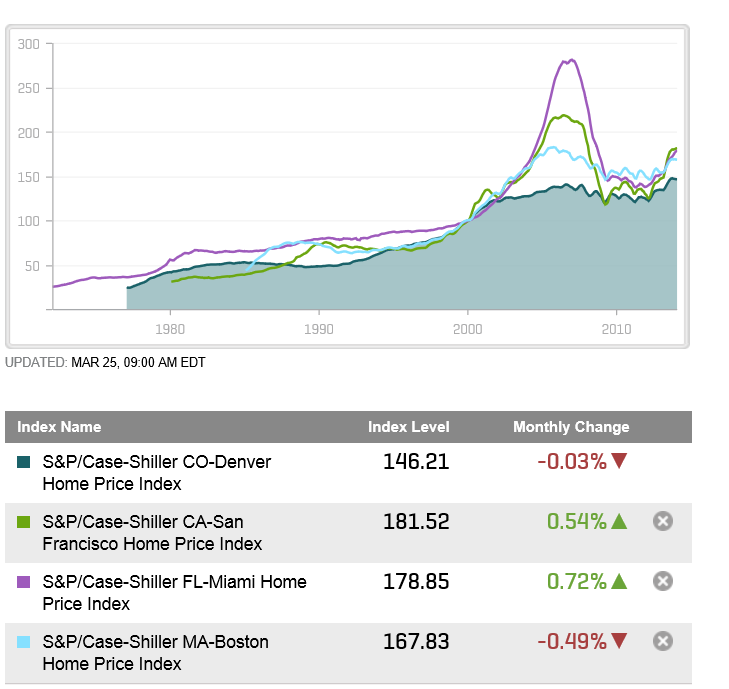
The following chart shows Case-Shiller (C-S) house indexes for four MSA’s (metropolitan statistical areas) – Denver, San Francisco, Miami, and Boston.

CScities

The price “bubble” was more dramatic in some cities than others.

Forecasting Housing Prices and Housing Starts

The challenge to predictive modeling is more or less the same – how to account for a curve which initially rises, and then falls (in some cases dramatically), “stabilizes” and begins to climb again, although with increased volatility, again as long term interest rates rise. 

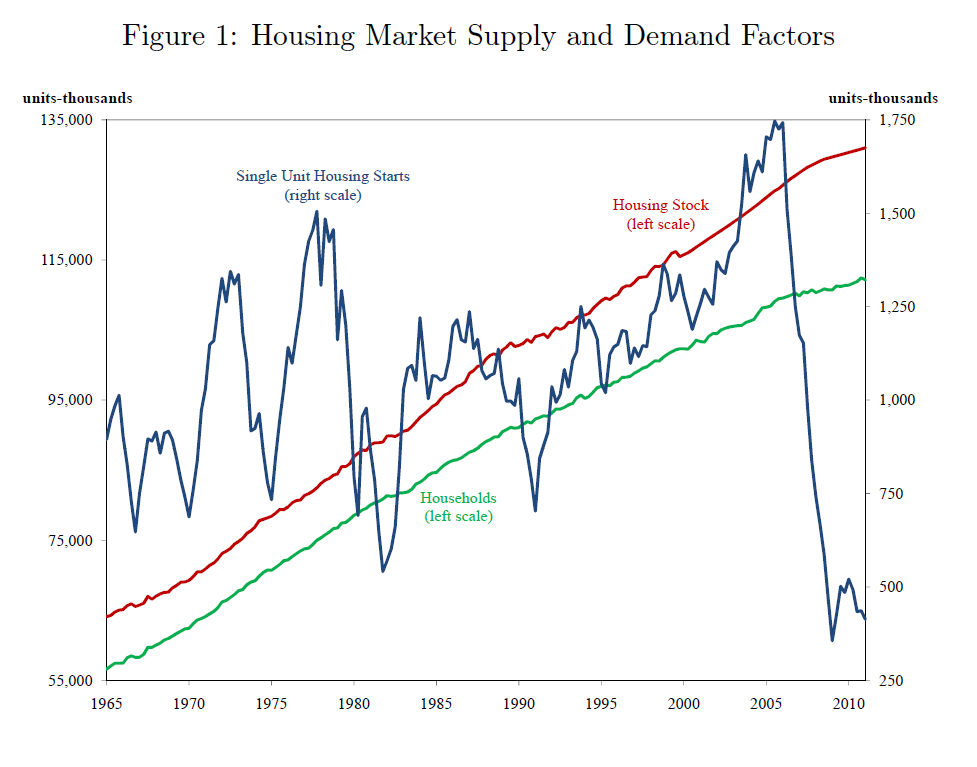
Volatility is a feature of housing starts, also, when compared with growth in households and the housing stock, as highlighted in the following graphic taken from an econometric analysis by San Francisco Federal Reserve analysts.

SandDfactorshousingThe fluctuations in housing starts track with drivers such as employment, energy prices, prices of construction materials, and real mortgage rates, but the short term forecasting models, including variables such as current listings and even Internet search activity, are promising.

Companies operating in this space include CoreLogic, Zillow and Moody’s Analytics. The sweet spot in all these services is to disaggregate housing price forecasts more local levels – the county level, for example.

Finally, in this survey of resources, one of the best housing and real estate blogs is Calculated Risk.

I’d like to post more on these predictive efforts, their statistical rationale, and their performance.

Also, the Federal Reserve “taper” of Quantitative Easing (QE) currently underway is impacting long term interest rates and mortgage rates.

The key question is whether the US housing market can withstand return to “normal” interest rate conditions in the next one to two years, and how that will play out.

Links – end of March

US Economy and Social Issues

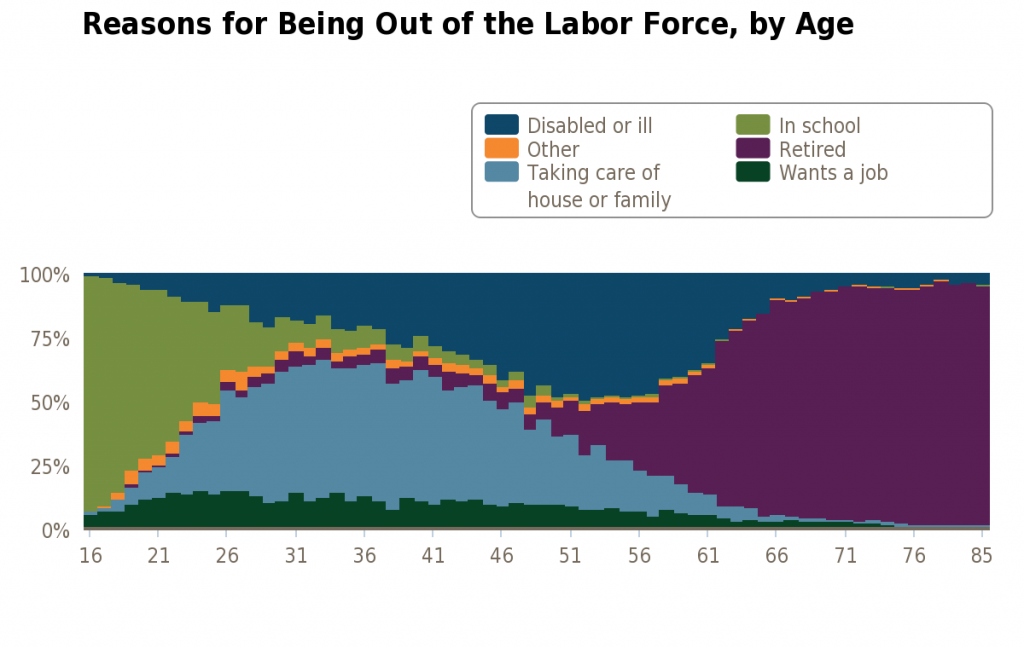
Reasons for Declining Labor Force Participation

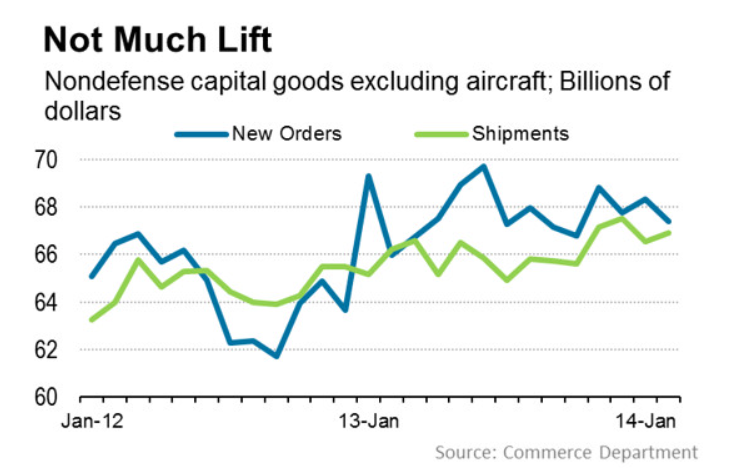
LFchartVital Signs: Still No Momentum in Business Spending

investment

Urban Institute Study – How big is the underground sex economy in eight cities employs an advanced statistical design. It’s sort of a model study, really.

Americans Can’t Retire When Bill Gross Sees Repression

Feeble returns on the safest investments such as bank deposits and fixed-income securities represent a “financial repression” transferring money from savers to borrowers, says Bill Gross, manager of the world’s biggest bond fund.

Robert Reich – The New Billionaire Political Bosses

American democracy used to depend on political parties that more or less represented most of us. Political scientists of the 1950s and 1960s marveled at American “pluralism,” by which they meant the capacities of parties and other membership groups to reflect the preferences of the vast majority of citizens.

Then around a quarter century ago, as income and wealth began concentrating at the top, the Republican and Democratic Parties started to morph into mechanisms for extracting money, mostly from wealthy people.

Finally, after the Supreme Court’s “Citizen’s United” decision in 2010, billionaires began creating their own political mechanisms, separate from the political parties. They started providing big money directly to political candidates of their choice, and creating their own media campaigns to sway public opinion toward their own views.

Global Economy

Top global risks you can’t ignore – good, short read

How Can Africa’s Water and Sanitation Shortfall be Solved? – interesting comments by experts on the scene, including –

Most African water utilities began experiencing a nose-dive in the late 1970s under World Bank and IMF policies. Many countries were suffering from serious trade deficits which had enormous implications for their budgets, incomes, and their abilities to honour loan obligations to, among others, bilateral and multilateral partners. These difficulties for African countries coincided around that period, with a major shift in global economic thought; a shift from heterodox economic thinking which favoured state intervention in critical sectors of the economy, to neoliberal economic thought which is more hostile to state intervention and prefers the deregulation of markets and their unfettered operation. This thought became dominant in the IMF and World Bank and influenced structural adjustment austerity packages that the two institutions prescribed to the struggling African economies at the time. This point is fundamental and cannot be divorced from any comprehensive analysis of the access deficit in African countries.

The austerity measures enforced by the Bank and IMF ensured a drastic reduction of state funding to the utilities, resulting in deterioration of facilities, poor conditions for staff and a mass exodus of expert staff. In the face of the resulting difficulties, the Bank and IMF held out only one option for the governments; the option of full cost recovery and of privatisation. This sealed the expectations of any funding for the sector as the private sector found the water sector highly risky to invest in. Following the common interventions set out by the World Bank, the countries achieved mostly poor results.

Contrary to much mainstream discourse, neither privatisation nor commercialisation constitute an adequate or sustainable way of managing urban water utilities to ensure access to people in Africa given the extreme poverty that confronts a significant portion of the population. The solution lies in a progressive tax-supported water delivery system that ensures access for all, supported by a management structure and a balanced set of incentives that ensure performance.

Analytics

Machine Learning in 7 Pictures

Basic machine learning concepts of Bias vs Variance Tradeoff, Avoiding overfitting, Bayesian inference and Occam razor, Feature combination, Non-linear basis functions, and more – explained via pictures

The Universe

Great picture of the planet Mercury https://twitter.com/Iearnsomething/status/448165339290173440/photo/1

Mercury

Interest Rates – 2

I’ve been looking at forecasting interest rates, the accuracy of interest rate forecasts, and teasing out predictive information from the yield curve.

This literature can be intensely theoretical and statistically demanding. But it might be quickly summarized by saying that, for horizons of more than a few months, most forecasts (such as from the Wall Street Journal’s Panel of Economists) do not beat a random walk forecast.

At the same time, there are hints that improvements on a random walk forecast might be possible under special circumstances, or for periods of time.

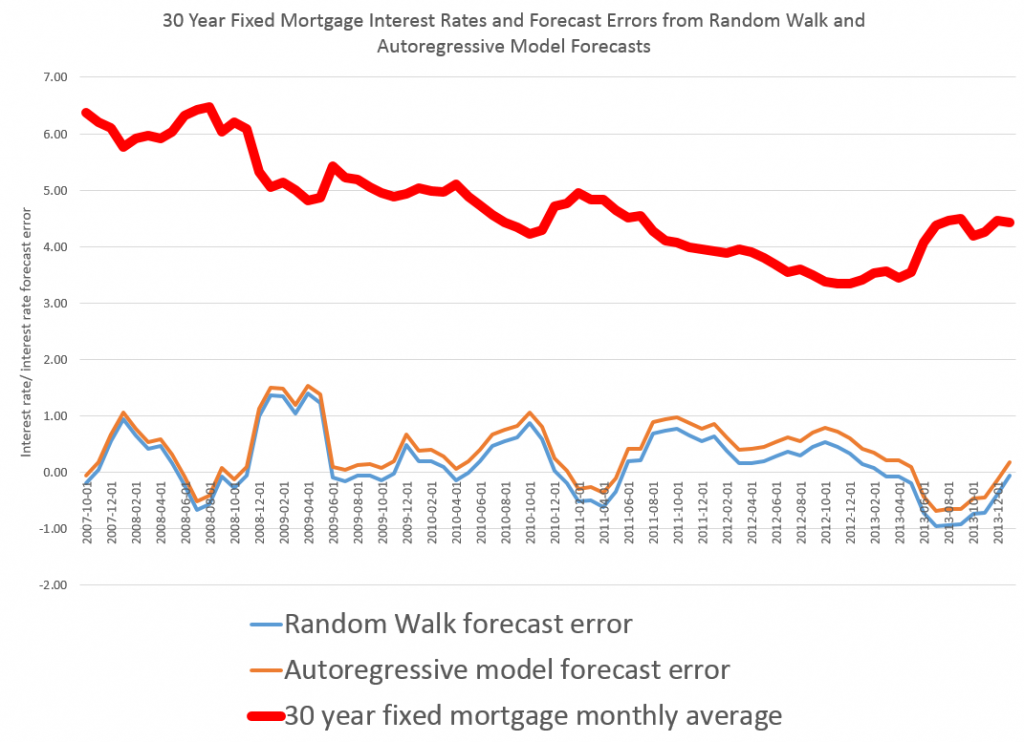
For example, suppose we attempt to forecast the 30 year fixed mortgage rate monthly averages, picking a six month forecast horizon.

The following chart compares a random walk forecast with an autoregressive (AR) model.

30yrfixed2

Let’s dwell for a moment on some of the underlying details of the data and forecast models.

The thick red line is the 30 year fixed mortgage rate for the prediction period which extends from 2007 to the most recent monthly average in 2014 in January 2014. These mortgage rates are downloaded from the St. Louis Fed data site FRED.

This is, incidentally, an out-of-sample period, as the autoregressive model is estimated over data beginning in April 1971 and ending September 2007. The autoregressive model is simple, employing a single explanatory variable, which is the 30 year fixed rate at a lag of six months. It has the following form,

rt = k + βrt-6

where the constant term k and the coefficient β of the lagged rate rt-6 are estimated by ordinary least squares (OLS).

The random walk model forecast, as always, is the most current value projected ahead however many periods there are in the forecast horizon. This works out to using the value of the 30 year fixed mortgage in any month as the best forecast of the rate that will obtain six months in the future.

Finally, the errors for the random walk and autoregressive models are calculated as the forecast minus the actual value.

When an Autoregressive Model Beats a Random Walk Forecast

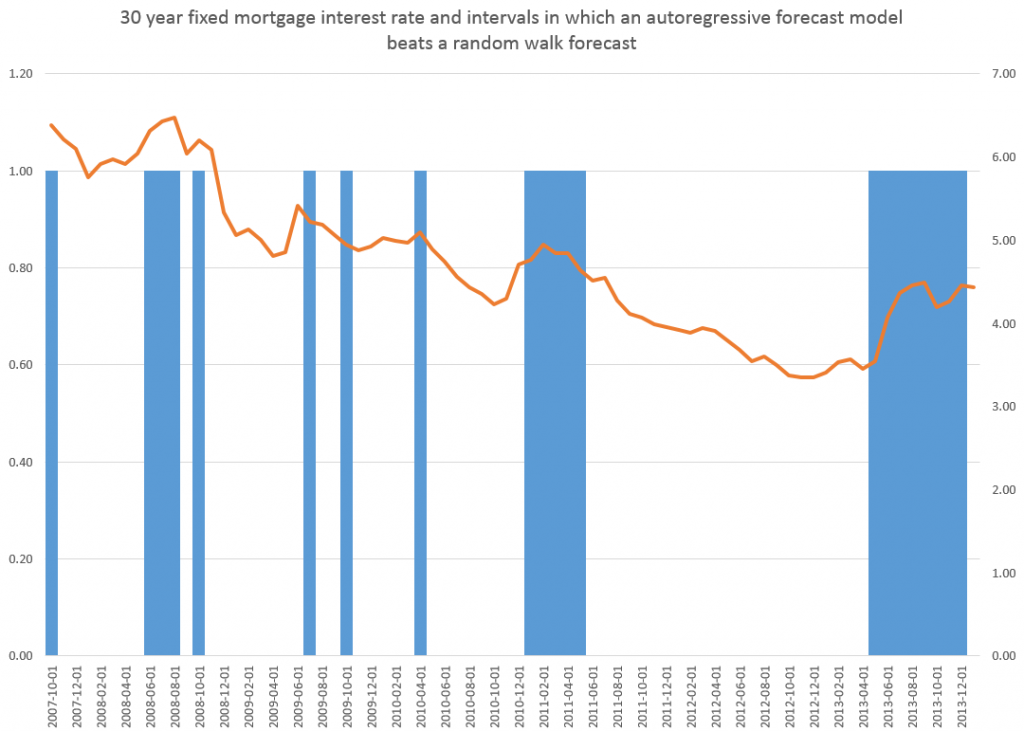
The random walk errors are smaller in absolute value than the autoregressive model errors over most of this out-of-sample period, but there are times when this is not true, as shown in the graph below.

30yrfixedARbetter

This chart itself suggests that further work could be done on optimizing the autoregressive model, perhaps by adding further corrections from the residuals, which themselves are autocorrelated.

However, just taking this at face value, it’s clear the AR model beats the random walk forecast when the direction of interest rates changes from a downward movement.

Does this mean that going forward, an AR model, probably considerably more sophisticated than developed for this exercise, could beat a random walk forecast over six month forecast horizons?

That’s an interesting and bankable question. It of course depends on the rate at which the Fed “withdraws the punch bowl” but it’s also clear the Fed is no longer in complete control in this situation. The markets themselves will develop a dynamic based on expectations and so forth.

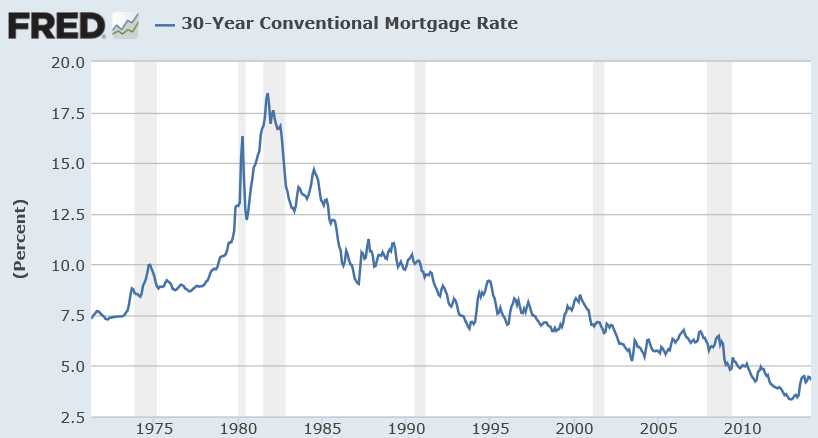
In closing, for reference, I include a longer picture of the 30 year fixed mortgage rates, which as can be seen, resemble the whole spectrum of rates in having a peak in the early 1980’s and showing what amounts to trends before and after that.

30yrfixedFRED

Forecasting the Price of Gold – 2

Searching “forecasting gold prices” on Google lands on a number of ARIMA (autoregressive integrated moving average) models of gold prices. Ideally, researchers focus on shorter term forecast horizons with this type of time series model.

I take a look at this approach here, moving onto multivariate approaches in subsequent posts.

Stylized Facts

These ARIMA models support stylized facts about gold prices such as: (1) gold prices constitute a nonstationary time series, (2) first differencing can reduce gold price time series to a stationary process, and, usually, (3) gold prices are random walks.

For example, consider daily gold prices from 1978 to the present.

DailyGold

This chart, based World Gold Council data and the London PM fix, shows gold prices do not fluctuate about a fixed level, but can move in patterns with a marked trend over several years.

The trick is to reduce such series to a mean stationary series through appropriate differencing and, perhaps, other data transformations, such as detrending and taking out seasonal variation. Guidance in this is provided by tools such as the autocorrelation function (ACF) and partial autocorrelation function (PACF) of the time series, as well as tests for unit roots.

Some Terminology

I want to talk about specific ARIMA models, such as ARIMA(0,1,1) or ARIMA(p,d,q), so it might be a good idea to review what this means.

Quickly, ARIMA models are described by three parameters: (1) the autoregressive parameter p, (2) the number of times d the time series needs to be differenced to reduce it to a mean stationary series, and (3) the moving average parameter q.

ARIMA(0,1,1) indicates a model where the original time series yt is differenced once (d=1), and which has one lagged moving average term.

If the original time series is yt, t=1,2,..n, the first differenced series is zt=yt-yt-1, and an ARIMA(0,1,1) model looks like,

zt = θ1εt-1

or converting back into the original series yt,

yt = μ + yt-1 + θ1εt-1

This is a random walk process with a drift term μ, incidentally.

As a note in the general case, the p and q parameters describe the span of the lags and moving average terms in the model.  This is often done with backshift operators Lk (click to enlarge)  

LagOperator

So you could have a sum of these backshift operators of different orders operating against yt or zt to generate a series of lags of order p. Similarly a sum of backshift operators of order q can operate against the error terms at various times. This supposedly provides a compact way of representing the general model with p lags and q moving average terms.

Similar terminology can indicate the nature of seasonality, when that is operative in a time series.

These parameters are determined by considering the autocorrelation function ACF and partial autocorrelation function PACF, as well as tests for unit roots.

I’ve seen this referred to as “reading the tea leaves.”

Gold Price ARIMA models

I’ve looked over several papers on ARIMA models for gold prices, and conducted my own analysis.

My research confirms that the ACF and PACF indicates gold prices (of course, always defined as from some data source and for some trading frequency) are, in fact, random walks.

So this means that we can take, for example, the recent research of Dr. M. Massarrat Ali Khan of College of Computer Science and Information System, Institute of Business Management, Korangi Creek, Karachi as representative in developing an ARIMA model to forecast gold prices.

Dr. Massarrat’s analysis uses daily London PM fix data from January 02, 2003 to March 1, 2012, concluding that an ARIMA(0,1,1) has the best forecasting performance. This research also applies unit root tests to verify that the daily gold price series is stationary, after first differencing. Significantly, an ARIMA(1,1,0) model produced roughly similar, but somewhat inferior forecasts.

I think some of the other attempts at ARIMA analysis of gold price time series illustrate various modeling problems.

For example there is the classic over-reach of research by Australian researchers in An overview of global gold market and gold price forecasting. These academics identify the nonstationarity of gold prices, but attempt a ten year forecast, based on a modeling approach that incorporates jumps as well as standard ARIMA structure.

A new model proposed a trend stationary process to solve the nonstationary problems in previous models. The advantage of this model is that it includes the jump and dip components into the model as parameters. The behaviour of historical commodities prices includes three differ- ent components: long-term reversion, diffusion and jump/dip diffusion. The proposed model was validated with historical gold prices. The model was then applied to forecast the gold price for the next 10 years. The results indicated that, assuming the current price jump initiated in 2007 behaves in the same manner as that experienced in 1978, the gold price would stay abnormally high up to the end of 2014. After that, the price would revert to the long-term trend until 2018.

As the introductory graph shows, this forecast issued in 2009 or 2010 was massively wrong, since gold prices slumped significantly after about 2012.

So much for long-term forecasts based on univariate time series.

Summing Up

I have not referenced many ARIMA forecasting papers relating to gold price I have seen, but focused on a couple – one which “gets it right” and another which makes a heroically wrong but interesting ten year forecast.

Gold prices appear to be random walks in many frequencies – daily, monthly average, and so forth.

Attempts at superimposing long term trends or even jump patterns seem destined to failure.

However, multivariate modeling approaches, when carefully implemented, may offer some hope of disentangling longer term trends and changes in volatility. I’m working on that post now.

Links – March 7, 2014

Stuff is bursting out all over, more or less in anticipation of the spring season – or World War III, however you might like to look at it. So I offer an assortment of links to topics which are central and interesting below.

Human Longevity Inc. (HLI) Launched to Promote Healthy Aging Using Advances in Genomics and Stem Cell Therapies Craig Venter – who launched a competing private and successful effort to map the human genome – is involved with this. Could be important.

MAA Celebrates Women’s History Month In celebration of Women’s History Month, the MAA has collected photographs and brief bios of notable female mathematicians from its Women of Mathematics poster. Emma Noether shown below – “mother” of Noetherian rings and other wonderous mathematical objects.

EmmaNoether

Three Business Benefits of Cloud Computing – price, access, and security

Welcome to the Big Data Economy This is the first chapter of a new eBook that details the 4 ways the future of data is cleaner, leaner, and smarter than its storied past. Download the entire eBook, Big Data Economy, for free here

Financial Sector Ignores Ukraine, Pushing Stocks Higher From March 6, video on how the Ukraine crisis has been absorbed by the market.

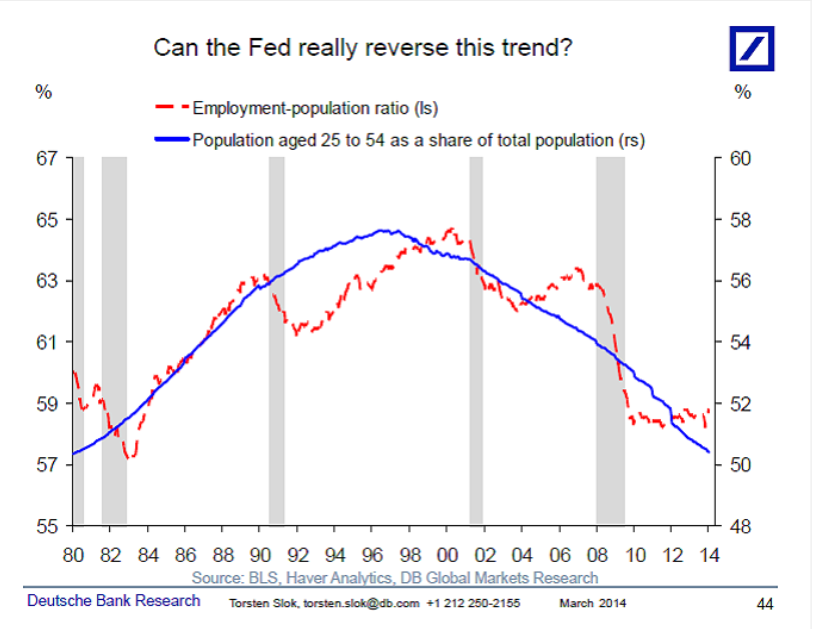
Employment-Population ratio Can the Fed reverse this trend?

EmpPopRatio

How to Predict the Next Revolution

…few people noticed an April 2013 blog post by British academic Richard Heeks, who is director of the University of Manchester’s Center for Development Informatics. In that post, Heeks predicted the Ukrainian revolution.

A e-government expert, Heeks devised his “Revolution 2.0” index as a toy or a learning tool. The index combines three elements: Freedom House’s Freedom on the Net scores, the International Telecommunication Union’s information and communication technology development index, and the Economist’s Democracy Index (reversed into an “Outrage Index” so that higher scores mean more plutocracy). The first component measures the degree of Internet freedom in a country, the second shows how widely Internet technology is used, and the third supplies the level of oppression.

“There are significant national differences in both the drivers to mass political protest and the ability of such protest movements to freely organize themselves online,” Heeks wrote. “Both of these combine to give us some sense of how likely ‘mass protest movements of the internet age’ are to form in any given country.”

Simply put, that means countries with little real-world democracy and a lot of online freedom stand the biggest chance of a Revolution 2.0. In April 2013, Ukraine topped Heeks’s list, closely followed by Argentina and Georgia. The Philippines, Brazil, Russia, Kenya, Nigeria, Azerbaijan and Jordan filled out the top 10.

Proletarian Robots Getting Cheaper to Exploit Good report on a Russian robot conference recently.

The Top Venture Capital Investors By Exit Activity – Which Firms See the Highest Share of IPOs?

Venture

Complete Subset Regressions

A couple of years or so ago, I analyzed a software customer satisfaction survey, focusing on larger corporate users. I had firmagraphics – specifying customer features (size, market segment) – and customer evaluation of product features and support, as well as technical training. Altogether, there were 200 questions that translated into metrics or variables, along with measures of customer satisfaction. Altogether, the survey elicited responses from about 5000 companies.

Now this is really sort of an Ur-problem for me. How do you discover relationships in this sort of data space? How do you pick out the most important variables?

Since researching this blog, I’ve learned a lot about this problem. And one of the more fascinating approaches is the recent development named complete subset regressions.

And before describing some Monte Carlo exploring this approach here, I’m pleased Elliot, Gargano, and Timmerman (EGT) validate an intuition I had with this “Ur-problem.” In the survey I mentioned above, I calculated a whole bunch of univariate regressions with customer satisfaction as the dependent variable and each questionnaire variable as the explanatory variable – sort of one step beyond calculating simple correlations. Then, it occurred to me that I might combine all these 200 simple regressions into a predictive relationship. To my surprise, EGT’s research indicates that might have worked, but not be as effective as complete subset regression.

Complete Subset Regression (CSR) Procedure

As I understand it, the idea behind CSR is you run regressions with all possible combinations of some number r less than the total number n of candidate or possible predictors. The final prediction is developed as a simple average of the forecasts from these regressions with r predictors. While some of these regressions may exhibit bias due to specification error and covariance between included and omitted variables, these biases tend to average out, when the right number r < n is selected.

So, maybe you have a database with m observations or cases on some target variable and n predictors.

And you are in the dark as to which of these n predictors or potential explanatory variables really do relate to the target variable.

That is, in a regression y = β01 x1 +…+βn xn some of the beta coefficients may in fact be zero, since there may be zero influence between the associated xi and the target variable y.

Of course, calling all the n variables xi i=1,…n “predictor variables” presupposes more than we know initially. Some of the xi could in fact be “irrelevant variables” with no influence on y.

In a nutshell, the CSR procedure involves taking all possible combinations of some subset r of the n total number of potential predictor variables in the database, and mapping or regressing all these possible combinations onto the dependent variable y. Then, for prediction, an average of the forecasts of all these regressions is often a better predictor than can be generated by other methods – such as the LASSO or bagging.

EGT offer a time series example as an empirical application. based on stock returns, quarterly from 1947-2010 and twelve (12) predictors. The authors determine that the best results are obtained with a small subset of the twelve predictors, and compare these results with ridge regression, bagging, Lasso and Bayesian Model Averaging.

The article in The Journal of Econometrics is well-worth purchasing, if you are not a subscriber. Otherwise, there is a draft in PDF format from 2012.

The combination of n things taken r at a time is n!/[(n-r)!(r!)] and increases faster than exponentially, as n increases. For large n, accordingly, it is necessary to sample from the possible set of combinations – a procedure which still can generate improvements in forecast accuracy over a “kitchen sink” regression (under circumstances further delineated below). Otherwise, you need a quantum computer to process very fat databases.

When CSR Works Best – Professor Elloitt

I had email correspondence with Professor Graham Elliott, one of the co-authors of the above-cited paper in the Journal of Econometrics.

His recommendation is that CSR works best with when there are “weak predictors” sort of buried among a superset of candidate variables,

If a few (say 3) of the variables have large coefficients such as that they result in a relatively large R-square for the prediction regression when they are all included, then CSR is not likely to be the best approach. In this case model selection has a high chance of finding a decent model, the kitchen sink model is not all that much worse (about 3/T times the variance of the residual where T is the sample size) and CSR is likely to be not that great… When there is clear evidence that a predictor should be included then it should be always included…, rather than sometimes as in our method. You will notice that in section 2.3 of the paper that we construct properties where beta is local to zero – what this math says in reality is that we mean the situation where there is very little clear evidence that any predictor is useful but we believe that some or all have some minor predictive ability (the stock market example is a clear case of this). This is the situation where we expect the method to work well. ..But at the end of the day, there is no perfect method for all situations.

I have been toying with “hidden variables” and, then, measurement error in the predictor variables in simulations that further validate Graham Elliot’s perspective that CSR works best with “weak predictors.”

Monte Carlo Simulation

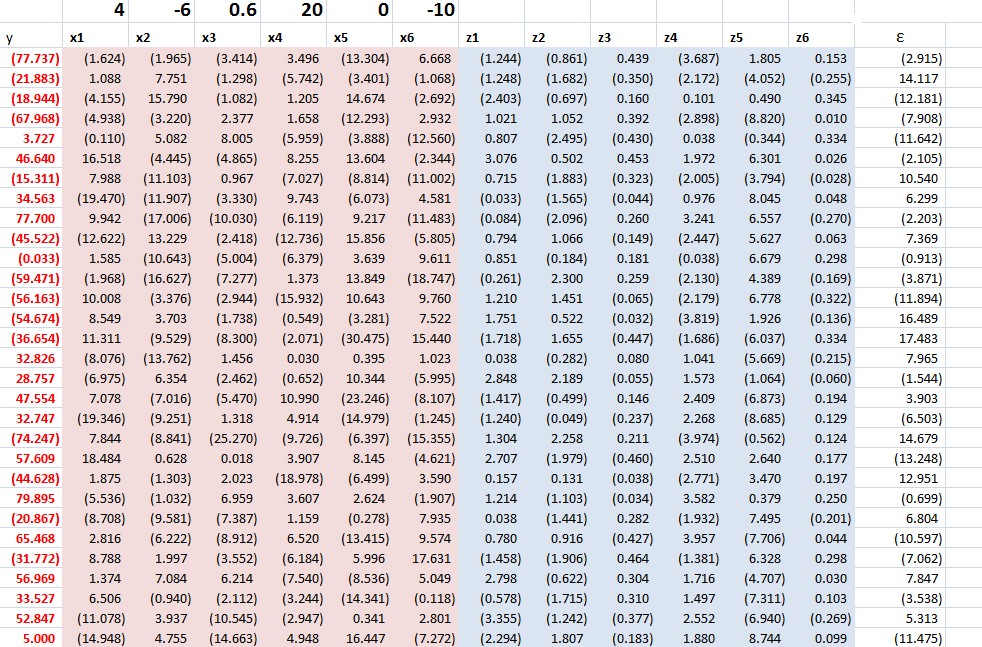
Here’s the spreadsheet for a relevant simulation (click to enlarge).

CSRTable

It is pretty easy to understand this spreadsheet, but it may take a few seconds. It is a case of latent variables, or underlying variables disguised by measurement error.

The z values determine the y value. The z values are multiplied by the bold face numbers in the top row, added together, and then the epsilon error ε value is added to this sum of terms to get each y value. You have to associate the first bold face coefficient with the first z variable, and so forth.

At the same time, an observer only has the x values at his or her disposal to estimate a predictive relationship.

These x variables are generated by adding a Gaussian error to the corresponding value of the z variables.

Note that z5 is an irrelevant variable, since its coefficient loading is zero.

This is a measurement error situation (see the lecture notes on “measurement error in X variables” ).

The relationship with all six regressors – the so-called “kitchen-sink” regression – clearly shows a situation of “weak predictors.”

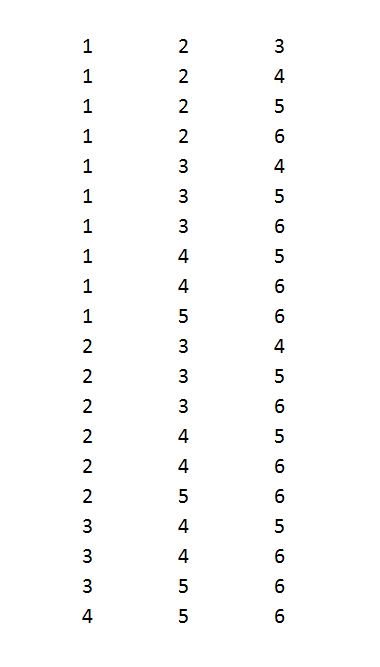
I consider all possible combinations of these 6 variables, taken 3 at a time, or 20 possible distinct combinations of regressors and resulting regressions.

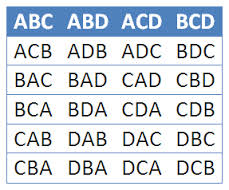
In terms of the mechanics of doing this, it’s helpful to set up the following type of listing of the combinations.

Combos

Each digit in the above numbers indicates a variable to include. So 123 indicates a regression with y and x1, x2, and x3. Note that writing the combinations in this way so they look like numbers in order of increasing size can be done by a simple algorithm for any r and n.

And I can generate thousands of cases by allowing the epsilon ε values and other random errors to vary.

In the specific run above, the CSR average soundly beats the mean square error (MSE) of this full specification in forecasts over ten out-of-sample values. The MSE of the kitchen sink regression, thus, is 2,440 while the MSE of the regression specifying all six regressors is 2653. It’s also true that picking the lowest within-sample MSE among the 20 possible combinations for k = 3 does not produce a lower MSE in the out-of-sample run.

This is characteristics of results in other draws of the random elements. I hesitate to characterize the totality without further studying the requirements for the number of runs, given the variances, and so forth.

I think CSR is exciting research, and hope to learn more about these procedures and report in future posts.